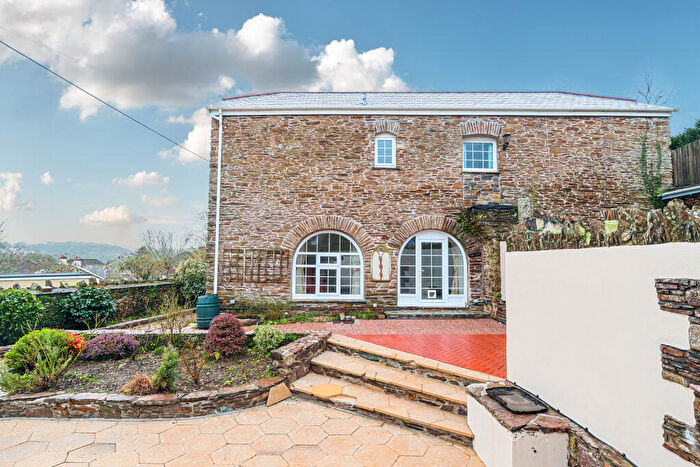
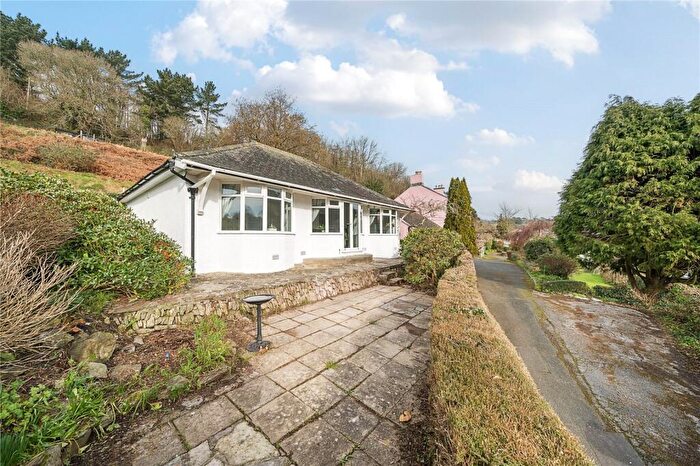
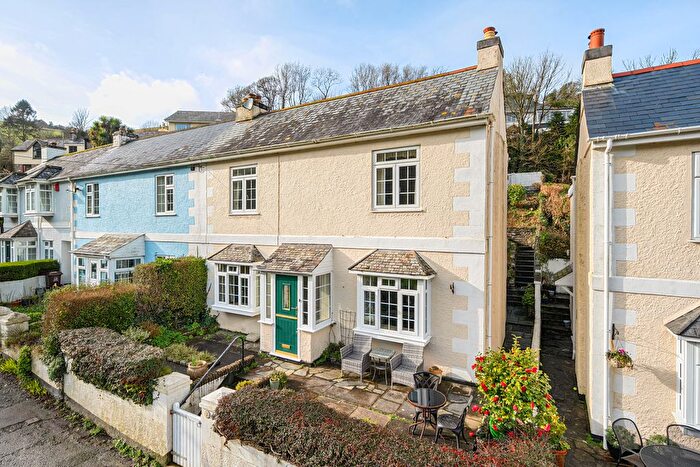
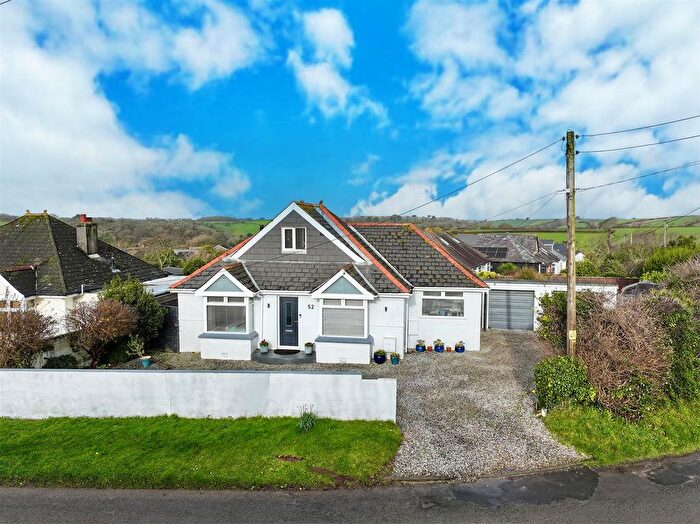
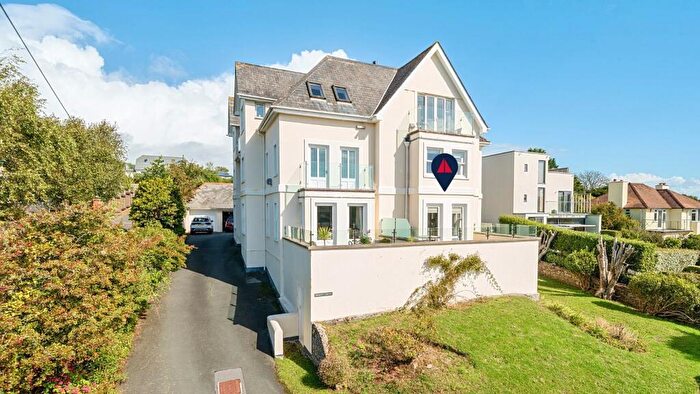
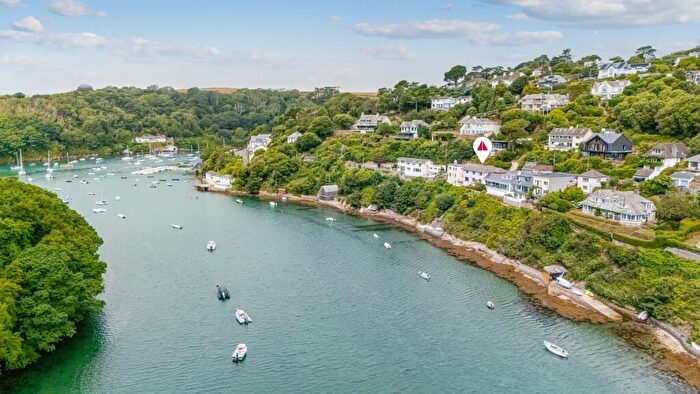
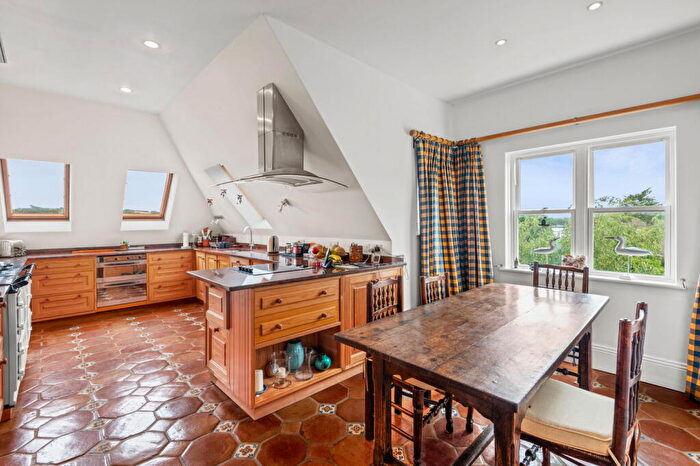
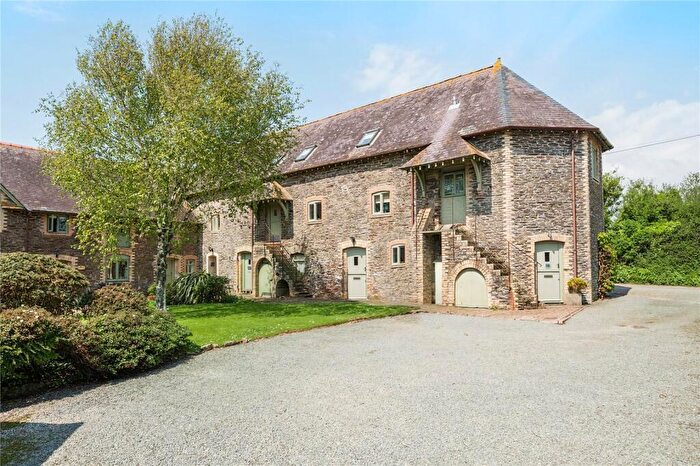
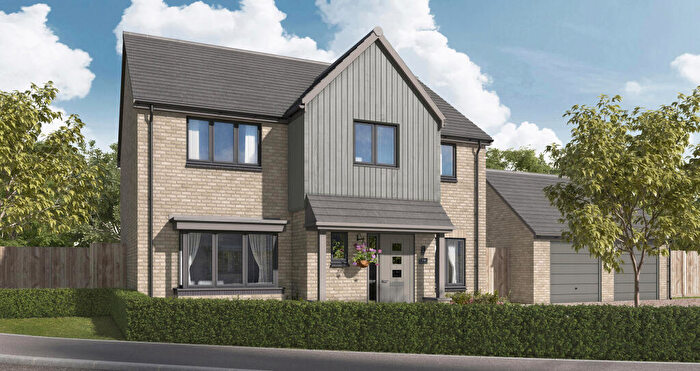
Houses for sale & to rent in Newton And Noss, Plymouth
House Prices in Newton And Noss
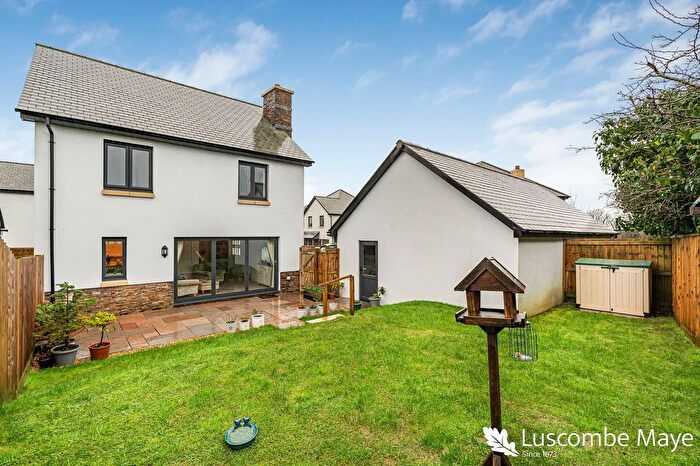
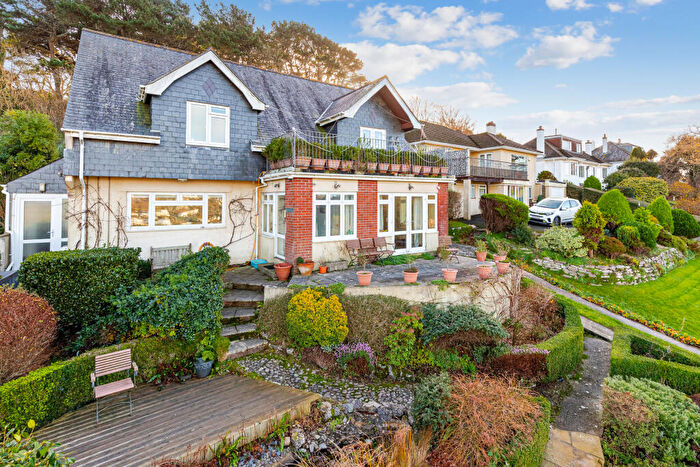
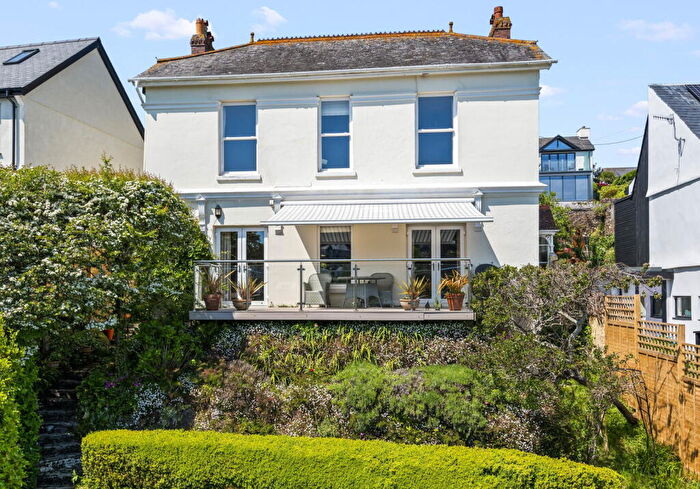
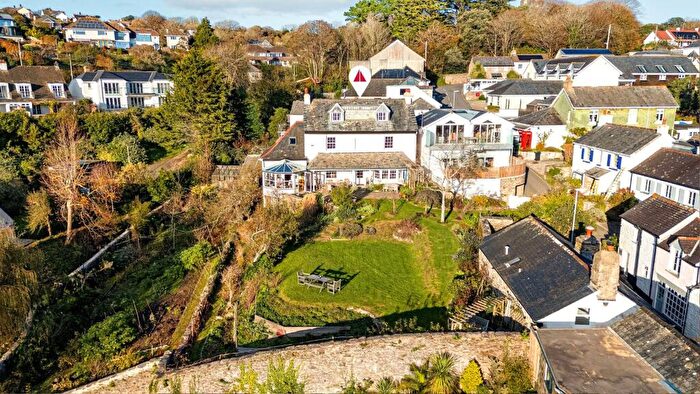
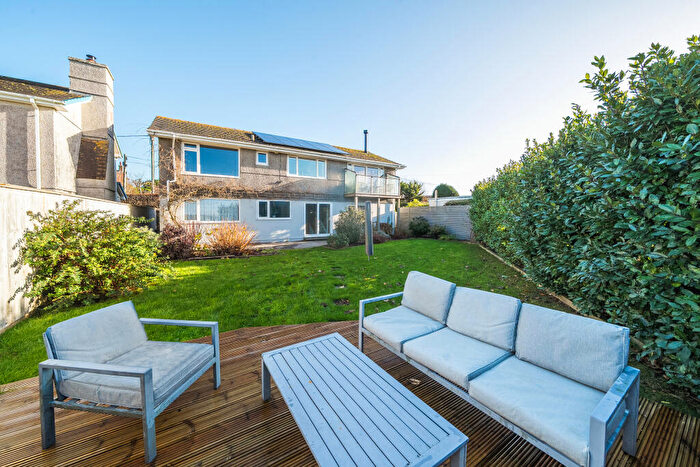
Properties in Newton And Noss have an average house price of £869,696.00 and had 77 Property Transactions within the last 3 years¹.
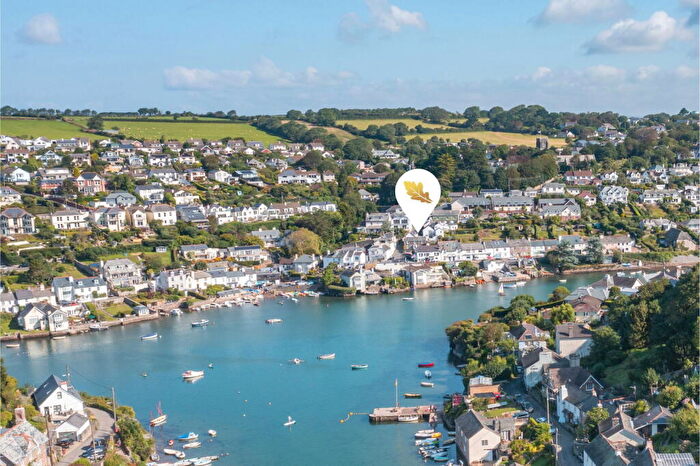
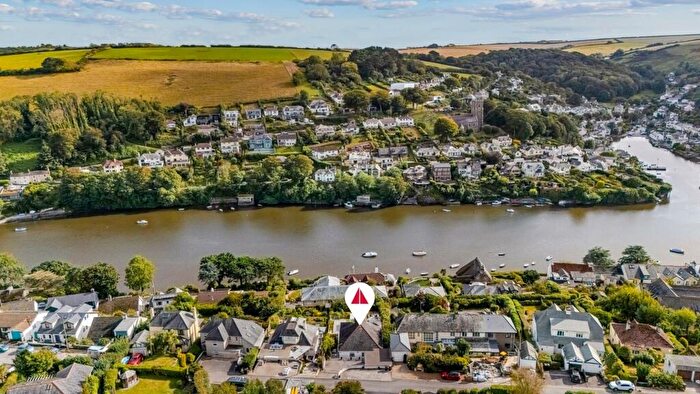
Newton And Noss is an area in Plymouth, Devon with 808 households², where the most expensive property was sold for £1,999,950.00.
Properties for sale in Newton And Noss
Roads and Postcodes in Newton And Noss
Navigate through our locations to find the location of your next house in Newton And Noss, Plymouth for sale or to rent.
| Streets | Postcodes |
|---|---|
| Archers Court | PL8 1BD |
| Barnicott Close | PL8 1BP |
| Beacon Hill | PL8 1DB |
| Bridgend | PL8 1AW PL8 1DX |
| Butts Park | PL8 1HY |
| Chequers Cottages | PL8 1EB |
| Church Park | PL8 1AJ |
| Church Park Road | PL8 1AZ |
| Court Road | PL8 1AR PL8 1BZ PL8 1DA PL8 1DD PL8 1DE PL8 1DH PL8 1DJ PL8 1DL PL8 1DN PL8 1DR |
| Court Wood | PL8 1BW |
| Fell Close | PL8 2NG |
| Gnaton | PL8 2HU |
| Higher Coombe | PL8 1EH |
| Hillside Cottages | PL8 1EQ |
| Livingstone Avenue | PL8 2NH |
| Lower Court Road | PL8 1DG PL8 1DQ |
| Meadow Close | PL8 1BT |
| Membland | PL8 1HP PL8 1HT |
| Middle Leigh | PL8 1DS |
| Munro Avenue | PL8 2NQ |
| Newton Close | PL8 1AL |
| Newton Hill | PL8 1AA PL8 1AB PL8 1BE PL8 1BG PL8 1DT |
| Parsonage Road | PL8 1AS PL8 1AT |
| Perches Close | PL8 1HZ |
| Pillory Hill | PL8 1ED |
| Revelstoke Road | PL8 1EA |
| Richardson Drive | PL8 2NJ |
| Riverside Road East | PL8 1AE PL8 1AG |
| Riverside Road West | PL8 1AD |
| Stoke Road | PL8 1DY PL8 1DZ PL8 1JG |
| The Fairway | PL8 1DP PL8 1DW |
| The Pleasaunce | PL8 1AU |
| Whittingham Road | PL8 2NF |
| Wrescombe Farm Cottages | PL8 2NL |
| Wrights Lane | PL8 1BY |
| Yealm Road | PL8 1AH PL8 1AQ PL8 1BH PL8 1BJ PL8 1BL PL8 1BN PL8 1BQ PL8 1BX |
| Yealm View Road | PL8 1AN |
| PL8 1EE PL8 1EF PL8 1EG PL8 1EJ PL8 1EN PL8 1EU PL8 1EW PL8 1EX PL8 1EY PL8 1HB PL8 1HG PL8 1HS PL8 1HU PL8 2HY PL8 2NN |
Transport near Newton And Noss
-
Plymouth Station
-
Devonport Station
-
Dockyard Station
-
Ivybridge Station
-
Keyham Station
-
St.Budeaux Ferry Road Station
-
St.Budeaux Victoria Road Station
-
Saltash Station
- FAQ
- Price Paid By Year
- Property Type Price
Frequently asked questions about Newton And Noss
What is the average price for a property for sale in Newton And Noss?
The average price for a property for sale in Newton And Noss is £869,696. This amount is 95% higher than the average price in Plymouth. There are 523 property listings for sale in Newton And Noss.
What streets have the most expensive properties for sale in Newton And Noss?
The streets with the most expensive properties for sale in Newton And Noss are Yealm View Road at an average of £1,433,333, Pillory Hill at an average of £1,211,847 and Riverside Road East at an average of £1,202,833.
What streets have the most affordable properties for sale in Newton And Noss?
The streets with the most affordable properties for sale in Newton And Noss are Munro Avenue at an average of £370,000, Newton Hill at an average of £432,500 and The Fairway at an average of £465,000.
Which train stations are available in or near Newton And Noss?
Some of the train stations available in or near Newton And Noss are Plymouth, Devonport and Dockyard.
Property Price Paid in Newton And Noss by Year
The average sold property price by year was:
| Year | Average Sold Price | Price Change |
Sold Properties
|
|---|---|---|---|
| 2025 | £829,562 | 2% |
24 Properties |
| 2024 | £812,940 | -24% |
33 Properties |
| 2023 | £1,011,505 | 18% |
20 Properties |
| 2022 | £833,642 | 15% |
27 Properties |
| 2021 | £712,731 | 2% |
63 Properties |
| 2020 | £697,427 | 8% |
48 Properties |
| 2019 | £642,141 | 9% |
39 Properties |
| 2018 | £584,684 | 9% |
40 Properties |
| 2017 | £534,384 | -11% |
38 Properties |
| 2016 | £593,680 | 20% |
40 Properties |
| 2015 | £474,207 | -9% |
49 Properties |
| 2014 | £516,863 | 16% |
33 Properties |
| 2013 | £434,840 | -12% |
35 Properties |
| 2012 | £484,850 | -5% |
34 Properties |
| 2011 | £511,007 | -23% |
30 Properties |
| 2010 | £630,018 | 26% |
24 Properties |
| 2009 | £464,572 | 5% |
28 Properties |
| 2008 | £442,476 | -7% |
26 Properties |
| 2007 | £475,538 | 15% |
50 Properties |
| 2006 | £401,903 | 13% |
45 Properties |
| 2005 | £349,379 | -1% |
32 Properties |
| 2004 | £353,806 | 8% |
29 Properties |
| 2003 | £325,742 | 6% |
39 Properties |
| 2002 | £305,799 | 25% |
50 Properties |
| 2001 | £228,231 | 18% |
31 Properties |
| 2000 | £187,110 | -11% |
40 Properties |
| 1999 | £207,453 | 21% |
57 Properties |
| 1998 | £163,000 | 10% |
33 Properties |
| 1997 | £146,850 | 0,1% |
44 Properties |
| 1996 | £146,718 | 6% |
38 Properties |
| 1995 | £137,394 | - |
43 Properties |
Property Price per Property Type in Newton And Noss
Here you can find historic sold price data in order to help with your property search.
The average Property Paid Price for specific property types in the last three years are:
| Property Type | Average Sold Price | Sold Properties |
|---|---|---|
| Semi Detached House | £669,571.00 | 7 Semi Detached Houses |
| Detached House | £956,240.00 | 50 Detached Houses |
| Terraced House | £920,633.00 | 12 Terraced Houses |
| Flat | £427,500.00 | 8 Flats |

