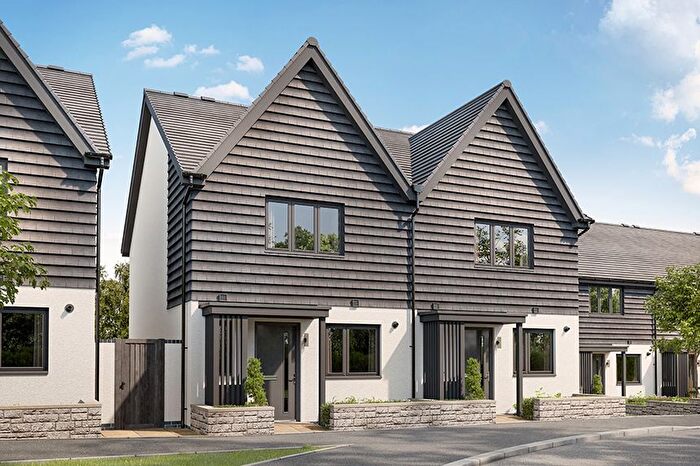
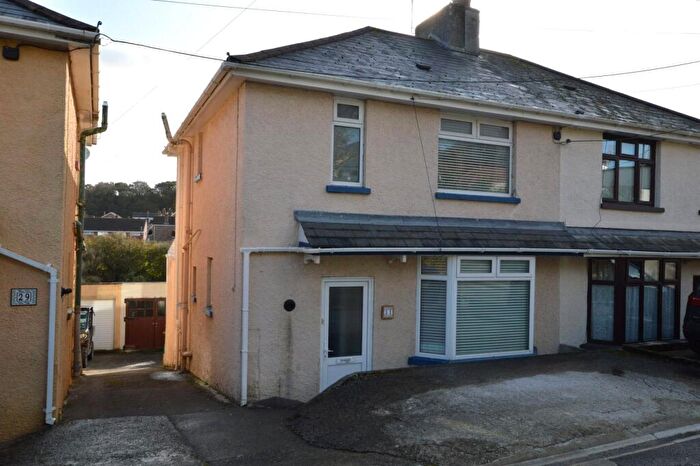
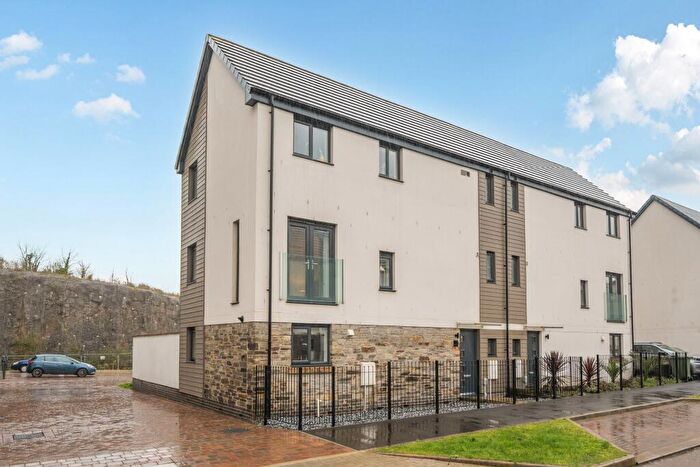
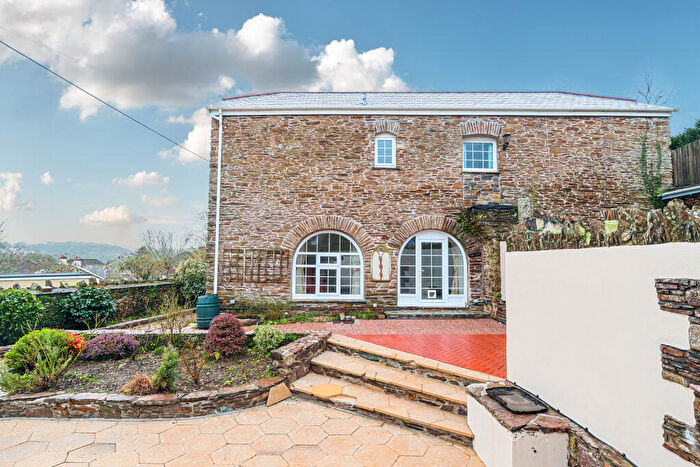
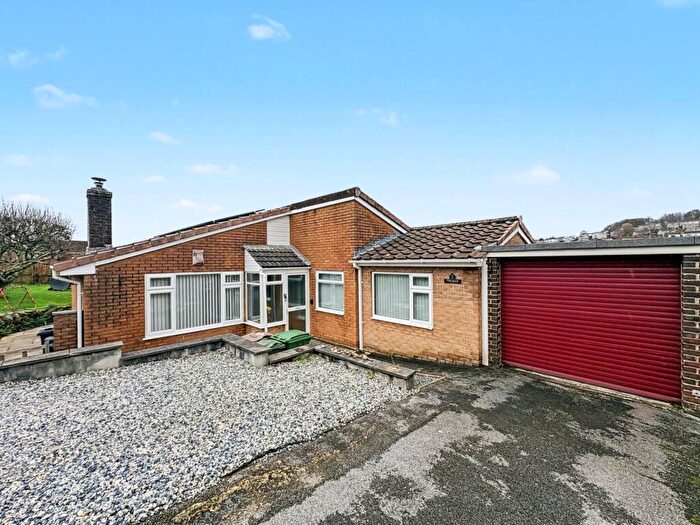
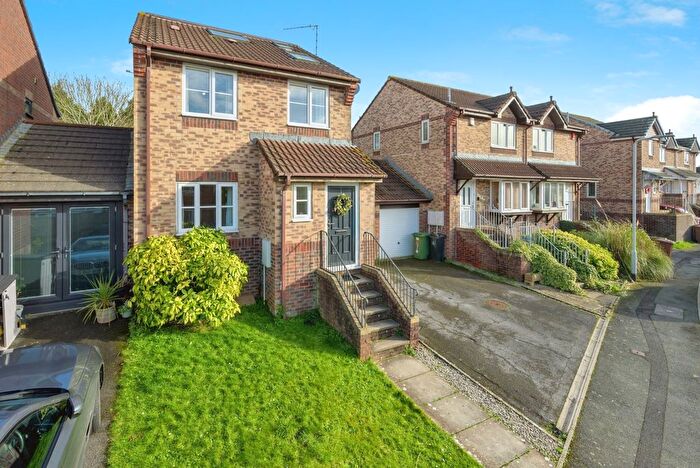
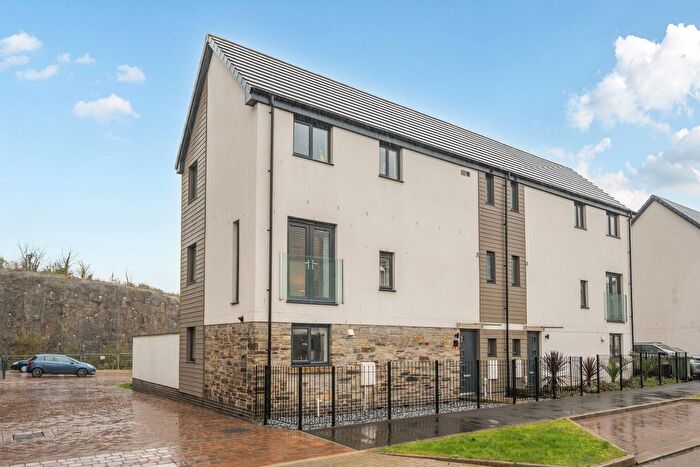
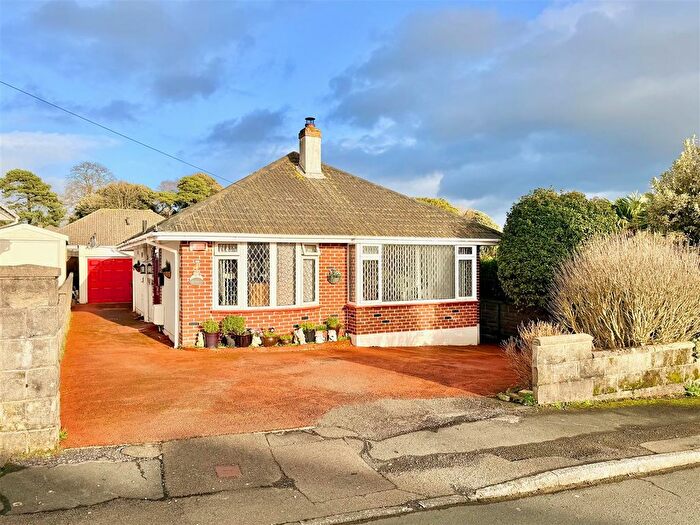
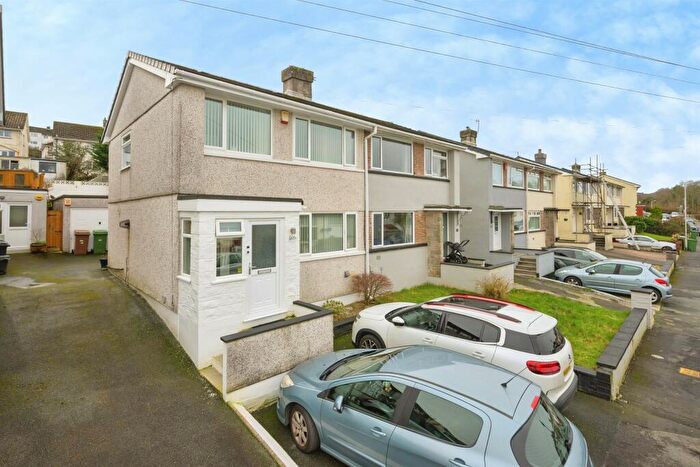
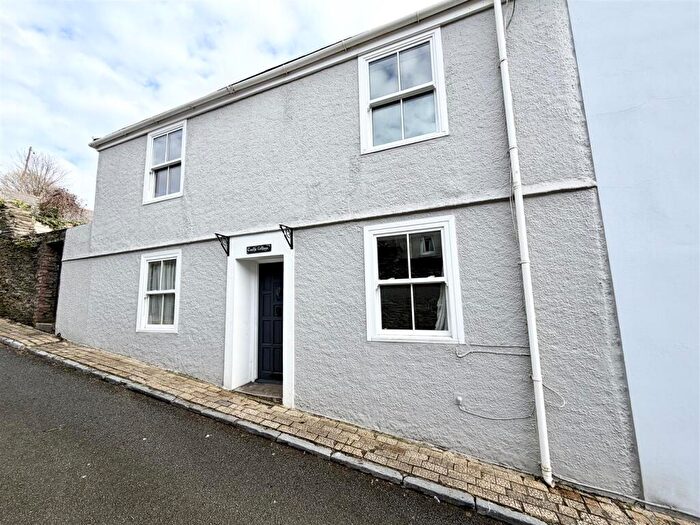
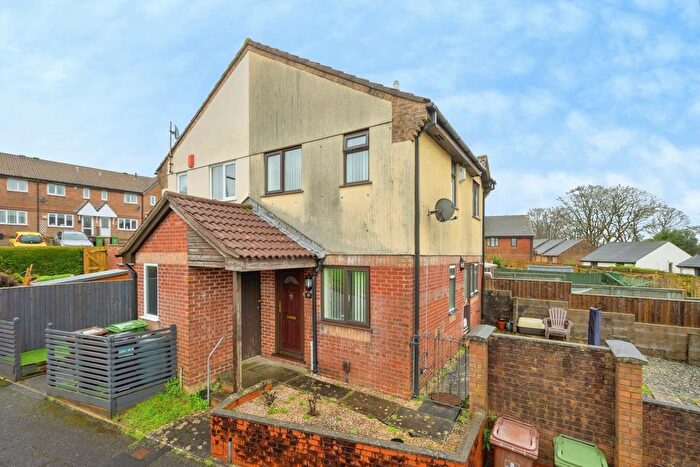
Houses for sale & to rent in Wembury & Brixton, Plymouth
House Prices in Wembury & Brixton
Properties in Wembury & Brixton have an average house price of £527,625.00 and had 20 Property Transactions within the last 3 years¹.
Wembury & Brixton is an area in Plymouth, Devon with 93 households², where the most expensive property was sold for £1,200,000.00.
Properties for sale in Wembury & Brixton
Roads and Postcodes in Wembury & Brixton
Navigate through our locations to find the location of your next house in Wembury & Brixton, Plymouth for sale or to rent.
| Streets | Postcodes |
|---|---|
| Aquila Drive | PL9 8GW |
| Ariel Mews | PL9 8PW |
| Atlas Drive | PL9 8LY |
| Barton Brake | PL9 0BJ |
| Blackpool | PL8 2LF |
| Bluebell Road | PL9 8WG |
| Bramley Close | PL8 2FG |
| Brownhill Lane | PL9 0FF |
| Capella Drive | PL9 8SN |
| Chittleburn Close | PL8 2FL |
| Chittleburn Hill | PL8 2BJ PL8 2BL PL8 2PH |
| Church Road | PL9 0JP |
| Clover Park | PL8 2FQ |
| Clover Walk | PL9 8XG |
| Corvus Mews | PL9 8GU |
| Daisy Park | PL8 2FJ |
| Electra Way | PL9 8GZ |
| Elliotts Hill | PL8 2BW |
| Falcon Mews | PL9 8WP |
| Ford Road | PL9 0JA |
| Fordbrook Lane | PL9 0FD |
| Fox Park | PL9 8WL |
| Goldfinch Park | PL9 8XJ |
| Hareston | PL8 2LD |
| Hercules Road | PL9 8GY |
| Kitley View | PL8 2PD |
| Knighton Hill | PL9 0FE |
| Langdon View | PL9 0FA |
| Lunar Crescent | PL9 8XY |
| Marine Drive West | PL9 0BX |
| Meadow View | PL8 2BB |
| Miranda Court | PL9 8SL |
| Orchard Road | PL8 2FE |
| Orion Drive | PL9 8XA |
| Paddock Drive | PL8 2FS |
| Pandora Grove | PL9 8LZ |
| Perseus Crescent | PL9 8GX |
| Primrose Drive | PL9 8WF |
| Robin Close | PL9 8WR |
| Rosehill | PL9 0BZ |
| Russet Way | PL8 2FR |
| South View | PL8 2AE |
| Southland Park Road | PL9 0HE |
| Sparrow Park | PL9 8XF |
| Steer Point | PL8 2DE |
| Strawberry Lane | PL9 8WJ |
| Sycamore Way | PL9 8WH |
| The Park | PL8 2BU |
| Titan Avenue | PL9 8QR |
| Tulip Lane | PL9 8WN |
| Upland Gardens | PL9 0LH |
| Ursa Gardens | PL9 8GS |
| Volans Lane | PL9 8GT |
| Wagtail Avenue | PL9 8XH |
| Winstone | PL8 2DJ |
| Zenith Way | PL9 8YJ |
| PL8 2AD PL8 2BQ PL8 2DP PL8 2DR PL8 2DW PL9 0AB PL9 0AJ PL9 0DP PL9 0EG PL9 0EH PL9 0FB PL8 2FT PL9 8GE PL7 5AD PL7 5AE PL7 5FA PL7 5FB |
Transport near Wembury & Brixton
-
Plymouth Station
-
Devonport Station
-
Dockyard Station
-
Keyham Station
-
St.Budeaux Ferry Road Station
-
St.Budeaux Victoria Road Station
-
Ivybridge Station
-
Saltash Station
-
Bere Ferrers Station
- FAQ
- Price Paid By Year
- Property Type Price
Frequently asked questions about Wembury & Brixton
What is the average price for a property for sale in Wembury & Brixton?
The average price for a property for sale in Wembury & Brixton is £527,625. This amount is 18% higher than the average price in Plymouth. There are 8,497 property listings for sale in Wembury & Brixton.
What streets have the most expensive properties for sale in Wembury & Brixton?
The streets with the most expensive properties for sale in Wembury & Brixton are Chittleburn Close at an average of £1,125,000, Hareston at an average of £655,000 and Orchard Road at an average of £545,625.
What streets have the most affordable properties for sale in Wembury & Brixton?
The streets with the most affordable properties for sale in Wembury & Brixton are Bramley Close at an average of £282,500, Daisy Park at an average of £379,166 and Barton Brake at an average of £450,000.
Which train stations are available in or near Wembury & Brixton?
Some of the train stations available in or near Wembury & Brixton are Plymouth, Devonport and Dockyard.
Property Price Paid in Wembury & Brixton by Year
The average sold property price by year was:
| Year | Average Sold Price | Price Change |
Sold Properties
|
|---|---|---|---|
| 2025 | £551,818 | 18% |
11 Properties |
| 2024 | £455,000 | -17% |
4 Properties |
| 2023 | £532,500 | 18% |
5 Properties |
| 2022 | £435,000 | -11% |
5 Properties |
| 2021 | £484,705 | -4% |
17 Properties |
| 2020 | £505,076 | 24% |
13 Properties |
| 2019 | £385,492 | 1% |
7 Properties |
| 2018 | £382,451 | -19% |
25 Properties |
| 2017 | £455,415 | 34% |
8 Properties |
| 2016 | £299,000 | -12% |
2 Properties |
| 2015 | £335,158 | -9% |
44 Properties |
| 2014 | £363,750 | -20% |
4 Properties |
| 2009 | £435,000 | - |
1 Property |
Property Price per Property Type in Wembury & Brixton
Here you can find historic sold price data in order to help with your property search.
The average Property Paid Price for specific property types in the last three years are:
| Property Type | Average Sold Price | Sold Properties |
|---|---|---|
| Semi Detached House | £294,166.00 | 3 Semi Detached Houses |
| Detached House | £648,500.00 | 10 Detached Houses |
| Terraced House | £579,000.00 | 5 Terraced Houses |
| Flat | £145,000.00 | 2 Flats |

