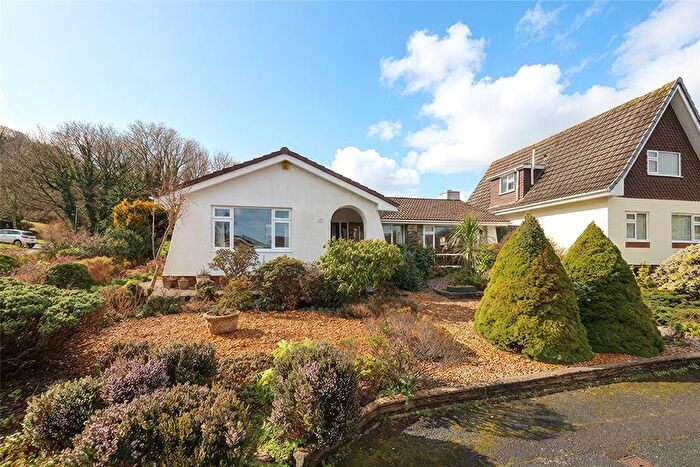
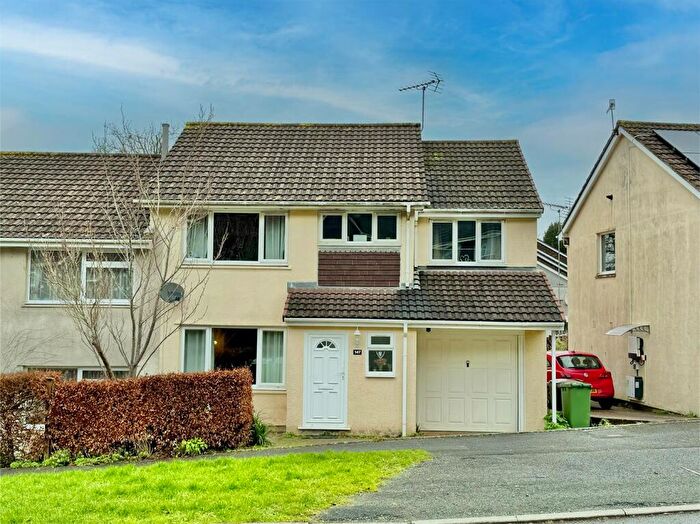
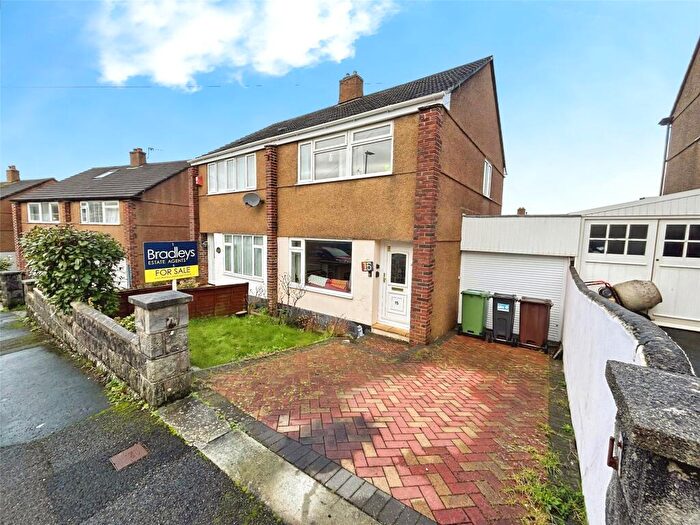
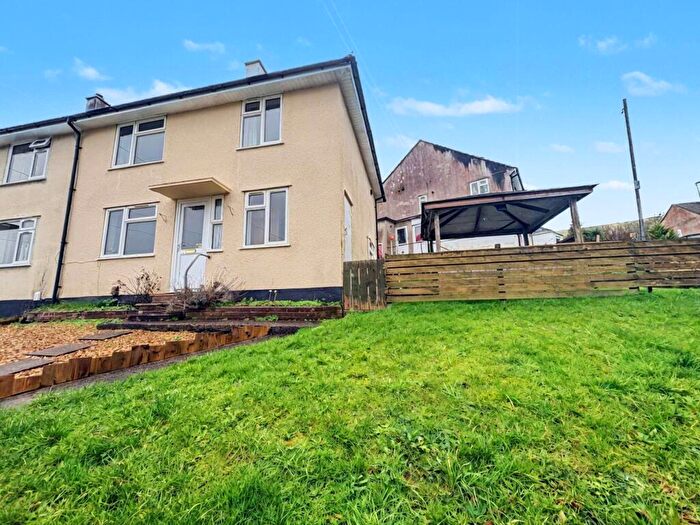
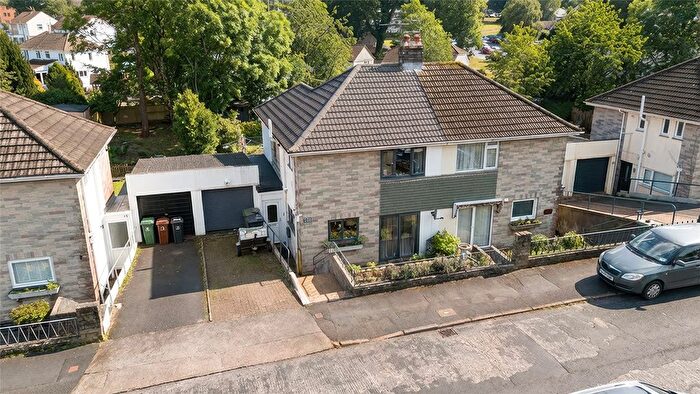
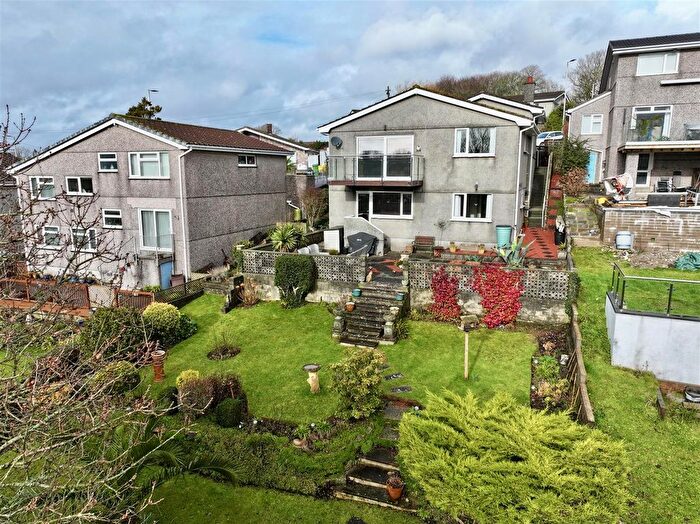
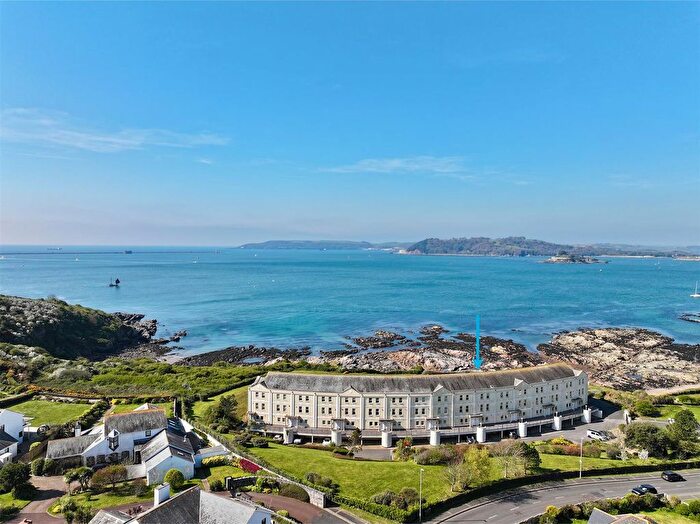
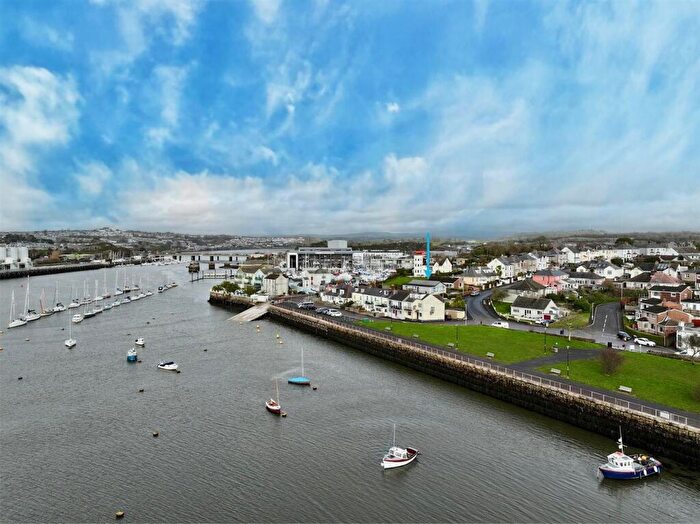
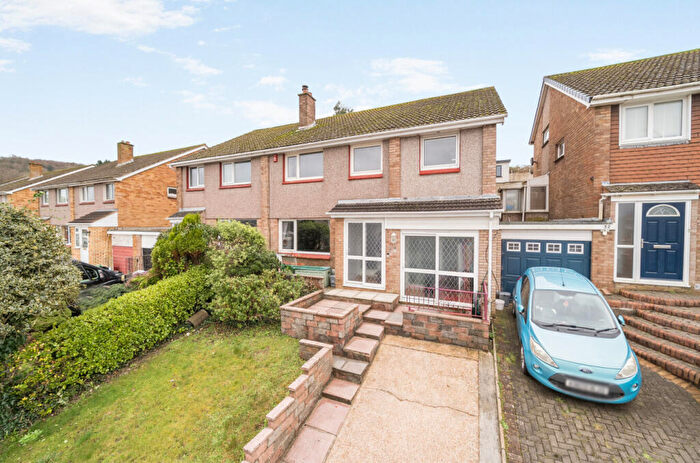
Houses for sale & to rent in Wembury And Brixton, Plymouth
House Prices in Wembury And Brixton
Properties in Wembury And Brixton have an average house price of £446,460.00 and had 197 Property Transactions within the last 3 years¹.
Wembury And Brixton is an area in Plymouth, Devon with 1,923 households², where the most expensive property was sold for £1,600,000.00.
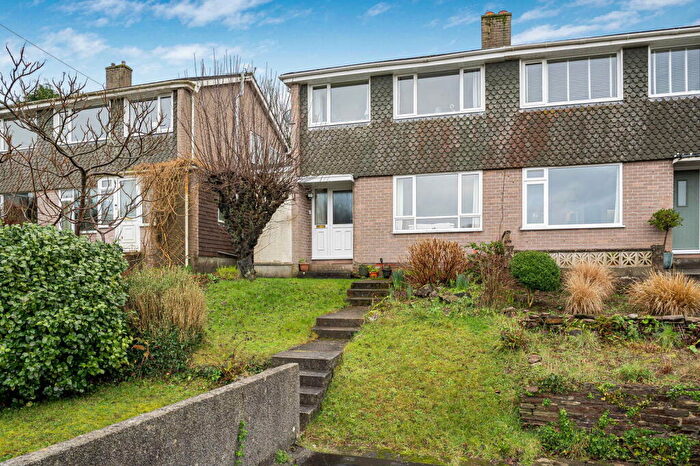
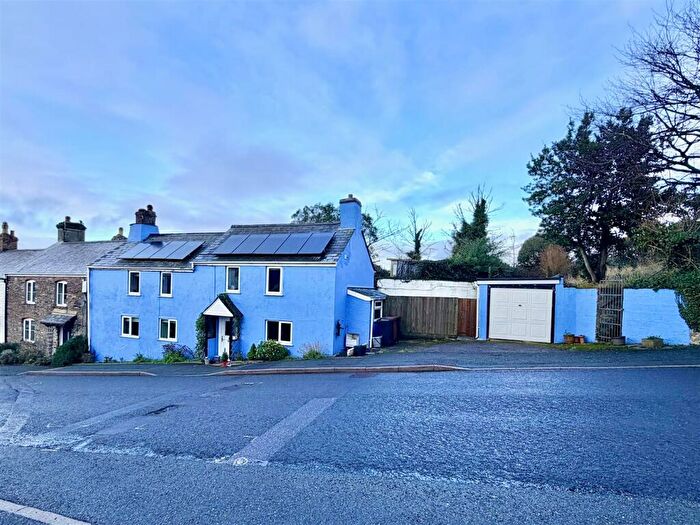
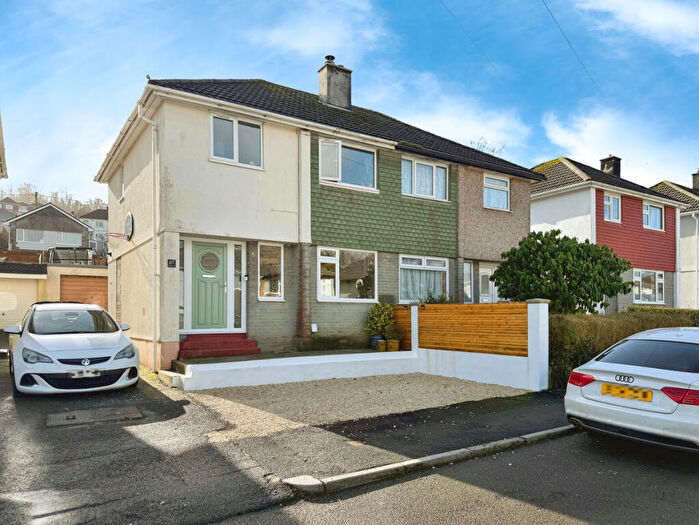
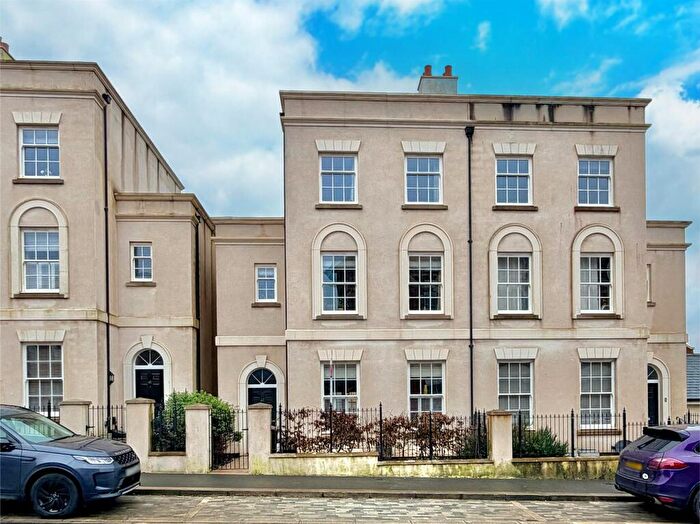
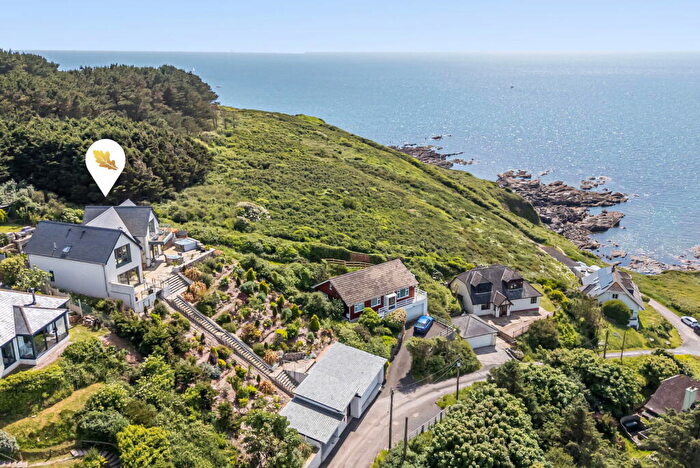
Properties for sale in Wembury And Brixton
Roads and Postcodes in Wembury And Brixton
Navigate through our locations to find the location of your next house in Wembury And Brixton, Plymouth for sale or to rent.
| Streets | Postcodes |
|---|---|
| Andurn Estate | PL9 0AT |
| Barton Close | PL9 0LF |
| Barton Cottages | PL9 0AH |
| Beach Road | PL9 0BS |
| Beach View Crescent | PL9 0HJ PL9 0HL |
| Beech Cottages | PL9 9ND |
| Bovisand Court | PL9 0AD |
| Bovisand Park Estate | PL9 0AE |
| Briticheston Close | PL9 9FF |
| Brookside Close | PL9 0BY |
| Brownhill Lane | PL9 0JH PL9 0JQ |
| Canes Cottages | PL8 2AQ |
| Carrolls Way | PL9 9FJ |
| Chad Road | PL9 0DT |
| Cherry Tree Drive | PL8 2DD |
| Chittleburn Hill | PL8 2BH |
| Church Cottages | PL8 2AW |
| Church Road | PL9 0HP PL9 0HR PL9 0JE PL9 0JF PL9 0JG PL9 0JJ PL9 0JL PL9 0JW PL9 0JX PL9 0LA PL9 0LB PL9 0LD |
| Cliff Road | PL9 0HN PL9 0HW |
| Colliers Close | PL9 0JN |
| Combe | PL8 2AZ |
| Cory Court | PL9 0ER |
| Court View | PL8 2NY |
| Cross Park | PL8 2BY |
| Cross Park Road | PL9 0EU |
| Crossways | PL9 0EY |
| Eddystone Close | PL9 0BP |
| Eddystone Road | PL9 0AR |
| Elbridge Cottages | PL8 2AJ |
| Ford Road | PL9 0JB |
| Fordbrook Lane | PL8 2FD |
| Furzehill Road | PL9 0BT |
| Gabber Lane | PL9 0AW |
| Greenhill Road | PL9 9FD |
| Hareston Cottages | PL8 2LE |
| Hawthorn Drive | PL9 0BE |
| Hawthorn Park Road | PL9 0DA PL9 0DB |
| Heybrook Bay | PL9 0BU |
| Heybrook Drive | PL9 0BN PL9 0BW |
| Highfield Drive | PL9 0EX |
| Hill Cottages | PL8 2BE |
| Hillcrest Close | PL9 0HA |
| Hilltop Cottages | PL8 2AY |
| Hole Hay Cottages | PL8 2BA |
| Hollacombe Brake | PL9 0DJ |
| Holmbush Way | PL8 2DU |
| Horn Lane | PL8 2AB |
| Knighton Road | PL9 0EA PL9 0EB PL9 0JD |
| Laburnum Drive | PL9 0LQ |
| Lentney Close | PL9 0DU |
| Leyford Close | PL9 0HX |
| Leyford Lane | PL9 0DG |
| Lodge Lane | PL8 2AU |
| Longlands Drive | PL9 0BL |
| Manor Bourne | PL9 0AS |
| Manor Cottages | PL8 2AA |
| Meadow Drive | PL8 2NZ |
| Mewstone Avenue | PL9 0HT PL9 0HU PL9 0HY PL9 0JT PL9 0JU PL9 0JY PL9 0JZ PL9 0LE |
| Old Coastguard Cottages | PL9 0EJ |
| Old Road | PL8 2BS |
| Parks Drive | PL9 9FG |
| Pear Tree Cottages | PL8 2PA |
| Polston Park | PL9 0DD |
| Popplestone Park | PL8 2DS |
| Priest Cottages | PL8 2AN |
| Railway View | PL8 2BG |
| Red Lion Hill | PL8 2BT PL8 2BX |
| Renney Road | PL9 0AL PL9 0AN PL9 0BD PL9 0BG PL9 0BH PL9 0BQ |
| Ryeland Close | PL9 0HZ |
| Sea View Drive | PL9 0JR PL9 0JS |
| Silver Stream Way | PL8 2PE |
| Southland Park Crescent | PL9 0HB PL9 0HD |
| Southland Park Road | PL9 0HF PL9 0HG PL9 0HH PL9 0HQ |
| Spring Road | PL9 0AU PL9 0AX PL9 0AY |
| St Werburgh Close | PL9 0AP |
| Staddiscombe Road | PL9 9FE |
| Stamps Hill | PL8 2DB |
| Steer Point | PL8 2DQ |
| Steer Point Road | PL8 2BN |
| Tapps Lane | PL8 2BZ |
| The Crescent | PL8 2AP |
| Thorn | PL9 0EQ |
| Torr | PL8 2BD |
| Train Road | PL9 0EN PL9 0EW |
| Valley Drive | PL9 0EZ |
| Veales Cottages | PL8 2AF |
| Veasy Park | PL9 0EP PL9 0ES |
| Venn Drive | PL8 2BP |
| Warren Close | PL9 0AF |
| Watergate Cottages | PL9 0EL |
| Wembury Meadow | PL9 0LG |
| Wembury Road | PL9 0DE PL9 0DF PL9 0DH PL9 0DL PL9 0DN PL9 0DQ |
| West Hill | PL9 0BA PL9 0BB |
| Westlake Rise | PL9 0DS |
| Winstone Cottages | PL8 2DH |
| Woodland Drive | PL8 2PB |
| Yarda Walk | PL8 2DX |
| PL8 2AG PL8 2AH PL8 2AL PL8 2AT PL8 2AX PL8 2DF PL8 2DL PL8 2DN PL9 0AA PL9 0AQ PL9 0DR PL9 0DW PL9 0DY PL9 0DZ PL9 0EE PL9 0EF PL7 5AA PL7 5AB |
Transport near Wembury And Brixton
-
Plymouth Station
-
Devonport Station
-
Dockyard Station
-
Keyham Station
-
St.Budeaux Ferry Road Station
-
St.Budeaux Victoria Road Station
-
Saltash Station
-
Ivybridge Station
-
Bere Ferrers Station
- FAQ
- Price Paid By Year
- Property Type Price
Frequently asked questions about Wembury And Brixton
What is the average price for a property for sale in Wembury And Brixton?
The average price for a property for sale in Wembury And Brixton is £446,460. This amount is 0.22% higher than the average price in Plymouth. There are 9,232 property listings for sale in Wembury And Brixton.
What streets have the most expensive properties for sale in Wembury And Brixton?
The streets with the most expensive properties for sale in Wembury And Brixton are Manor Bourne at an average of £990,000, Spring Road at an average of £883,333 and Renney Road at an average of £728,811.
What streets have the most affordable properties for sale in Wembury And Brixton?
The streets with the most affordable properties for sale in Wembury And Brixton are Carrolls Way at an average of £152,625, Canes Cottages at an average of £185,000 and Bovisand Park Estate at an average of £197,730.
Which train stations are available in or near Wembury And Brixton?
Some of the train stations available in or near Wembury And Brixton are Plymouth, Devonport and Dockyard.
Property Price Paid in Wembury And Brixton by Year
The average sold property price by year was:
| Year | Average Sold Price | Price Change |
Sold Properties
|
|---|---|---|---|
| 2025 | £463,740 | 9% |
51 Properties |
| 2024 | £420,457 | -9% |
73 Properties |
| 2023 | £460,391 | 20% |
73 Properties |
| 2022 | £369,075 | -2% |
53 Properties |
| 2021 | £377,692 | 4% |
81 Properties |
| 2020 | £361,553 | 8% |
64 Properties |
| 2019 | £331,437 | 1% |
73 Properties |
| 2018 | £327,112 | 10% |
73 Properties |
| 2017 | £292,952 | 5% |
107 Properties |
| 2016 | £278,429 | 1% |
79 Properties |
| 2015 | £276,776 | -2% |
91 Properties |
| 2014 | £282,716 | 12% |
75 Properties |
| 2013 | £247,466 | -8% |
69 Properties |
| 2012 | £267,572 | 11% |
59 Properties |
| 2011 | £238,868 | -10% |
45 Properties |
| 2010 | £263,145 | 19% |
63 Properties |
| 2009 | £214,081 | -8% |
124 Properties |
| 2008 | £232,198 | -18% |
91 Properties |
| 2007 | £274,775 | 4% |
79 Properties |
| 2006 | £264,332 | 9% |
70 Properties |
| 2005 | £241,028 | -10% |
72 Properties |
| 2004 | £264,712 | 20% |
64 Properties |
| 2003 | £211,022 | 12% |
95 Properties |
| 2002 | £186,751 | 27% |
75 Properties |
| 2001 | £136,780 | 10% |
78 Properties |
| 2000 | £123,482 | 23% |
102 Properties |
| 1999 | £94,898 | 1% |
84 Properties |
| 1998 | £94,399 | -3% |
82 Properties |
| 1997 | £96,963 | 11% |
74 Properties |
| 1996 | £85,915 | 16% |
59 Properties |
| 1995 | £72,193 | - |
91 Properties |
Property Price per Property Type in Wembury And Brixton
Here you can find historic sold price data in order to help with your property search.
The average Property Paid Price for specific property types in the last three years are:
| Property Type | Average Sold Price | Sold Properties |
|---|---|---|
| Flat | £156,400.00 | 7 Flats |
| Semi Detached House | £337,594.00 | 37 Semi Detached Houses |
| Detached House | £547,921.00 | 119 Detached Houses |
| Terraced House | £269,538.00 | 34 Terraced Houses |

