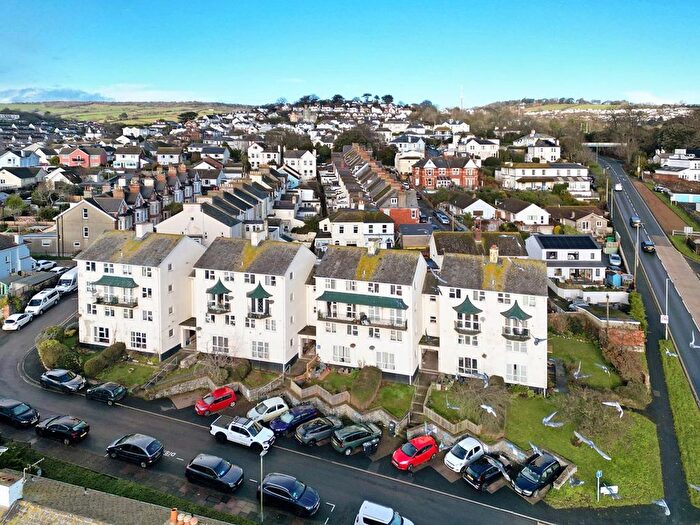
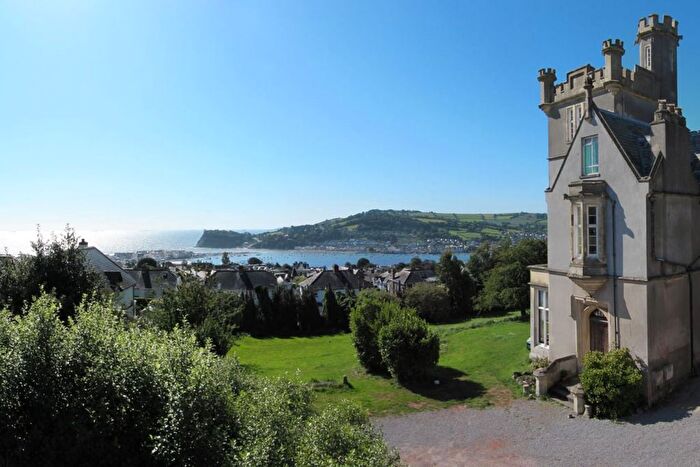
Houses for sale & to rent in Shaldon And Stokeinteignhead, Teignmouth
House Prices in Shaldon And Stokeinteignhead
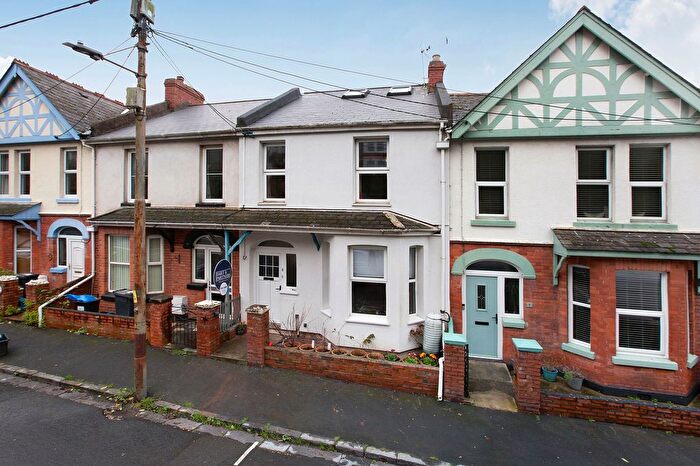
Properties in Shaldon And Stokeinteignhead have an average house price of £503,764.00 and had 95 Property Transactions within the last 3 years¹.
Shaldon And Stokeinteignhead is an area in Teignmouth, Devon with 835 households², where the most expensive property was sold for £1,215,000.00.
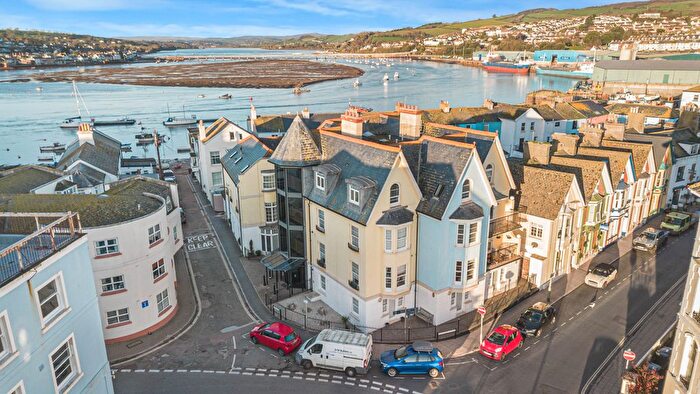
Properties for sale in Shaldon And Stokeinteignhead
Previously listed properties in Shaldon And Stokeinteignhead
Roads and Postcodes in Shaldon And Stokeinteignhead
Navigate through our locations to find the location of your next house in Shaldon And Stokeinteignhead, Teignmouth for sale or to rent.
| Streets | Postcodes |
|---|---|
| Albion Street | TQ14 0DF TQ14 0DH |
| Arch Street | TQ14 0DX |
| Bridge Road | TQ14 0BN TQ14 0DD |
| Broadlands | TQ14 0EH |
| Brook Lane | TQ14 0AJ TQ14 0HL |
| Clifford Close | TQ14 0AD |
| Commons Lane | TQ14 0HN |
| Commons Old Road | TQ14 0EF |
| Coombe Road | TQ14 0EX |
| Coronation Street | TQ14 0DQ |
| Crown Square | TQ14 0DS TQ14 0DT |
| Dagmar Street | TQ14 0DU TQ14 0EB |
| Dunmore Drive | TQ14 0BJ TQ14 0BS |
| Fore Street | TQ14 0DE TQ14 0DZ TQ14 0EA |
| Ham Lane | TQ14 0HW |
| Higher Ringmore Road | TQ14 0EZ TQ14 0HG TQ14 0HQ |
| Horse Lane | TQ14 0BH TQ14 0BW |
| Lamberts Lane | TQ14 0HJ |
| Larks Close | TQ14 0PA |
| Laurel Lane | TQ14 0AL |
| Long Lane | TQ14 0HB |
| Marine Parade | TQ14 0DP |
| Mariners Court | TQ14 0GA |
| Middle Street | TQ14 0DR |
| Mount Pleasant Lane | TQ14 0EG |
| Ness Drive | TQ14 0HP |
| North View | TQ14 0EE |
| Oak Tree Grove | TQ14 0BU |
| Orchard Close | TQ14 0HF |
| Palk Close | TQ14 0AH |
| Penrhyn Place | TQ14 0DY |
| Peppery Lane | TQ14 0AW |
| Platway Lane | TQ14 0AR |
| Pound Lane | TQ14 0HA |
| Ringmore Close | TQ14 0AS |
| Ringmore Road | TQ14 0AA TQ14 0AB TQ14 0AG TQ14 0EP TQ14 0ET |
| Riverside | TQ14 0DA TQ14 0DJ |
| Rose Cottages | TQ14 0EU |
| Salty Lane | TQ14 0AP |
| Shoreside | TQ14 0BP |
| Short Lane | TQ14 0HE |
| Strand | TQ14 0DL |
| The Green | TQ14 0DN TQ14 0DW |
| The Hamiltons | TQ14 0AY |
| The Homeyards | TQ14 0EQ |
| The Saltings | TQ14 0BT |
| The Strand | TQ14 0ES |
| Topcliff Road | TQ14 0AT |
| Torquay | TQ14 0BD |
| Torquay Road | TQ14 0AE TQ14 0AX TQ14 0AZ TQ14 0BB TQ14 0BG TQ14 0BQ |
| Tothill Court | TQ14 0EJ |
| Verbena Terrace | TQ14 0AQ |
| Victoria Terrace | TQ14 0DB |
| Waverley Terrace | TQ14 0ED |
| Woodleigh Park | TQ14 0BE |
Transport near Shaldon And Stokeinteignhead
- FAQ
- Price Paid By Year
- Property Type Price
Frequently asked questions about Shaldon And Stokeinteignhead
What is the average price for a property for sale in Shaldon And Stokeinteignhead?
The average price for a property for sale in Shaldon And Stokeinteignhead is £503,764. This amount is 44% higher than the average price in Teignmouth. There are 627 property listings for sale in Shaldon And Stokeinteignhead.
What streets have the most expensive properties for sale in Shaldon And Stokeinteignhead?
The streets with the most expensive properties for sale in Shaldon And Stokeinteignhead are Salty Lane at an average of £1,097,500, Penrhyn Place at an average of £920,000 and Pound Lane at an average of £875,000.
What streets have the most affordable properties for sale in Shaldon And Stokeinteignhead?
The streets with the most affordable properties for sale in Shaldon And Stokeinteignhead are Crown Square at an average of £237,500, Rose Cottages at an average of £280,000 and Fore Street at an average of £285,000.
Which train stations are available in or near Shaldon And Stokeinteignhead?
Some of the train stations available in or near Shaldon And Stokeinteignhead are Teignmouth, Dawlish and Newton Abbot.
Property Price Paid in Shaldon And Stokeinteignhead by Year
The average sold property price by year was:
| Year | Average Sold Price | Price Change |
Sold Properties
|
|---|---|---|---|
| 2025 | £480,920 | -9% |
24 Properties |
| 2024 | £522,336 | 6% |
46 Properties |
| 2023 | £491,520 | -24% |
25 Properties |
| 2022 | £611,918 | 12% |
38 Properties |
| 2021 | £536,192 | -5% |
61 Properties |
| 2020 | £562,123 | 27% |
44 Properties |
| 2019 | £408,751 | 1% |
51 Properties |
| 2018 | £406,269 | -13% |
46 Properties |
| 2017 | £457,178 | 30% |
47 Properties |
| 2016 | £321,355 | -15% |
40 Properties |
| 2015 | £368,322 | -5% |
61 Properties |
| 2014 | £386,909 | 11% |
49 Properties |
| 2013 | £345,612 | -14% |
66 Properties |
| 2012 | £393,640 | 22% |
52 Properties |
| 2011 | £308,613 | -21% |
41 Properties |
| 2010 | £373,581 | 24% |
52 Properties |
| 2009 | £284,821 | -10% |
48 Properties |
| 2008 | £312,606 | -7% |
39 Properties |
| 2007 | £335,112 | 15% |
66 Properties |
| 2006 | £283,581 | 7% |
69 Properties |
| 2005 | £264,715 | -7% |
60 Properties |
| 2004 | £283,216 | 18% |
76 Properties |
| 2003 | £233,299 | 10% |
67 Properties |
| 2002 | £210,401 | 17% |
70 Properties |
| 2001 | £174,100 | 12% |
62 Properties |
| 2000 | £153,676 | 15% |
63 Properties |
| 1999 | £131,042 | 23% |
88 Properties |
| 1998 | £100,963 | -4% |
65 Properties |
| 1997 | £105,284 | 25% |
75 Properties |
| 1996 | £78,572 | 2% |
54 Properties |
| 1995 | £77,300 | - |
56 Properties |
Property Price per Property Type in Shaldon And Stokeinteignhead
Here you can find historic sold price data in order to help with your property search.
The average Property Paid Price for specific property types in the last three years are:
| Property Type | Average Sold Price | Sold Properties |
|---|---|---|
| Semi Detached House | £343,666.00 | 9 Semi Detached Houses |
| Detached House | £672,210.00 | 38 Detached Houses |
| Terraced House | £456,054.00 | 29 Terraced Houses |
| Flat | £315,526.00 | 19 Flats |

