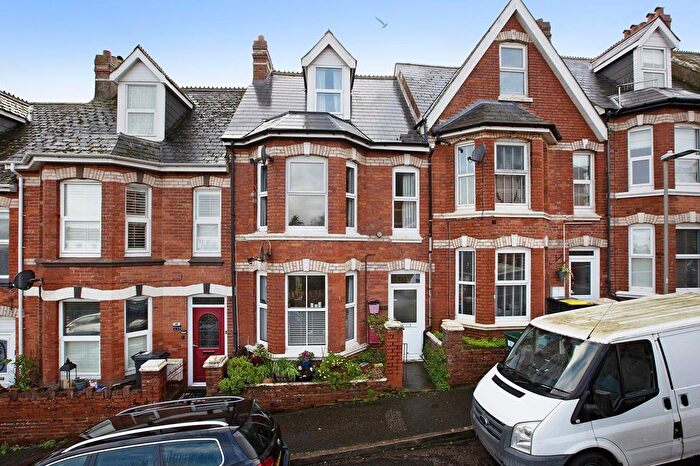
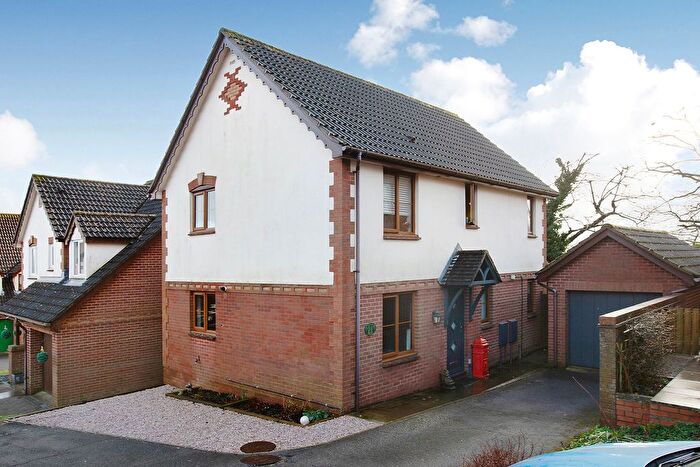
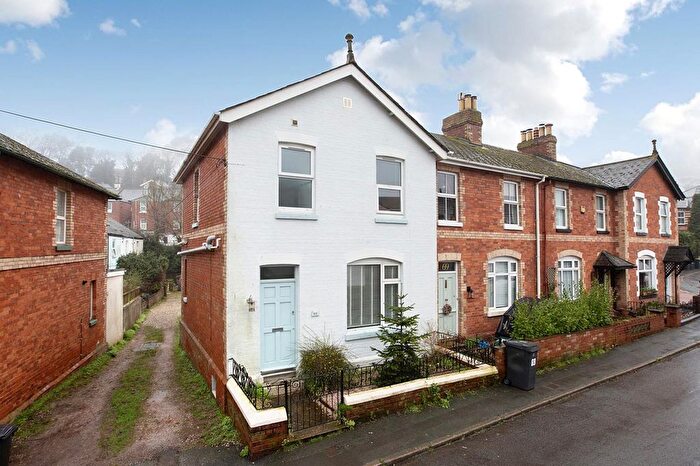
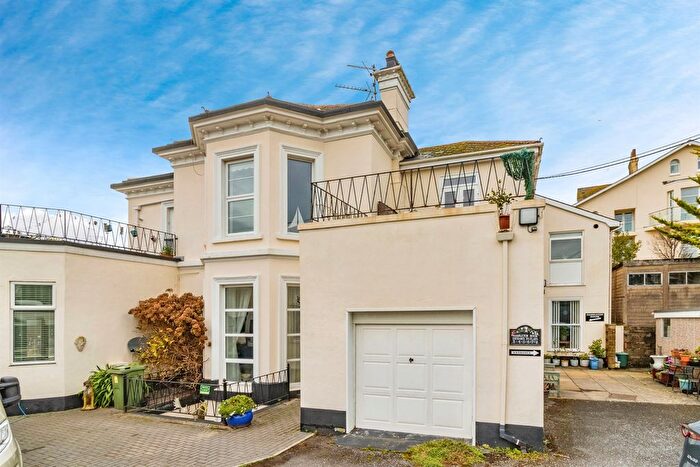
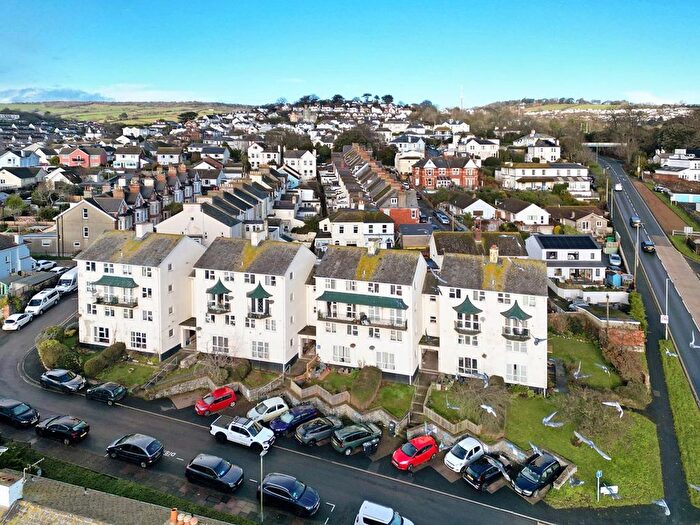
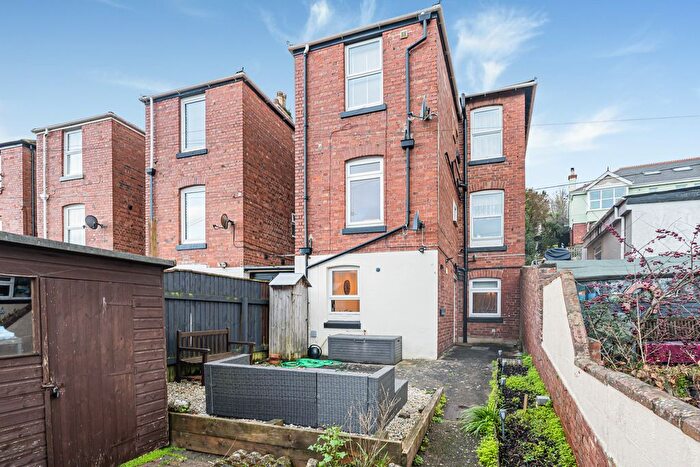
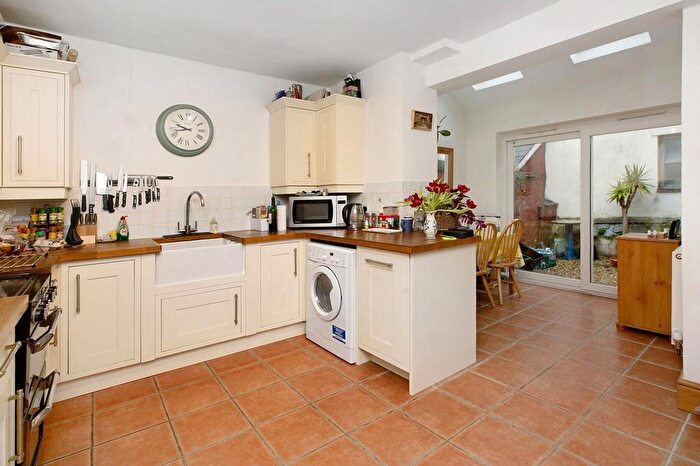
Houses for sale & to rent in Teignmouth East, Teignmouth
House Prices in Teignmouth East
Properties in Teignmouth East have an average house price of £298,313.00 and had 308 Property Transactions within the last 3 years¹.
Teignmouth East is an area in Teignmouth, Devon with 2,379 households², where the most expensive property was sold for £1,045,000.00.
Properties for sale in Teignmouth East
Previously listed properties in Teignmouth East
Roads and Postcodes in Teignmouth East
Navigate through our locations to find the location of your next house in Teignmouth East, Teignmouth for sale or to rent.
| Streets | Postcodes |
|---|---|
| Abbey Close | TQ14 8FB |
| Alandale Close | TQ14 8NY |
| Alandale Road | TQ14 8NW |
| Alberta Court | TQ14 8TD |
| Alwyns Close | TQ14 8PL |
| Amethyst Drive | TQ14 8GD |
| Bank Street | TQ14 8AL TQ14 8FN |
| Barham Avenue | TQ14 8GG |
| Barnpark Close | TQ14 8PR |
| Barnpark Road | TQ14 8PJ TQ14 8PN |
| Barnpark Terrace | TQ14 8PS |
| Barnsley Close | TQ14 8PW |
| Barnsley Drive | TQ14 8PP |
| Bath Terrace | TQ14 8AD |
| Bay View Drive | TQ14 8NN |
| Benedict Close | TQ14 8FD |
| Bickford Lane | TQ14 8HT |
| Boyds Drive | TQ14 8PU |
| Brook Street | TQ14 8NS |
| Brookfield Drive | TQ14 8QQ |
| Brunel Close | TQ14 8QL |
| Brunswick Street | TQ14 8AE TQ14 8AF TQ14 8AG |
| Buckeridge Road | TQ14 8NG TQ14 8NU |
| Carlton Place | TQ14 8AB TQ14 8FQ |
| Chantry Close | TQ14 8FE |
| Charlemont Road | TQ14 8RP |
| Chilton Avenue | TQ14 8NP |
| Churchill Drive | TQ14 8QD |
| Clampet Lane | TQ14 8DN TQ14 8GB TQ14 8GH |
| Cliff Walk | TQ14 8TP TQ14 8TR |
| Cliffden Close | TQ14 8TU |
| Courtenay Place | TQ14 8AY |
| Dawlish Road | TQ14 8TE TQ14 8TG TQ14 8TH TQ14 8TQ TQ14 8FT TQ14 8HX TQ14 8TY |
| Dawlish Street | TQ14 8TB |
| Den Crescent | TQ14 8BG TQ14 8BQ TQ14 8BR |
| Den Promenade | TQ14 8SY TQ14 8SZ |
| Den Road | TQ14 8AA TQ14 8AJ TQ14 8AP TQ14 8AR TQ14 8DF |
| Eastcliff Walk | TQ14 8SH |
| Elizabethan Way | TQ14 8GE |
| First Drive | TQ14 8FR TQ14 8TJ TQ14 8TX TQ14 8US |
| Fore Street | TQ14 8DZ TQ14 8HE |
| Foresters Terrace | TQ14 8BP |
| French Street | TQ14 8ST |
| George Street | TQ14 8AH TQ14 8FU |
| Glendaragh Road | TQ14 8PH |
| Gorway | TQ14 8PX |
| Grove Court | TQ14 8QF |
| Haldon Avenue | TQ14 8JZ TQ14 8LA |
| Hazel Close | TQ14 8RN |
| Higher Brook Street | TQ14 8HY |
| Higher Holcombe Close | TQ14 8RE |
| Higher Holcombe Drive | TQ14 8RF |
| Higher Holcombe Road | TQ14 8RD TQ14 8RJ TQ14 9NP |
| Higher Woodway Close | TQ14 8XQ |
| Higher Woodway Road | TQ14 8RB TQ14 8RG TQ14 8RH TQ14 8WE TQ14 9NR |
| Highgrove Park | TQ14 8FA |
| Holcombe Down Road | TQ14 9NT TQ14 9NS |
| Hollands Road | TQ14 8SR |
| Ivy Lane | TQ14 8BA TQ14 8BT |
| Jubilee Close | TQ14 8GF |
| Kimberley Cottages | TQ14 8HU |
| Little Triangle | TQ14 8FP TQ14 8AX |
| Livingstone Road | TQ14 8NL |
| Lower Brimley Road | TQ14 8LW |
| Lower Brook Street | TQ14 8HR |
| Lyme Bay Road | TQ14 8RS |
| Marine Terrace | TQ14 8BS |
| Maudlin Drive | TQ14 8RZ |
| Mere Lane | TQ14 8TA |
| Merivale Close | TQ14 8QH |
| Moor Close | TQ14 8UG |
| Mulberry Street | TQ14 8EJ |
| Myrtle Hill | TQ14 8PQ |
| Ness View Road | TQ14 8RQ |
| New Quay Street | TQ14 8DA |
| New Road | TQ14 8UE TQ14 8UF TQ14 8UH TQ14 8UJ TQ14 8WL TQ14 8UL |
| Northumberland Place | TQ14 8BU TQ14 8BZ TQ14 8DD TQ14 8DE |
| Orchard Gardens | TQ14 8DJ TQ14 8DP TQ14 8DS TQ14 8GJ |
| Osmond Mews | TQ14 8DB |
| Paradise Glen | TQ14 8NT |
| Paradise Road | TQ14 8NJ TQ14 8NR |
| Parson Street | TQ14 8EH |
| Pennyacre Road | TQ14 8LB |
| Portland Avenue | TQ14 8RR |
| Pound Lane | TQ14 8SP |
| Powderham Terrace | TQ14 8BL TQ14 8BN |
| Quay Road | TQ14 8EL |
| Queen Street | TQ14 8BY |
| Regent Gardens | TQ14 8SU |
| Regent Street | TQ14 8SJ TQ14 8SX |
| Rockfield Close | TQ14 8TS |
| Seymour Mews | TQ14 8TL |
| Somerset Place | TQ14 8DT TQ14 8EN TQ14 8EP TQ14 8EW TQ14 8ER |
| South View | TQ14 8BJ |
| St Davids Road | TQ14 8RW |
| St Michaels Road | TQ14 8UQ |
| St Scholasticas Abbey | TQ14 8FF |
| Stanley Street | TQ14 8EE |
| Start Avenue | TQ14 8RT |
| Station Road | TQ14 8PE |
| Strand | TQ14 8AQ TQ14 8BW TQ14 8XP TQ14 8XZ |
| Sun Lane | TQ14 8EF |
| Teign Street | TQ14 8EA TQ14 8ED TQ14 8EG TQ14 8EQ |
| Teign View Place | TQ14 8BX |
| Thatcher Drive | TQ14 8RL |
| The Den | TQ14 8BD TQ14 8BE |
| The Rowdens | TQ14 8TT |
| The Triangle | TQ14 8AT TQ14 8AU |
| Triumph Place | TQ14 8GL |
| Waterloo Street | TQ14 8AS |
| Wellington Street | TQ14 8HW TQ14 8HH |
| Westcliff | TQ14 8EX |
| Willow Street | TQ14 8EY |
| Winston Court | TQ14 8QE |
| Woodland Gardens | TQ14 8LQ |
| Woodlands Close | TQ14 8LF |
| Woodway Close | TQ14 8QG |
| Woodway Drive | TQ14 8QA |
| Woodway Road | TQ14 8PT TQ14 8PY TQ14 8PZ TQ14 8QB |
| TQ14 8JX EX7 0LJ TQ14 4AR TQ14 4AS TQ14 4BB TQ14 4BE TQ14 4BH TQ14 4BJ TQ14 4BL TQ14 4BN TQ14 4BP TQ14 4BQ TQ14 8BB TQ14 8HZ TQ14 8XL TQ14 8ZT TQ14 4BX |
Transport near Teignmouth East
- FAQ
- Price Paid By Year
- Property Type Price
Frequently asked questions about Teignmouth East
What is the average price for a property for sale in Teignmouth East?
The average price for a property for sale in Teignmouth East is £298,313. This amount is 15% lower than the average price in Teignmouth. There are 748 property listings for sale in Teignmouth East.
What streets have the most expensive properties for sale in Teignmouth East?
The streets with the most expensive properties for sale in Teignmouth East are Cliffden Close at an average of £811,250, St Scholasticas Abbey at an average of £605,000 and Rockfield Close at an average of £580,300.
What streets have the most affordable properties for sale in Teignmouth East?
The streets with the most affordable properties for sale in Teignmouth East are Barnpark Terrace at an average of £118,250, Clampet Lane at an average of £139,400 and Wellington Street at an average of £145,416.
Which train stations are available in or near Teignmouth East?
Some of the train stations available in or near Teignmouth East are Teignmouth, Dawlish and Dawlish Warren.
Property Price Paid in Teignmouth East by Year
The average sold property price by year was:
| Year | Average Sold Price | Price Change |
Sold Properties
|
|---|---|---|---|
| 2025 | £299,070 | -6% |
72 Properties |
| 2024 | £318,142 | 14% |
129 Properties |
| 2023 | £273,897 | -2% |
107 Properties |
| 2022 | £278,332 | -3% |
148 Properties |
| 2021 | £286,236 | 2% |
168 Properties |
| 2020 | £279,427 | 5% |
105 Properties |
| 2019 | £265,488 | -3% |
111 Properties |
| 2018 | £273,057 | 1% |
139 Properties |
| 2017 | £270,878 | 9% |
139 Properties |
| 2016 | £245,765 | 8% |
158 Properties |
| 2015 | £226,502 | 2% |
157 Properties |
| 2014 | £221,420 | 8% |
160 Properties |
| 2013 | £203,330 | 0,5% |
153 Properties |
| 2012 | £202,349 | -2% |
132 Properties |
| 2011 | £207,164 | -3% |
95 Properties |
| 2010 | £213,810 | 6% |
110 Properties |
| 2009 | £201,983 | 6% |
111 Properties |
| 2008 | £190,067 | -18% |
113 Properties |
| 2007 | £223,416 | 11% |
175 Properties |
| 2006 | £199,599 | -0,4% |
186 Properties |
| 2005 | £200,438 | 16% |
121 Properties |
| 2004 | £167,472 | 12% |
121 Properties |
| 2003 | £148,194 | 5% |
139 Properties |
| 2002 | £140,341 | 21% |
157 Properties |
| 2001 | £110,549 | 15% |
171 Properties |
| 2000 | £94,046 | - |
138 Properties |
| 1999 | £94,069 | 20% |
188 Properties |
| 1998 | £75,023 | 1% |
117 Properties |
| 1997 | £74,166 | 1% |
151 Properties |
| 1996 | £73,234 | -7% |
113 Properties |
| 1995 | £78,592 | - |
97 Properties |
Property Price per Property Type in Teignmouth East
Here you can find historic sold price data in order to help with your property search.
The average Property Paid Price for specific property types in the last three years are:
| Property Type | Average Sold Price | Sold Properties |
|---|---|---|
| Flat | £205,633.00 | 176 Flats |
| Semi Detached House | £384,392.00 | 27 Semi Detached Houses |
| Detached House | £461,586.00 | 77 Detached Houses |
| Terraced House | £348,864.00 | 28 Terraced Houses |

