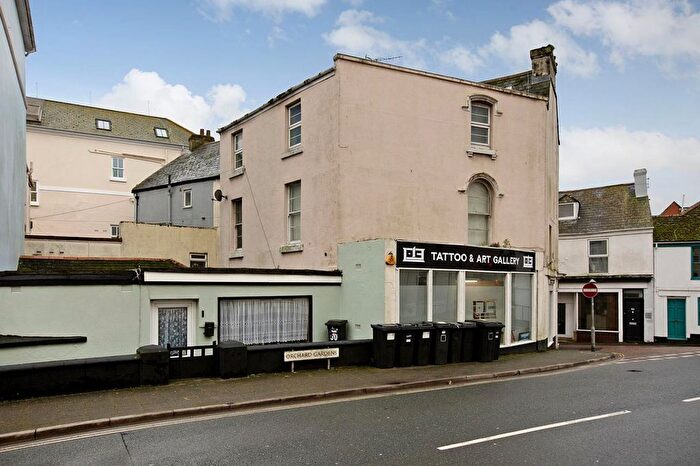
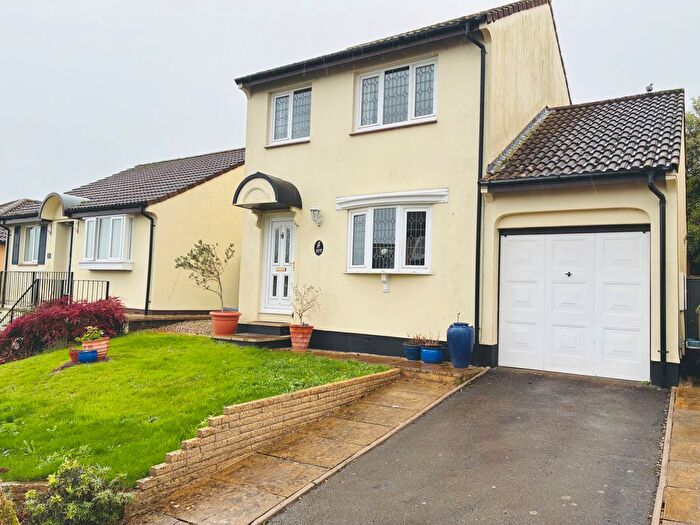
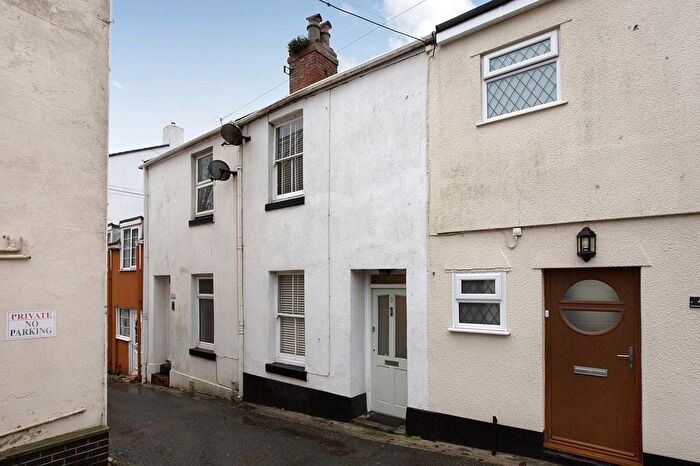
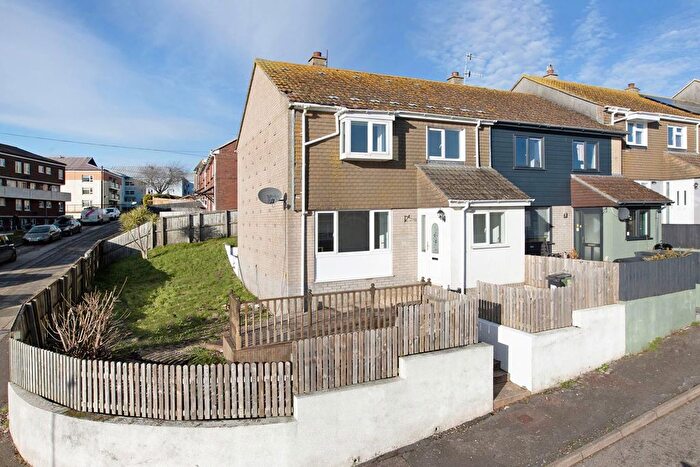
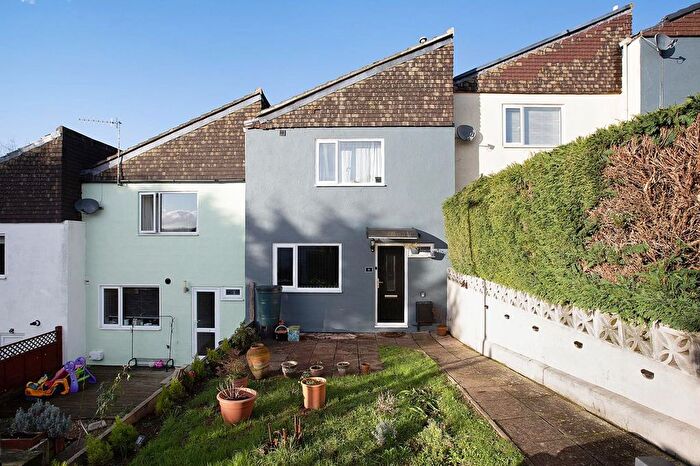
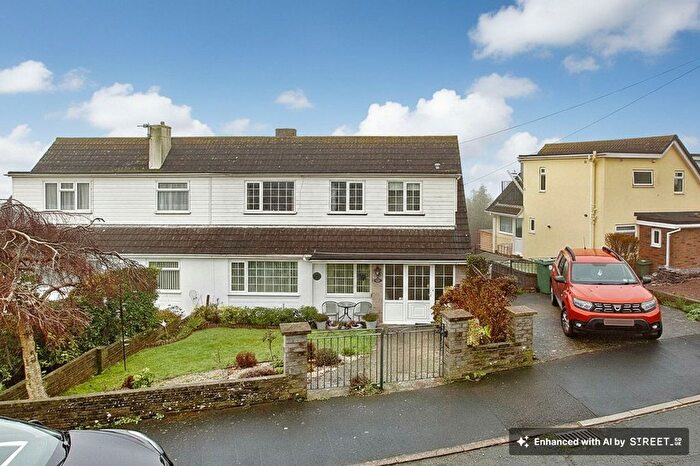
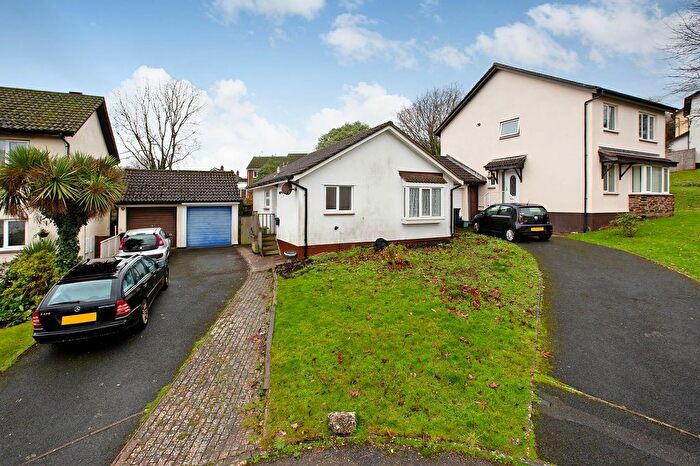
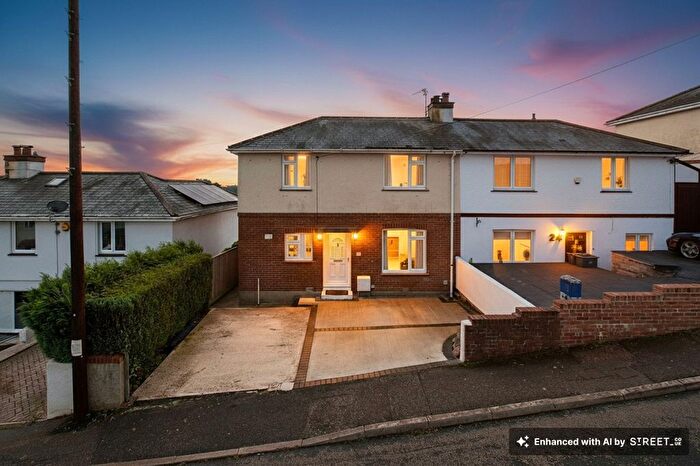
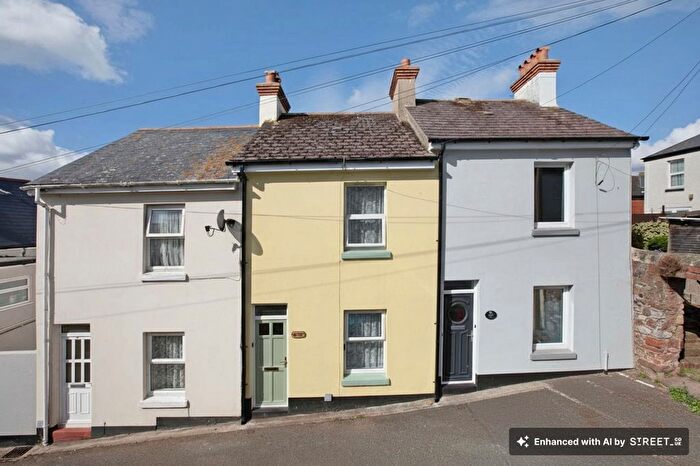
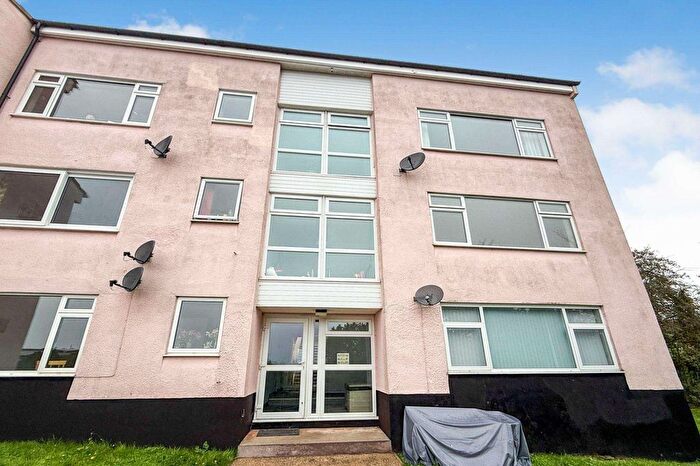
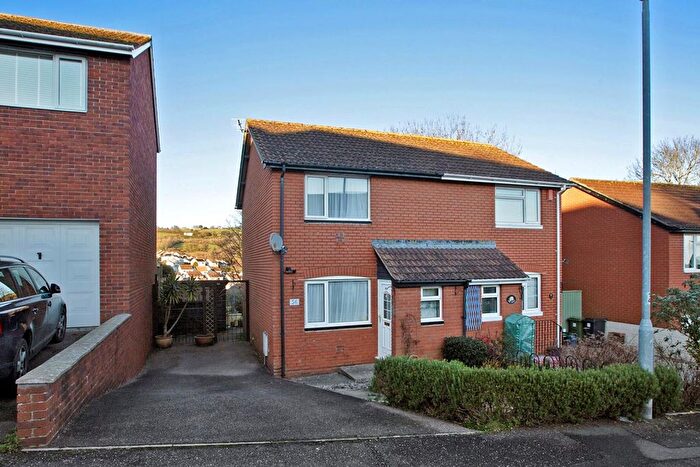
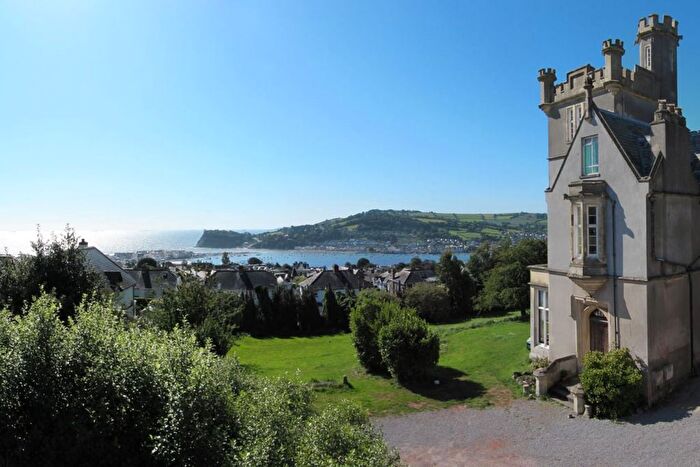
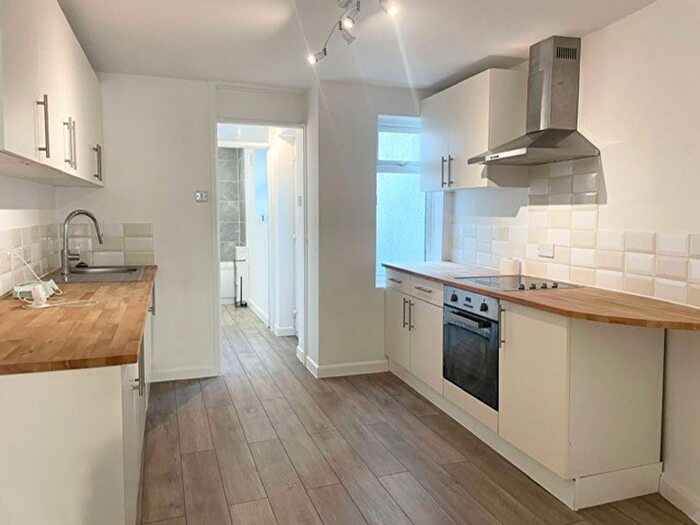
Houses for sale & to rent in Teignmouth West, Teignmouth
House Prices in Teignmouth West
Properties in Teignmouth West have an average house price of £275,050.00 and had 211 Property Transactions within the last 3 years¹.
Teignmouth West is an area in Teignmouth, Devon with 2,124 households², where the most expensive property was sold for £615,000.00.
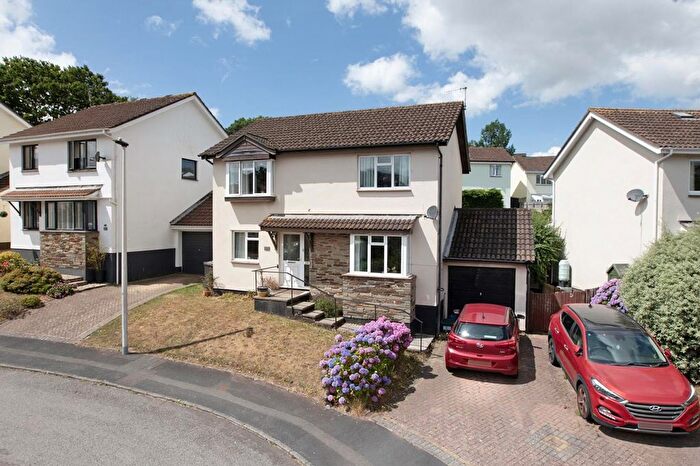
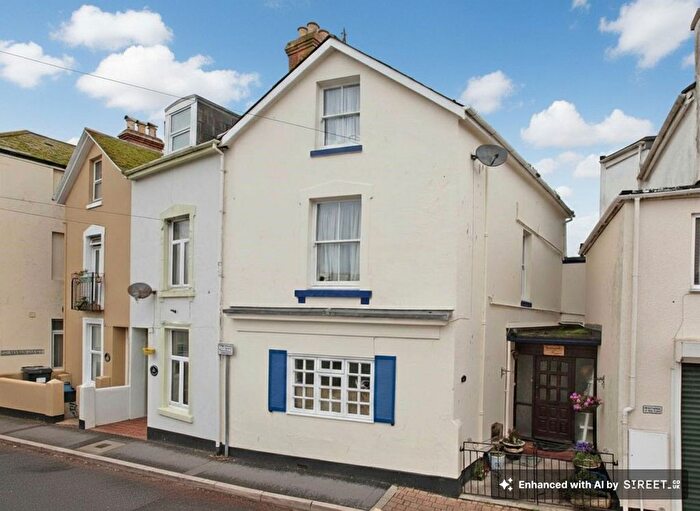
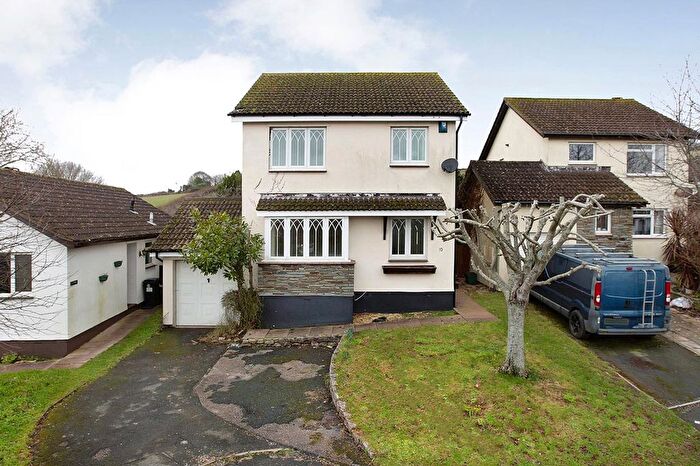
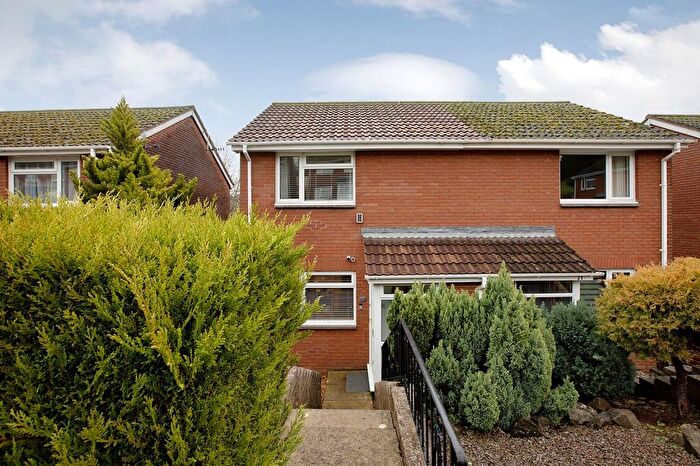
Properties for sale in Teignmouth West
Previously listed properties in Teignmouth West
Roads and Postcodes in Teignmouth West
Navigate through our locations to find the location of your next house in Teignmouth West, Teignmouth for sale or to rent.
| Streets | Postcodes |
|---|---|
| Alexandra Terrace | TQ14 8HA |
| Beechwood Court | TQ14 9UP |
| Bishop Wilfrid Road | TQ14 9BN |
| Bishopsteignton Road | TQ14 9AB TQ14 9AD TQ14 9PH |
| Bitton Avenue | TQ14 8HD |
| Bitton Park Road | TQ14 9BZ TQ14 9DA TQ14 9DD TQ14 9DF TQ14 9DQ TQ14 9DG |
| Broadmeadow Industrial Estate | TQ14 9AE TQ14 9FA |
| Broadmeadow View | TQ14 9BS |
| Brookside Close | TQ14 9EA |
| Bunting Close | TQ14 9BR |
| Cartwright Crescent | TQ14 9DY |
| Chelsea Place | TQ14 9DB |
| Clay Lane | TQ14 8FX |
| Coleman Avenue | TQ14 9DU |
| Coombe Avenue | TQ14 9EP |
| Coombe Gardens | TQ14 9DH |
| Coombe Lane | TQ14 9EX TQ14 9EY |
| Coombe Park Road | TQ14 9EE TQ14 9FF |
| Coombe Vale Road | TQ14 9EN TQ14 9ER TQ14 9EQ |
| Coombe Valley | TQ14 9EZ |
| Coombe View | TQ14 9UY |
| Dunning Walk | TQ14 9LN TQ14 9LW |
| Falkland Way | TQ14 9HJ |
| First Avenue | TQ14 9DJ TQ14 9BW |
| Fourth Avenue | TQ14 9DR TQ14 9DS TQ14 9DT TQ14 9ED |
| Fraser Drive | TQ14 9DX |
| Galloway Drive | TQ14 9UX |
| Headway Close | TQ14 9BD |
| Headway Cross Road | TQ14 9ET |
| Headway Rise | TQ14 9UJ TQ14 9UL |
| Higher Coombe Drive | TQ14 9LR TQ14 9NL |
| Higher Kingsdown Road | TQ14 9AT |
| Hillside Close | TQ14 9XE |
| Hopes Close | TQ14 9EU |
| Howard Close | TQ14 9NW |
| Howard Court | TQ14 9UB |
| Hutchings Way | TQ14 9BE TQ14 9BG |
| Inverteign Drive | TQ14 9AF |
| Inverteign Heights | TQ14 9EF |
| Jordan Drive | TQ14 9DZ |
| Keatings Lane | TQ14 9EJ |
| Keats Close | TQ14 9UQ |
| Kingsdown Close | TQ14 9AX |
| Kingsdown Road | TQ14 9AU |
| Kingsway | TQ14 9AG TQ14 9AH TQ14 9AJ TQ14 9AQ TQ14 9AR TQ14 9AS |
| Lake Avenue | TQ14 9LL |
| Lower Kingsdown Road | TQ14 9AP TQ14 9AY |
| Meadow Rise | TQ14 9UT |
| Milford Close | TQ14 9BL |
| Mill Lane | TQ14 9AZ TQ14 9BA TQ14 9BB TQ14 9BH TQ14 9BJ TQ14 9BQ |
| Moor View Drive | TQ14 9UN TQ14 9UR TQ14 9UZ |
| Nelson Close | TQ14 9NH |
| Newfoundland Road | TQ14 9WP |
| Old Quay | TQ14 8EU |
| Old Quay Street | TQ14 8ES |
| Paddons Lane | TQ14 9HA |
| Park Hill Villas | TQ14 8HB |
| Perros Close | TQ14 9UG |
| Reed Vale | TQ14 9EH |
| Rivermead Mews | TQ14 9FH |
| Rocky Lane | TQ14 9ES |
| Sawyer Drive | TQ14 9UD |
| Second Avenue | TQ14 9DL TQ14 9DN |
| Shaldon Bridge | TQ14 9AA |
| Soper Walk | TQ14 9LP |
| St Patricks Close | TQ14 9EB |
| Third Avenue | TQ14 9DP TQ14 9DW |
| Valley Close | TQ14 9UF |
| Westbrook Avenue | TQ14 9EL TQ14 9QQ |
| Whitear Close | TQ14 9UU |
Transport near Teignmouth West
- FAQ
- Price Paid By Year
- Property Type Price
Frequently asked questions about Teignmouth West
What is the average price for a property for sale in Teignmouth West?
The average price for a property for sale in Teignmouth West is £275,050. This amount is 21% lower than the average price in Teignmouth. There are 724 property listings for sale in Teignmouth West.
What streets have the most expensive properties for sale in Teignmouth West?
The streets with the most expensive properties for sale in Teignmouth West are Milford Close at an average of £592,500, Paddons Lane at an average of £480,000 and Inverteign Drive at an average of £425,000.
What streets have the most affordable properties for sale in Teignmouth West?
The streets with the most affordable properties for sale in Teignmouth West are Inverteign Heights at an average of £84,000, Fraser Drive at an average of £133,000 and Bishop Wilfrid Road at an average of £147,000.
Which train stations are available in or near Teignmouth West?
Some of the train stations available in or near Teignmouth West are Teignmouth, Dawlish and Newton Abbot.
Property Price Paid in Teignmouth West by Year
The average sold property price by year was:
| Year | Average Sold Price | Price Change |
Sold Properties
|
|---|---|---|---|
| 2025 | £279,489 | 2% |
67 Properties |
| 2024 | £273,664 | 1% |
77 Properties |
| 2023 | £272,203 | 10% |
67 Properties |
| 2022 | £246,260 | 6% |
77 Properties |
| 2021 | £232,182 | 5% |
112 Properties |
| 2020 | £220,931 | 7% |
64 Properties |
| 2019 | £205,040 | -4% |
71 Properties |
| 2018 | £212,763 | 1% |
81 Properties |
| 2017 | £211,179 | 4% |
86 Properties |
| 2016 | £202,939 | 12% |
98 Properties |
| 2015 | £178,288 | 5% |
99 Properties |
| 2014 | £169,721 | 3% |
100 Properties |
| 2013 | £164,240 | -9% |
104 Properties |
| 2012 | £178,622 | 10% |
69 Properties |
| 2011 | £161,499 | -3% |
58 Properties |
| 2010 | £166,175 | 5% |
68 Properties |
| 2009 | £158,290 | -8% |
70 Properties |
| 2008 | £171,126 | -0,5% |
62 Properties |
| 2007 | £171,949 | 3% |
112 Properties |
| 2006 | £166,861 | 10% |
131 Properties |
| 2005 | £150,568 | -1% |
72 Properties |
| 2004 | £152,115 | 17% |
126 Properties |
| 2003 | £125,987 | 14% |
120 Properties |
| 2002 | £107,881 | 27% |
120 Properties |
| 2001 | £78,650 | 9% |
133 Properties |
| 2000 | £71,207 | 7% |
127 Properties |
| 1999 | £66,035 | 9% |
133 Properties |
| 1998 | £60,128 | 16% |
125 Properties |
| 1997 | £50,555 | -1% |
114 Properties |
| 1996 | £51,162 | -4% |
110 Properties |
| 1995 | £53,177 | - |
94 Properties |
Property Price per Property Type in Teignmouth West
Here you can find historic sold price data in order to help with your property search.
The average Property Paid Price for specific property types in the last three years are:
| Property Type | Average Sold Price | Sold Properties |
|---|---|---|
| Semi Detached House | £292,661.00 | 45 Semi Detached Houses |
| Detached House | £352,849.00 | 67 Detached Houses |
| Terraced House | £224,800.00 | 84 Terraced Houses |
| Flat | £156,114.00 | 15 Flats |

