
Houses for sale in Wellington, Somerset
House Prices in Wellington
Properties in Wellington have an average house price of £299k and had 911 Property Transactions within the last 3 years.¹
Wellington is an area in Somerset with 8,947 households², where the most expensive property was sold for £1.58M.
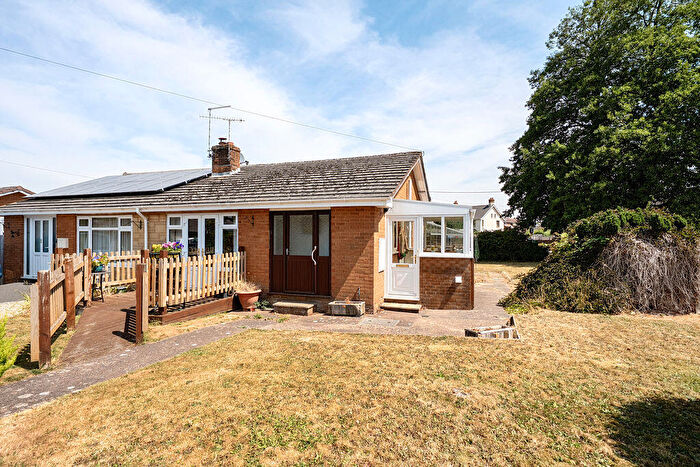
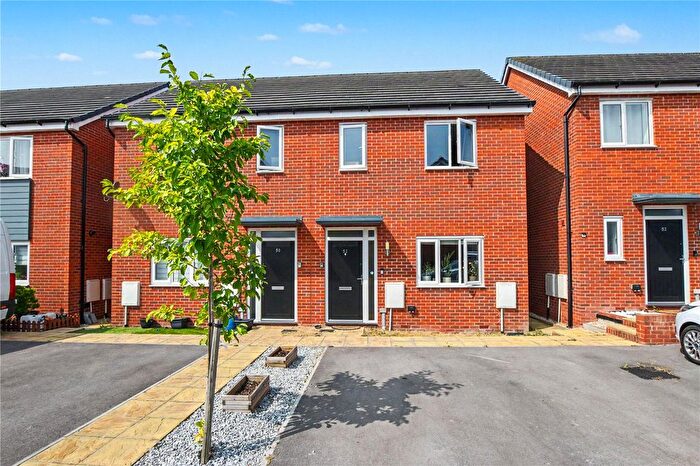
Properties for sale in Wellington
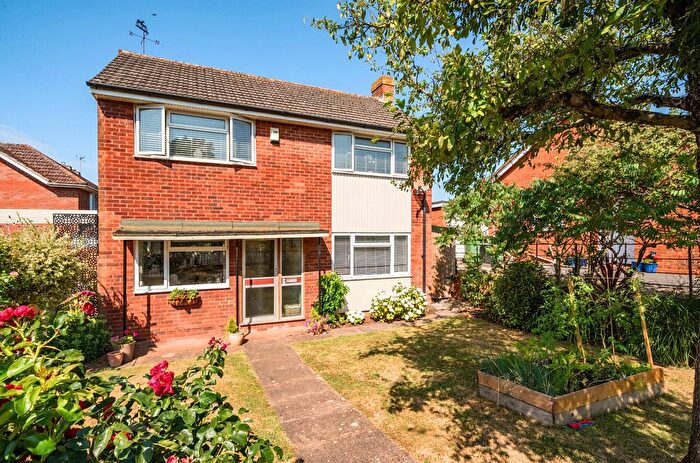
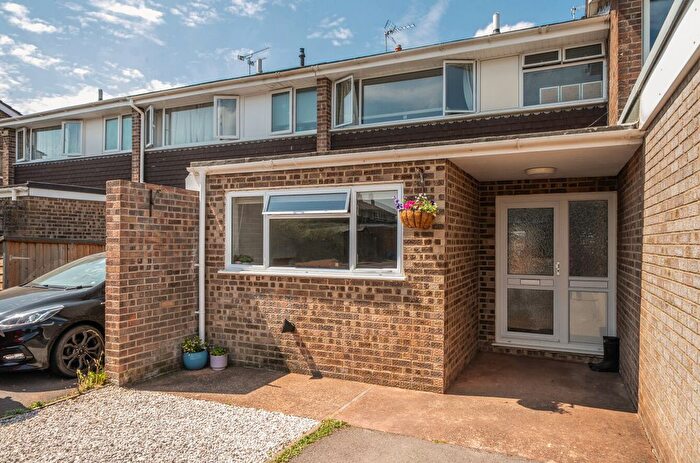
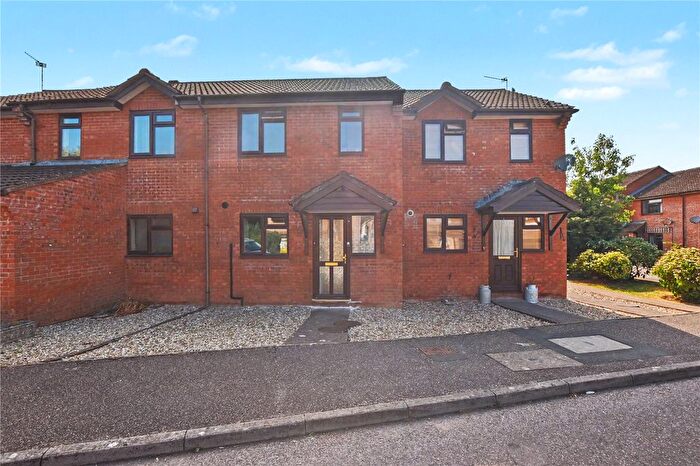
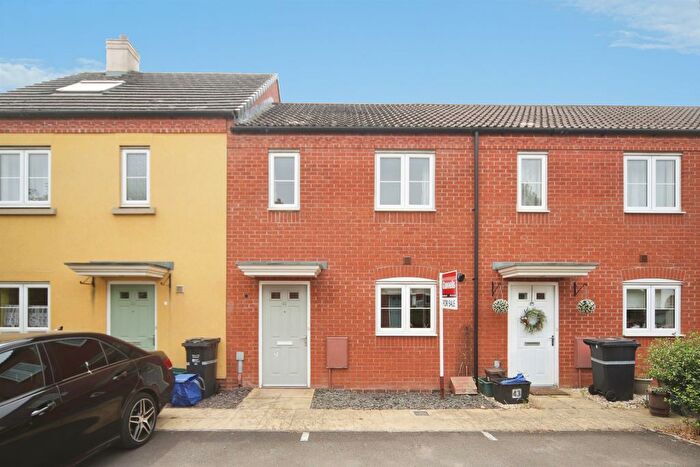
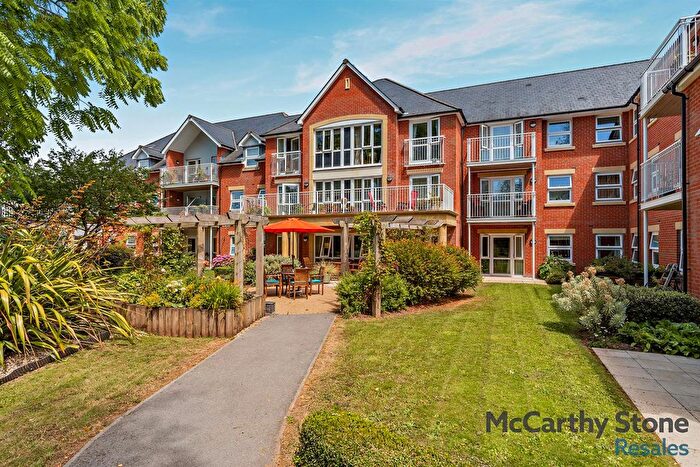
![]()
If you are looking to sell your house, let it out, or receive a property valuation, an expert can help you.
Click the button below to get started.
Neighbourhoods in Wellington
Navigate through our locations to find the location of your next house in Wellington, Somerset for sale or to rent.
Property price trends in Wellington
According to the latest Land Registry data, the average home in Wellington sold for £310,331 in 2026. That figure comes from a substantial record of 11,511 sales logged over the past 31 years.
Prices have moved up over the last three years. Compared with 2023, when the typical sale came in around £298,267, that's a rise of roughly 4%.
Looking back five years, average prices are up about 7.6% since 2021, a gain of around £21,902 in cash terms.
Zoom out to the past decade for the fuller picture. Back in 2016, homes here averaged £214,385, so the typical sold price has climbed about 44.8% since then, roughly 3.8% a year. Stretch the view to fifteen years and that annual pace eases back to about 3%.
Frequently asked questions about Wellington
What is the average price for a property for sale in Wellington?
The average price for a property for sale in Wellington is £298,781. This amount is 6% lower than the average price in Somerset. There are 2,260 property listings for sale in Wellington.
What locations have the most expensive properties for sale in Wellington?
The locations with the most expensive properties for sale in Wellington are Wiveliscombe & District at an average of £770,000, Blackdown at an average of £725,000 and Wiveliscombe And West Deane at an average of £637,041.
What locations have the most affordable properties for sale in Wellington?
The locations with the most affordable properties for sale in Wellington are Wellington Rockwell Green And West at an average of £271,580, Wellington East at an average of £273,157 and Wellington North at an average of £273,907.
Which train stations are available in or near Wellington?
Some of the train stations available in or near Wellington are Taunton, Tiverton Parkway and Honiton.
Property Price Paid in Wellington by Year
The average sold property price by year was:
| Year | Average Sold Price | Price Change |
Sold Properties
|
|---|---|---|---|
| 2026 | £310,331 | 5% |
35 Properties |
| 2025 | £294,796 | -3% |
307 Properties |
| 2024 | £302,251 | 1% |
279 Properties |
| 2023 | £298,267 | -4% |
290 Properties |
| 2022 | £310,552 | 7% |
349 Properties |
| 2021 | £288,429 | 13% |
400 Properties |
| 2020 | £251,901 | 3% |
326 Properties |
| 2019 | £243,850 | 3% |
372 Properties |
| 2018 | £235,664 | 2% |
441 Properties |
| 2017 | £230,258 | 7% |
407 Properties |
Property Price per Property Type in Wellington
Here you can find historic sold price data in order to help with your property search.
The average Property Paid Price for specific property types in the last three years are:
| Property Type | Average Sold Price | Sold Properties |
|---|---|---|
| Semi Detached House | £284,107.00 | 217 Semi Detached Houses |
| Detached House | £442,353.00 | 272 Detached Houses |
| Terraced House | £236,610.00 | 317 Terraced Houses |
| Flat | £144,883.00 | 105 Flats |
Transport in Wellington
Please see below transportation links in this area:
