
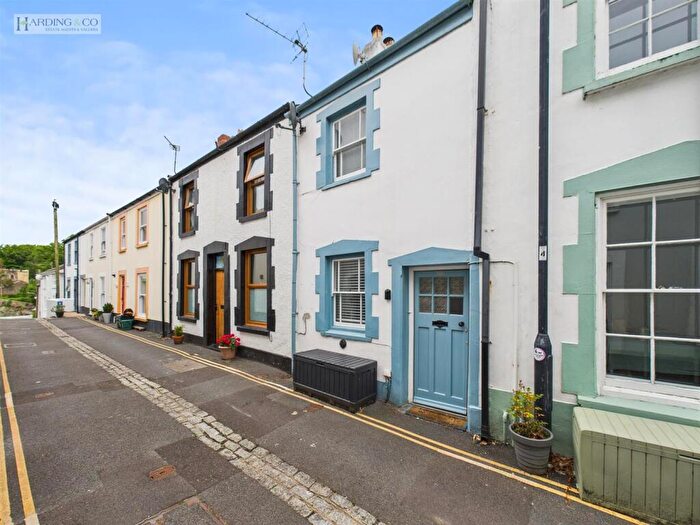
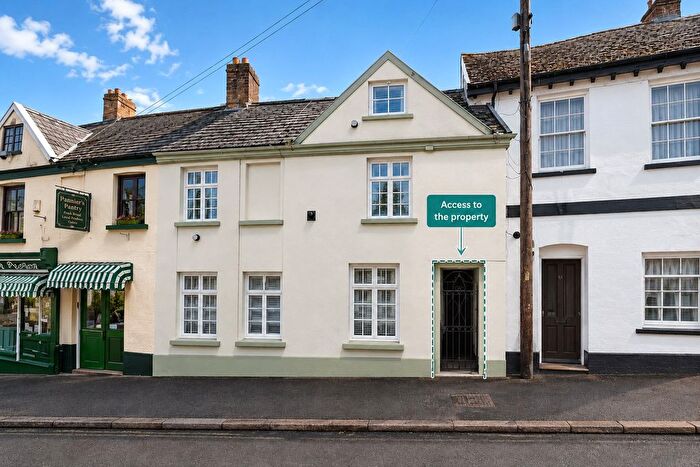
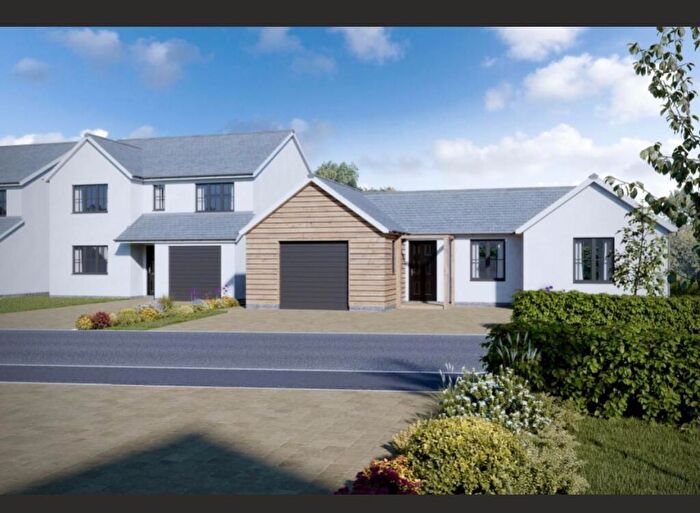
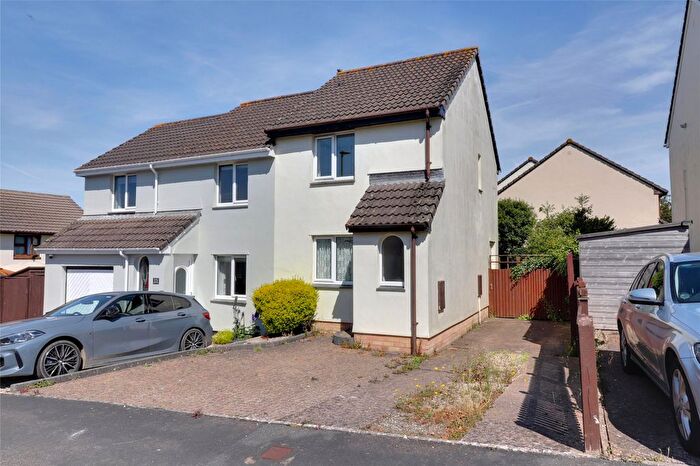
Houses for sale in Torrington, Devon
House Prices in Torrington
Properties in Torrington have an average house price of £275k and had 385 Property Transactions within the last 3 years.¹
Torrington is an area in Devon with 3,666 households², where the most expensive property was sold for £900k.
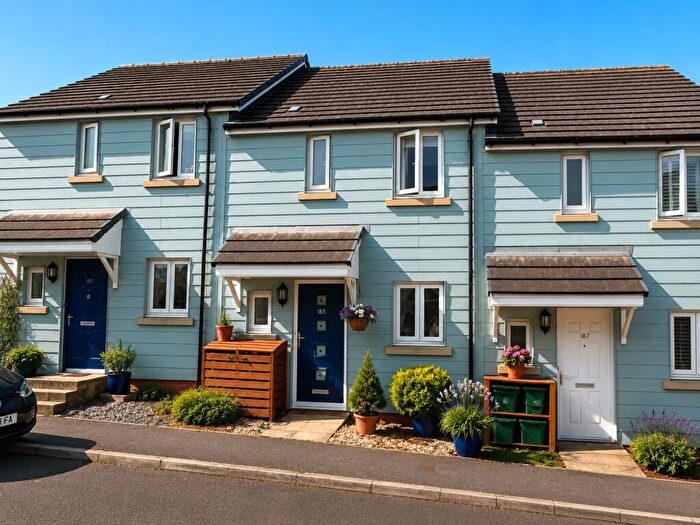
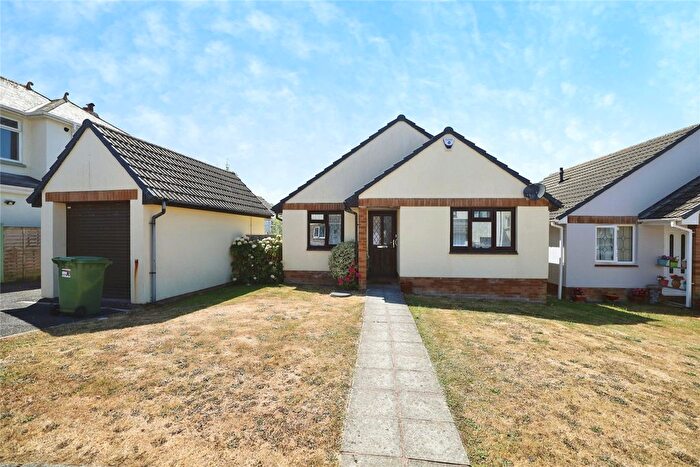
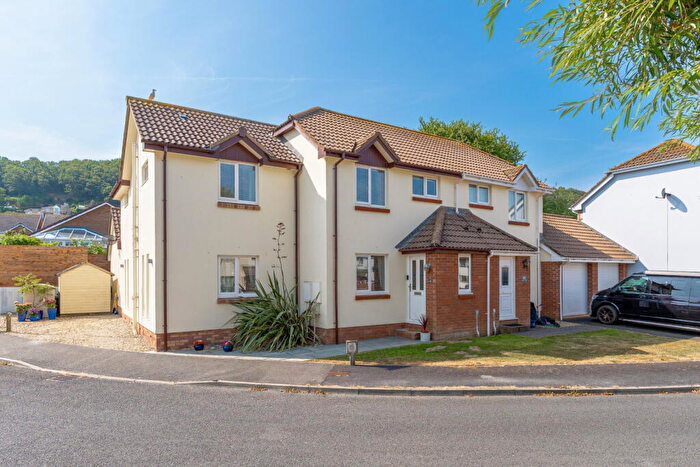
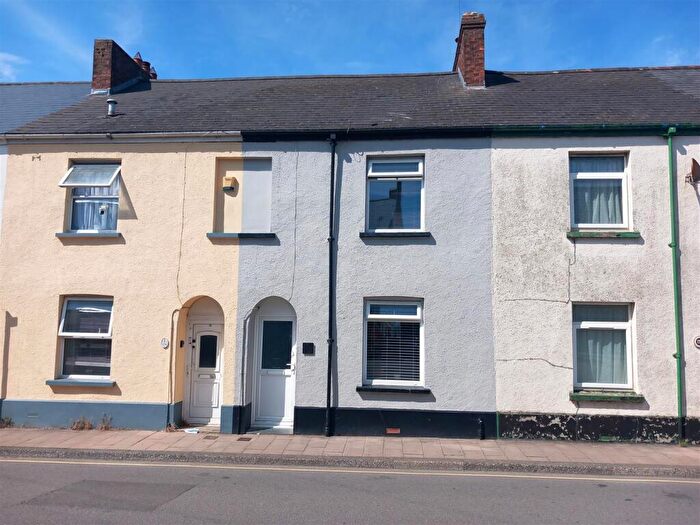
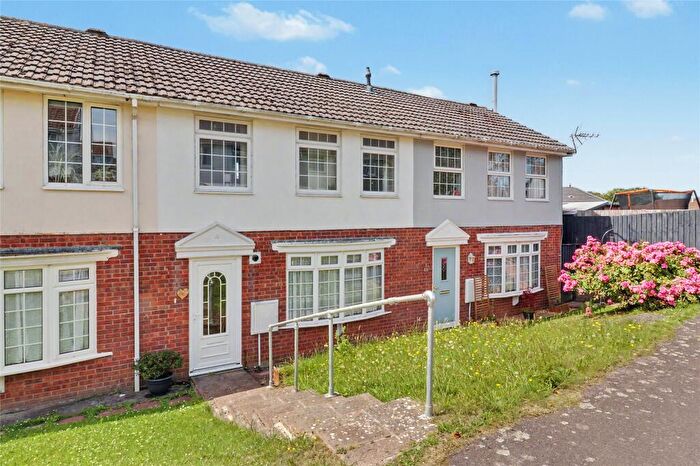
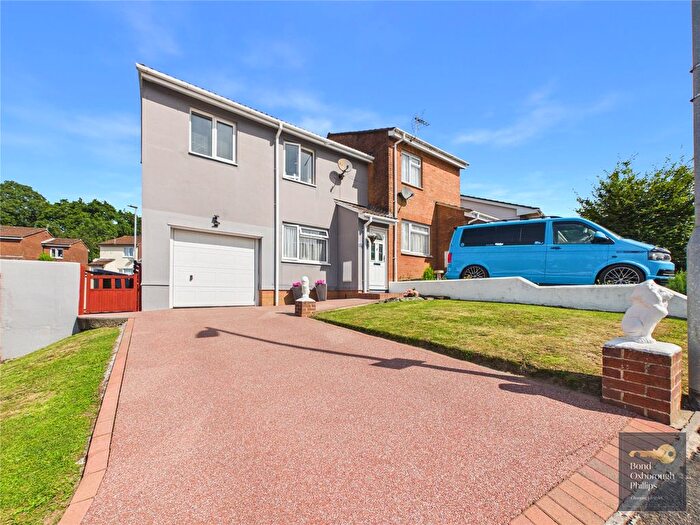
Properties for sale in Torrington
![]()
If you are looking to sell your house, let it out, or receive a property valuation, an expert can help you.
Click the button below to get started.

Neighbourhoods in Torrington
Navigate through our locations to find the location of your next house in Torrington, Devon for sale or to rent.
Property price trends in Torrington
According to the latest Land Registry data, the average home in Torrington sold for £278,610 in 2026. That figure comes from 4,884 sales logged over the past 31 years.
Prices have moved up over the last three years. Compared with 2023, when the typical sale came in around £274,018, that's a rise of roughly 1.7%.
Looking back five years, average prices are up about 1.6% since 2021, a gain of around £4,438 in cash terms.
Zoom out to the past decade for the fuller picture. Back in 2016, homes here averaged £197,284, so the typical sold price has climbed about 41.2% since then, roughly 3.5% a year. Stretch the view to fifteen years and that annual pace eases back to about 3.1%.
Frequently asked questions about Torrington
What is the average price for a property for sale in Torrington?
The average price for a property for sale in Torrington is £275,038. This amount is 24% lower than the average price in Devon. There are 6,297 property listings for sale in Torrington.
What locations have the most expensive properties for sale in Torrington?
The locations with the most expensive properties for sale in Torrington are Monkleigh And Littleham at an average of £383,653, Bideford East at an average of £379,000 and Shebbear And Langtree at an average of £369,028.
What locations have the most affordable properties for sale in Torrington?
The locations with the most affordable properties for sale in Torrington are Shebbear & Langtree at an average of £230,000, Torrington at an average of £246,356 and Great Torrington at an average of £271,846.
Which train stations are available in or near Torrington?
Some of the train stations available in or near Torrington are Chapelton, Umberleigh and Portsmouth Arms.
Property Price Paid in Torrington by Year
The average sold property price by year was:
| Year | Average Sold Price | Price Change |
Sold Properties
|
|---|---|---|---|
| 2026 | £278,610 | 8% |
19 Properties |
| 2025 | £256,771 | -15% |
130 Properties |
| 2024 | £296,562 | 8% |
113 Properties |
| 2023 | £274,018 | 0,1% |
123 Properties |
| 2022 | £273,780 | -0,1% |
108 Properties |
| 2021 | £274,172 | 15% |
184 Properties |
| 2020 | £233,337 | 2% |
135 Properties |
| 2019 | £227,852 | 4% |
134 Properties |
| 2018 | £218,345 | 0,4% |
131 Properties |
| 2017 | £217,447 | 9% |
178 Properties |
Property Price per Property Type in Torrington
Here you can find historic sold price data in order to help with your property search.
The average Property Paid Price for specific property types in the last three years are:
| Property Type | Average Sold Price | Sold Properties |
|---|---|---|
| Flat | £137,909.00 | 11 Flats |
| Semi Detached House | £261,536.00 | 72 Semi Detached Houses |
| Detached House | £369,921.00 | 137 Detached Houses |
| Terraced House | £211,290.00 | 165 Terraced Houses |
Transport in Torrington
Please see below transportation links in this area:
