Houses for sale & to rent in Torrington, Torrington
House Prices in Torrington
Properties in Torrington have an average house price of £246,599.00 and had 246 Property Transactions within the last 3 years¹.
Torrington is an area in Torrington, Devon with 2,364 households², where the most expensive property was sold for £655,000.00.
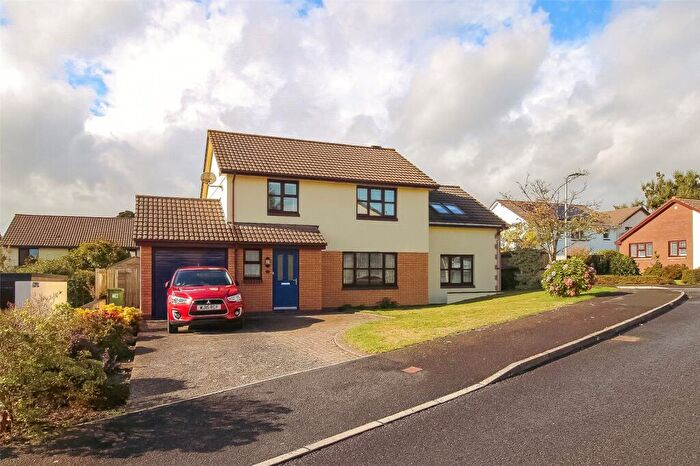
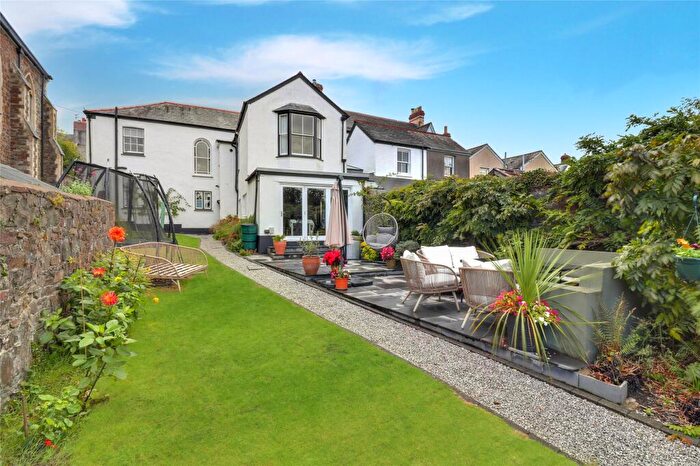
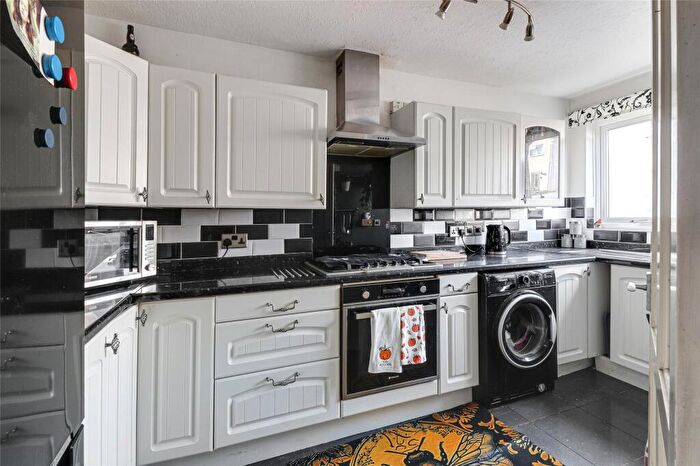
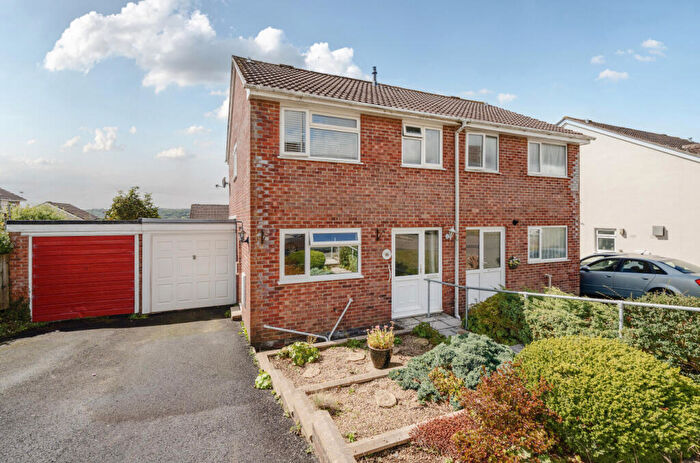
Properties for sale in Torrington
Roads and Postcodes in Torrington
Navigate through our locations to find the location of your next house in Torrington, Torrington for sale or to rent.
| Streets | Postcodes |
|---|---|
| Alice Mews | EX38 8DS |
| Bests Lane | EX38 7BA |
| Borough Road | EX38 7NA |
| Borough View | EX38 7NN |
| Burwood Lane | EX38 7ER |
| Burwood Road | EX38 7NE EX38 7NG EX38 7NQ |
| Caddywell Lane | EX38 7EE |
| Caddywell Meadow | EX38 7NZ |
| Calf Street | EX38 7BG EX38 7BH EX38 8EQ |
| Calvesford Close | EX38 7DH |
| Calvesford Road | EX38 7DQ |
| Castle Hill Gardens | EX38 8ET EX38 8EX |
| Castle Street | EX38 8EZ |
| Church Lane | EX38 8DU |
| Church Walk | EX38 8HS |
| Clinton Terrace | EX38 8DE |
| Cornmarket Street | EX38 8EY |
| Cromwell Close | EX38 7DF |
| Crowbeare Meadow | EX38 7DX |
| Dartington Close | EX38 7DW |
| Dartington Fields | EX38 7DL EX38 7DN |
| Dickhills Lane | EX38 8BB |
| East Street | EX38 7BL |
| Eskil Place | EX38 7AP |
| Fairfax Way | EX38 7DA |
| Fore Street | EX38 8HQ |
| Furzebeam Row | EX38 8DH |
| Gas Lane | EX38 7BE |
| Glove Court | EX38 8DX |
| Goose Green | EX38 7BP |
| Greenbank | EX38 7DP |
| Greenbank Close | EX38 7DT |
| Halsdon Terrace | EX38 8DY |
| Hatchmoor Estate | EX38 7BS |
| Hatchmoor Road | EX38 7BT EX38 7BU EX38 7HR |
| Hodges Walk | EX38 7NP |
| Holwill Drive | EX38 7LQ |
| Hoopers Way | EX38 7NS |
| Hopton Drive | EX38 7DE |
| Hunters Wood | EX38 7NX |
| Jubilee Close | EX38 7DR |
| Juries Lane | EX38 7DG |
| Kingsmead Drive | EX38 7DB EX38 7DD |
| Kitchener Row | EX38 8BJ |
| Limers Hill | EX38 8AX |
| Linden Close | EX38 7AL |
| Louise Court | EX38 7AF |
| Louise Terrace | EX38 8DB |
| Lower Burwood Road | EX38 7NF EX38 7NL |
| Martins Close | EX38 7LG |
| Mill Street | EX38 8AL EX38 8AN EX38 8AW |
| Mill Street Common | EX38 8AY |
| Moorland Terrace | EX38 8DD |
| Morton Drive | EX38 7AS |
| New Road | EX38 8EB EX38 8EJ |
| New Street | EX38 8BN EX38 8BS EX38 8BT EX38 8BU EX38 8BX EX38 8BY EX38 8DF |
| Oakwell Close | EX38 7PA |
| Pannier Mews | EX38 8EE |
| Parkes Road | EX38 7NW |
| Pathfields | EX38 7BX |
| Potacre Street | EX38 8BH |
| Prideaux Meadow | EX38 7NH |
| Queens Terrace | EX38 8DG |
| Quicks Walk | EX38 7NR |
| Rack Park Close | EX38 8AH |
| Rolle Terrace | EX38 8DQ |
| Roscoff Close | EX38 7ND |
| Rosemoor Road | EX38 7NB |
| Sandfords Gardens | EX38 8AR |
| School Lane | EX38 7AJ EX38 7EY |
| South Drive | EX38 8DW |
| South Street | EX38 8AA EX38 8AB EX38 8HE EX38 8HF |
| Stonemans Lane | EX38 7AE |
| Tannery Row | EX38 8ED |
| Tavern Mews | EX38 8HN |
| Torridge View | EX38 8DN |
| Town Park | EX38 7AG EX38 7AH EX38 7AQ |
| Trafalgar Drive | EX38 7AB EX38 7AD |
| Victory Way | EX38 7AR |
| Villa Road | EX38 8DZ |
| Warren Close | EX38 8DR |
| Warren Lane | EX38 8AG EX38 8AZ EX38 8DP |
| Well Park Road | EX38 8ES |
| Well Street | EX38 7BN EX38 7BW EX38 8EP EX38 8ER |
| EX38 7EL EX38 7EN EX38 7EP EX38 7ES EX38 7EU EX38 7HL EX38 7HX EX38 8JD |
Transport near Torrington
- FAQ
- Price Paid By Year
- Property Type Price
Frequently asked questions about Torrington
What is the average price for a property for sale in Torrington?
The average price for a property for sale in Torrington is £246,599. This amount is 11% lower than the average price in Torrington. There are 601 property listings for sale in Torrington.
What streets have the most expensive properties for sale in Torrington?
The streets with the most expensive properties for sale in Torrington are Hatchmoor Road at an average of £655,000, Gas Lane at an average of £560,000 and Villa Road at an average of £555,000.
What streets have the most affordable properties for sale in Torrington?
The streets with the most affordable properties for sale in Torrington are South Street at an average of £123,800, Alice Mews at an average of £160,000 and Hunters Wood at an average of £162,500.
Which train stations are available in or near Torrington?
Some of the train stations available in or near Torrington are Chapelton, Umberleigh and Portsmouth Arms.
Property Price Paid in Torrington by Year
The average sold property price by year was:
| Year | Average Sold Price | Price Change |
Sold Properties
|
|---|---|---|---|
| 2025 | £240,798 | -10% |
84 Properties |
| 2024 | £264,115 | 10% |
73 Properties |
| 2023 | £237,708 | -3% |
89 Properties |
| 2022 | £243,777 | 12% |
73 Properties |
| 2021 | £215,608 | 3% |
112 Properties |
| 2020 | £209,304 | 2% |
92 Properties |
| 2019 | £205,445 | 3% |
95 Properties |
| 2018 | £198,513 | 2% |
90 Properties |
| 2017 | £194,314 | 10% |
108 Properties |
| 2016 | £175,049 | 1% |
121 Properties |
| 2015 | £174,098 | 4% |
93 Properties |
| 2014 | £167,940 | 9% |
112 Properties |
| 2013 | £153,457 | -8% |
123 Properties |
| 2012 | £165,967 | 8% |
78 Properties |
| 2011 | £153,018 | -2% |
69 Properties |
| 2010 | £156,226 | 1% |
77 Properties |
| 2009 | £154,429 | -7% |
100 Properties |
| 2008 | £164,507 | -10% |
87 Properties |
| 2007 | £181,199 | 4% |
160 Properties |
| 2006 | £174,805 | 12% |
170 Properties |
| 2005 | £153,911 | 4% |
104 Properties |
| 2004 | £147,327 | 11% |
79 Properties |
| 2003 | £131,158 | 29% |
106 Properties |
| 2002 | £93,518 | 18% |
155 Properties |
| 2001 | £77,058 | 7% |
141 Properties |
| 2000 | £71,885 | 20% |
168 Properties |
| 1999 | £57,574 | -3% |
173 Properties |
| 1998 | £59,205 | 9% |
149 Properties |
| 1997 | £53,986 | 22% |
157 Properties |
| 1996 | £42,183 | -8% |
104 Properties |
| 1995 | £45,573 | - |
94 Properties |
Property Price per Property Type in Torrington
Here you can find historic sold price data in order to help with your property search.
The average Property Paid Price for specific property types in the last three years are:
| Property Type | Average Sold Price | Sold Properties |
|---|---|---|
| Semi Detached House | £251,677.00 | 48 Semi Detached Houses |
| Detached House | £339,062.00 | 67 Detached Houses |
| Terraced House | £203,420.00 | 121 Terraced Houses |
| Flat | £125,200.00 | 10 Flats |

