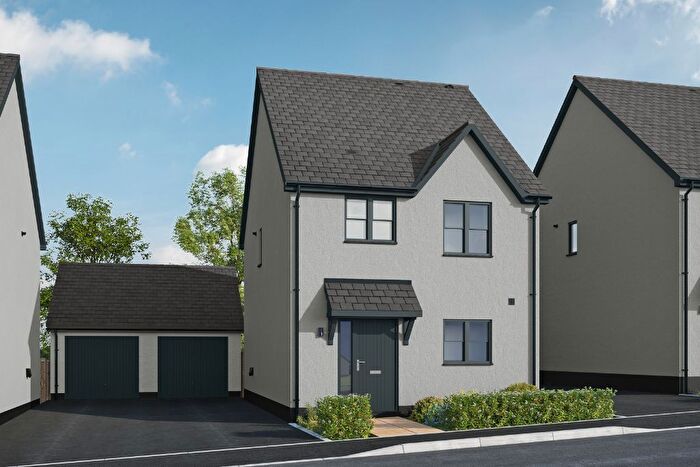
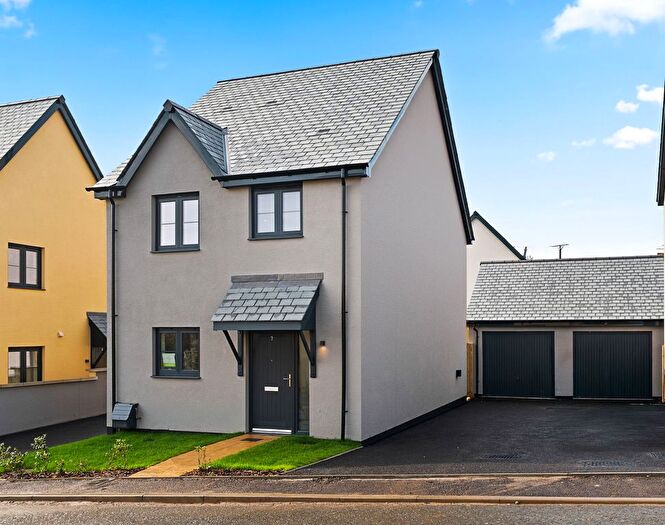
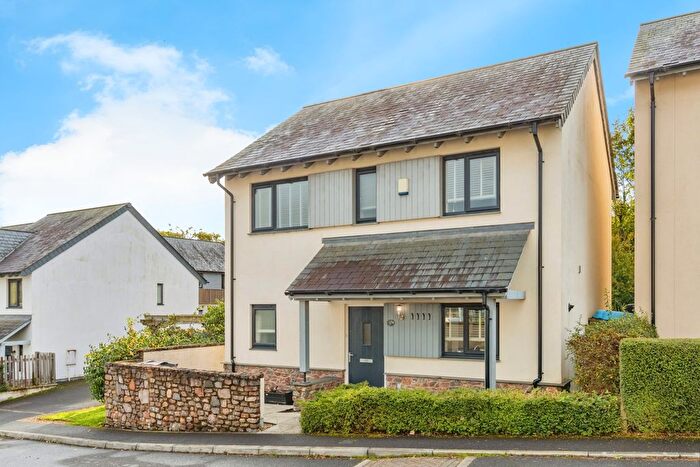
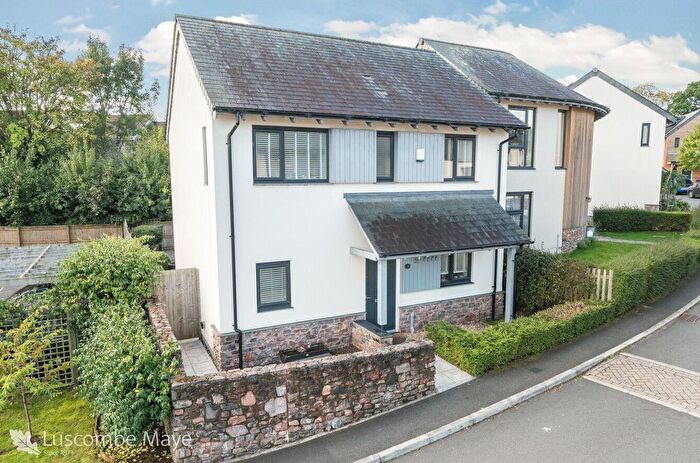
Houses for sale & to rent in Eastmoor, Totnes
House Prices in Eastmoor
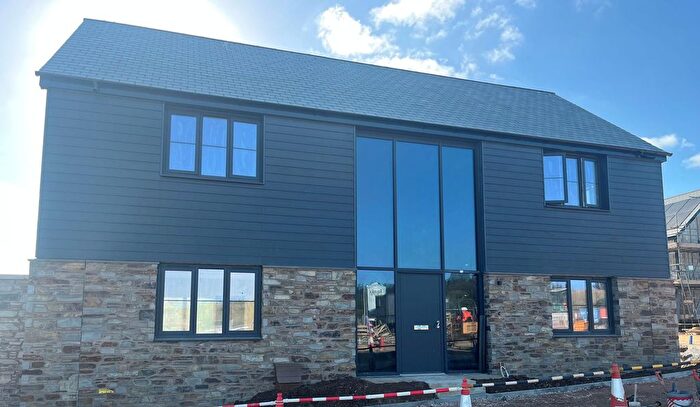
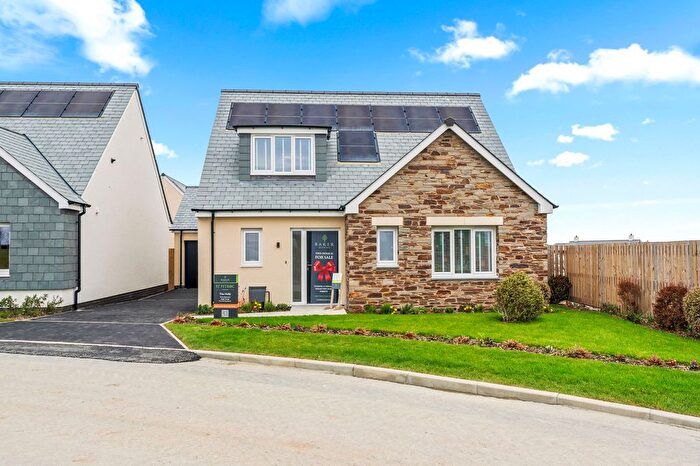
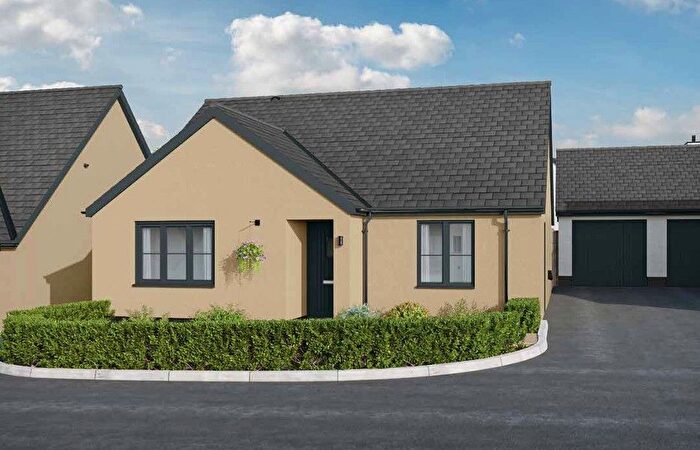
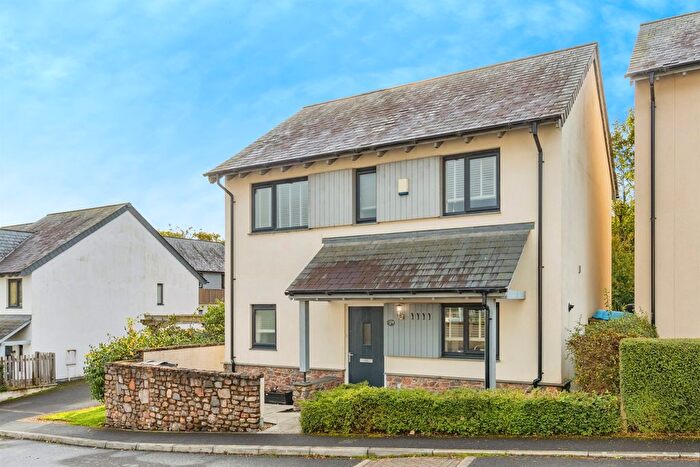
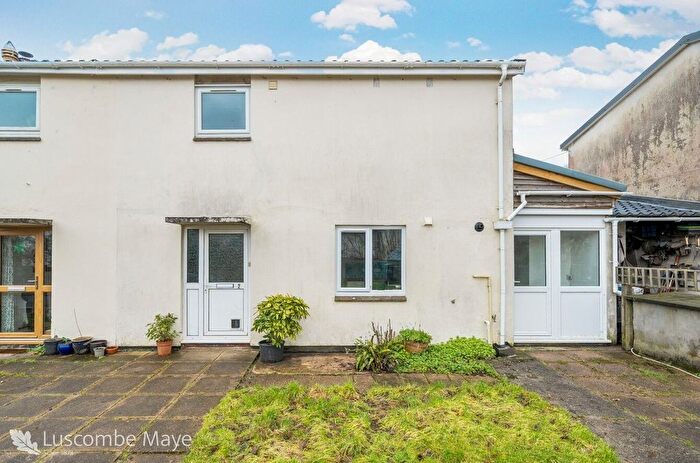
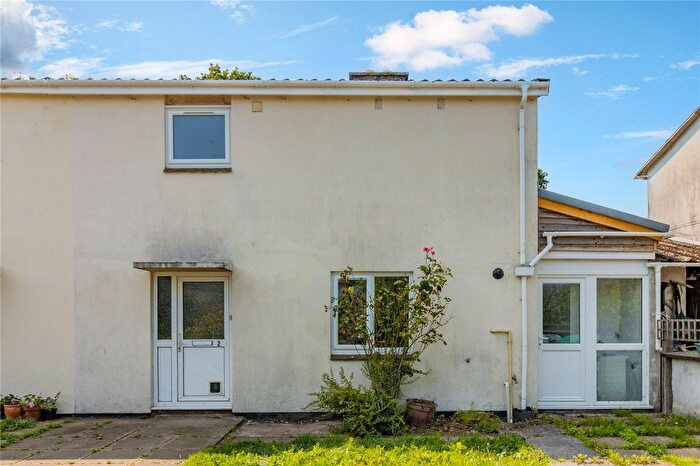
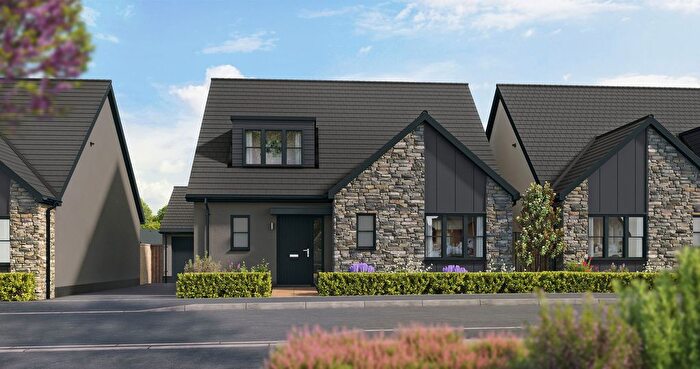
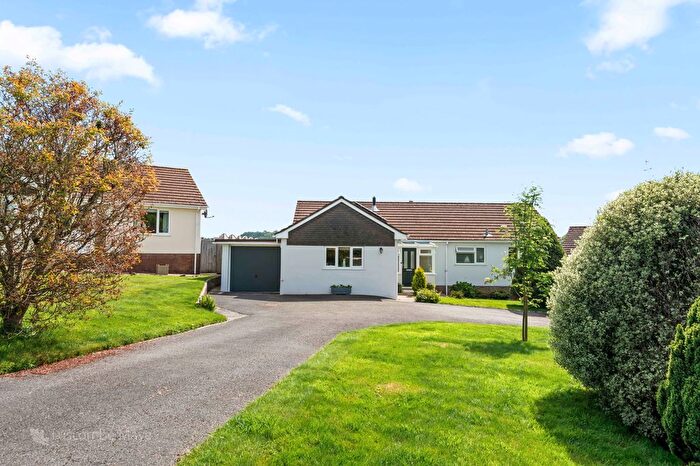
Properties in Eastmoor have an average house price of £657,063.00 and had 26 Property Transactions within the last 3 years¹.
Eastmoor is an area in Totnes, Devon with 172 households², where the most expensive property was sold for £1,655,000.00.
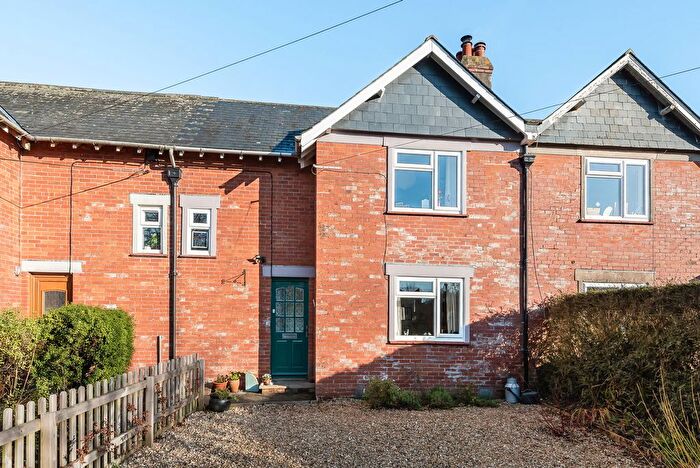
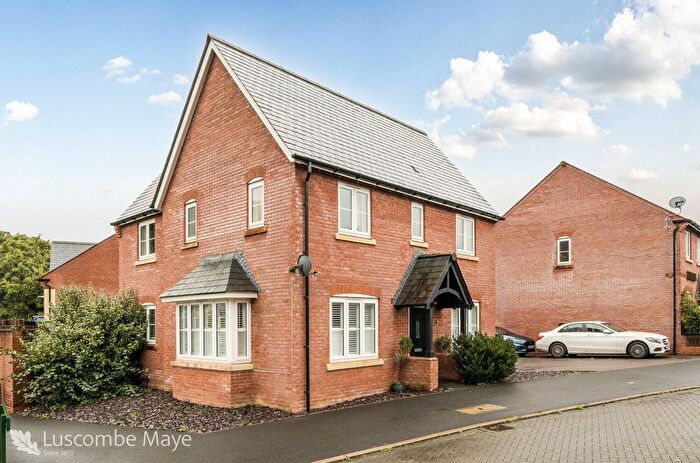
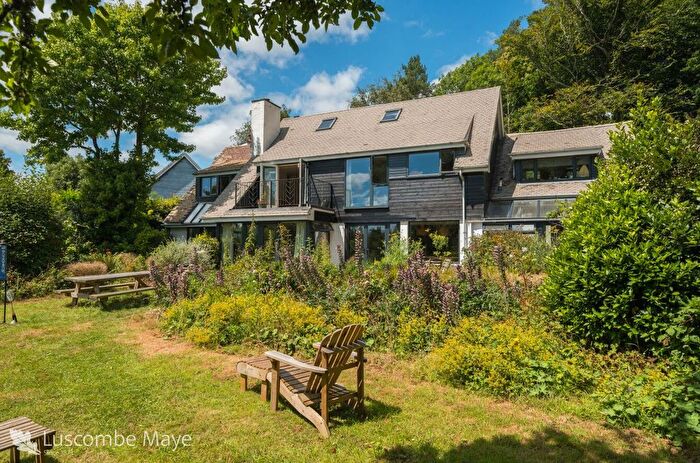
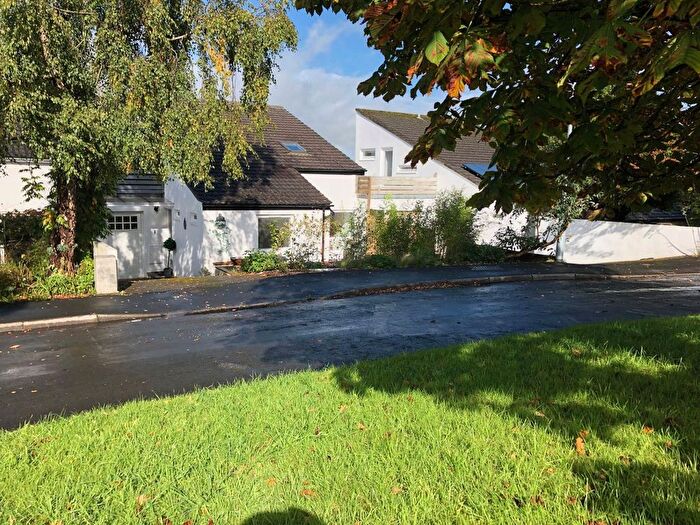
Properties for sale in Eastmoor
Previously listed properties in Eastmoor
Roads and Postcodes in Eastmoor
Navigate through our locations to find the location of your next house in Eastmoor, Totnes for sale or to rent.
| Streets | Postcodes |
|---|---|
| Barkingdon Court | TQ9 6AN |
| Eventide Cottages | TQ9 6PD |
| Moor Road | TQ9 6PB |
| Nelson Close | TQ9 6PG |
| Netherton Cottages | TQ9 6AG |
| Sherwell Close | TQ9 6PH |
| West Park | TQ9 6NY |
| Woodland Close | TQ9 6PQ |
| TQ9 6AD TQ9 6AH TQ9 6AJ TQ9 6AR TQ9 6AS TQ9 6AW TQ9 6FE TQ9 6NX TQ9 6NZ TQ9 6PA TQ9 6PE TQ9 6PF |
Transport near Eastmoor
- FAQ
- Price Paid By Year
- Property Type Price
Frequently asked questions about Eastmoor
What is the average price for a property for sale in Eastmoor?
The average price for a property for sale in Eastmoor is £657,063. This amount is 35% higher than the average price in Totnes. There are 179 property listings for sale in Eastmoor.
What streets have the most expensive properties for sale in Eastmoor?
The streets with the most expensive properties for sale in Eastmoor are Barkingdon Court at an average of £592,000, Eventide Cottages at an average of £521,000 and Sherwell Close at an average of £509,266.
What streets have the most affordable properties for sale in Eastmoor?
The streets with the most affordable properties for sale in Eastmoor are Moor Road at an average of £320,000 and Woodland Close at an average of £485,000.
Which train stations are available in or near Eastmoor?
Some of the train stations available in or near Eastmoor are Totnes, Newton Abbot and Paignton.
Property Price Paid in Eastmoor by Year
The average sold property price by year was:
| Year | Average Sold Price | Price Change |
Sold Properties
|
|---|---|---|---|
| 2025 | £531,142 | -33% |
7 Properties |
| 2024 | £708,833 | 1% |
6 Properties |
| 2023 | £700,973 | -71% |
13 Properties |
| 2022 | £1,197,518 | 61% |
3 Properties |
| 2021 | £472,200 | -4% |
10 Properties |
| 2020 | £492,000 | 34% |
10 Properties |
| 2019 | £322,500 | -27% |
7 Properties |
| 2018 | £410,500 | -9% |
5 Properties |
| 2017 | £448,450 | 18% |
8 Properties |
| 2016 | £369,000 | -79% |
3 Properties |
| 2015 | £662,214 | 37% |
7 Properties |
| 2014 | £414,842 | 2% |
13 Properties |
| 2013 | £404,687 | 13% |
8 Properties |
| 2012 | £352,892 | 12% |
7 Properties |
| 2011 | £309,111 | 0,1% |
9 Properties |
| 2010 | £308,750 | -28% |
2 Properties |
| 2009 | £395,000 | 7% |
1 Property |
| 2008 | £367,500 | -2% |
3 Properties |
| 2007 | £374,571 | -2% |
7 Properties |
| 2006 | £383,392 | 27% |
7 Properties |
| 2005 | £280,500 | -14% |
4 Properties |
| 2004 | £320,166 | 4% |
9 Properties |
| 2003 | £307,032 | 13% |
14 Properties |
| 2002 | £267,842 | 38% |
9 Properties |
| 2001 | £166,000 | -1% |
8 Properties |
| 2000 | £168,187 | 29% |
8 Properties |
| 1999 | £120,191 | 29% |
18 Properties |
| 1998 | £85,820 | -68% |
5 Properties |
| 1997 | £143,785 | 30% |
7 Properties |
| 1996 | £100,511 | 11% |
9 Properties |
| 1995 | £89,402 | - |
10 Properties |
Property Price per Property Type in Eastmoor
Here you can find historic sold price data in order to help with your property search.
The average Property Paid Price for specific property types in the last three years are:
| Property Type | Average Sold Price | Sold Properties |
|---|---|---|
| Semi Detached House | £521,125.00 | 8 Semi Detached Houses |
| Terraced House | £356,666.00 | 3 Terraced Houses |
| Detached House | £789,643.00 | 15 Detached Houses |

