
Houses for sale in South Brent, Totnes
House Prices in South Brent
Properties in South Brent have an average house price of £868k and had 3 Property Transactions within the last 3 years¹.
South Brent is an area in Totnes, Devon with 84 households², where the most expensive property was sold for £975k.
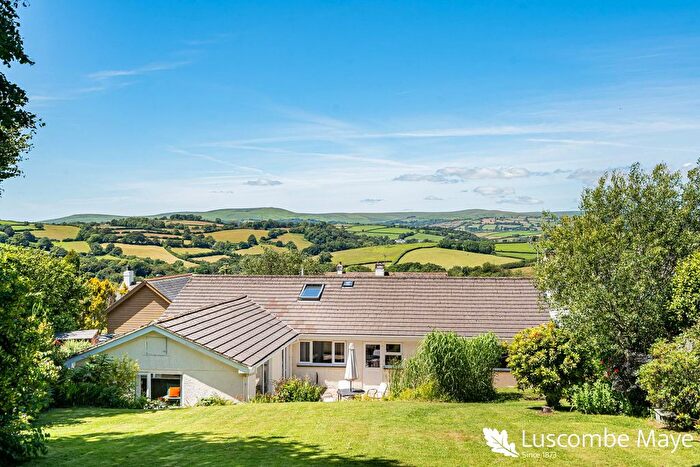
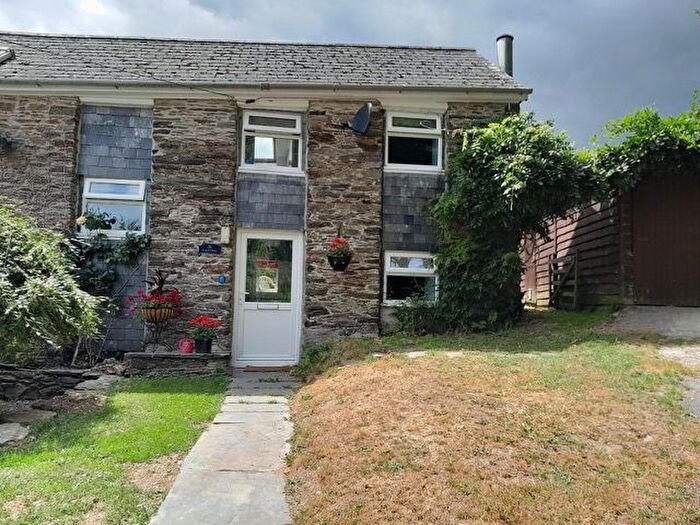
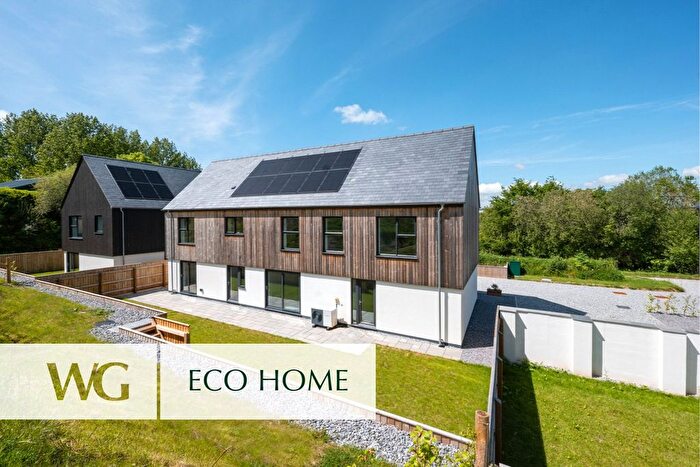
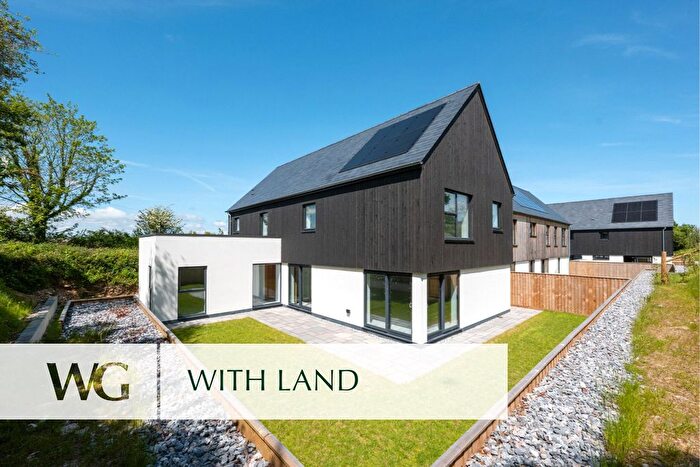
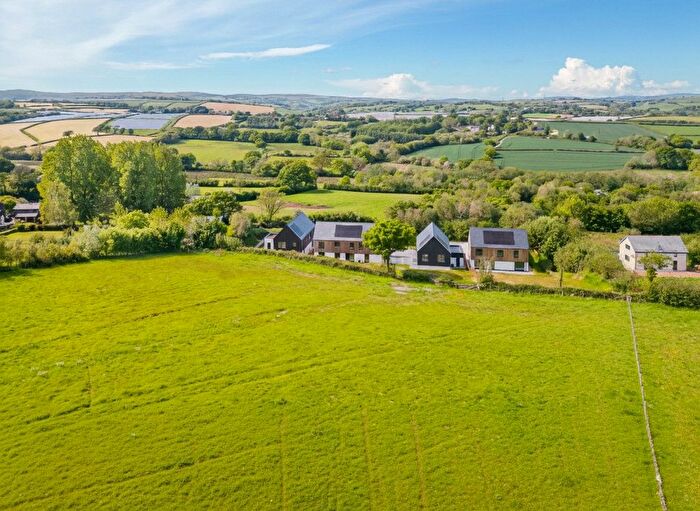
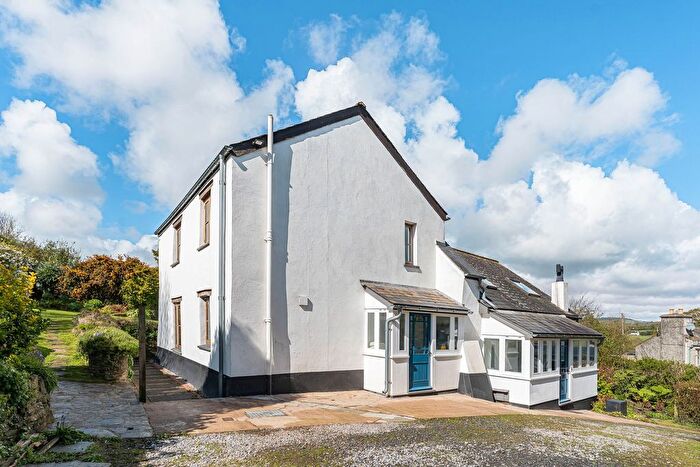
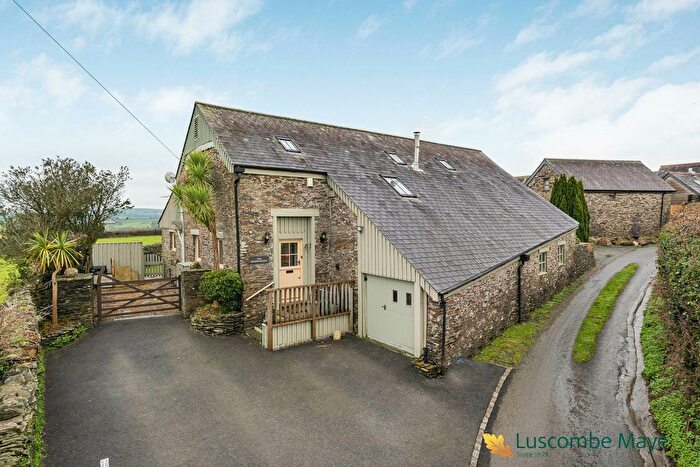
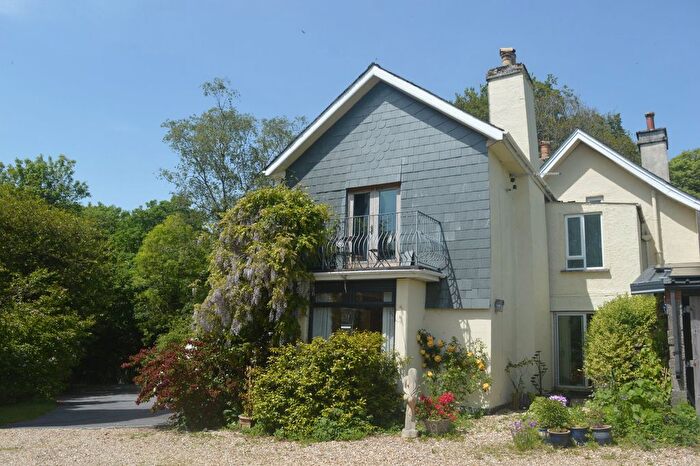
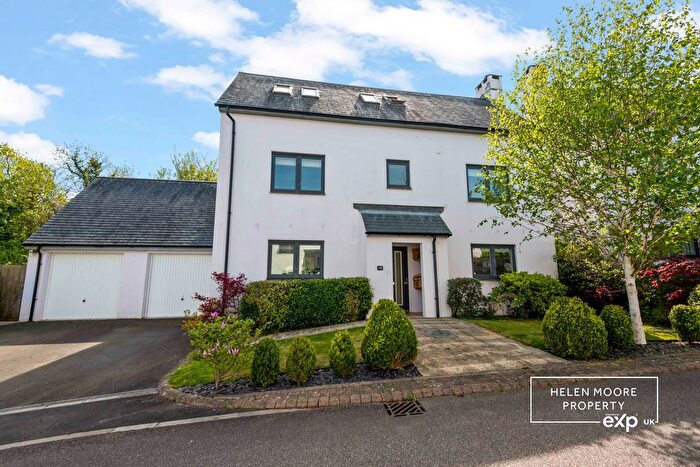
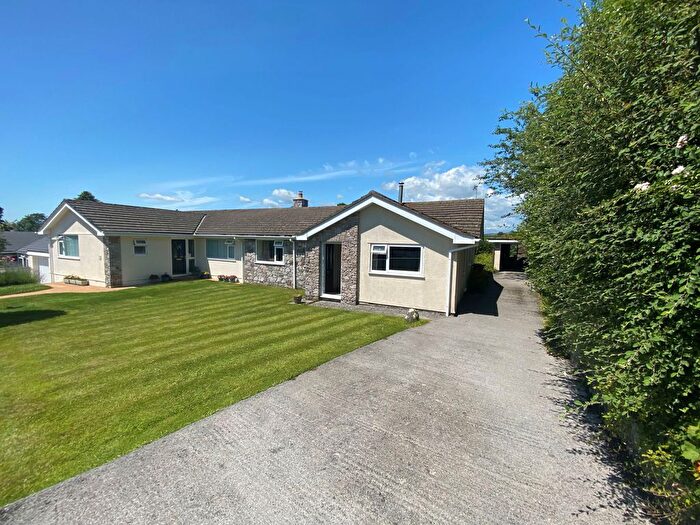
Properties for sale in South Brent
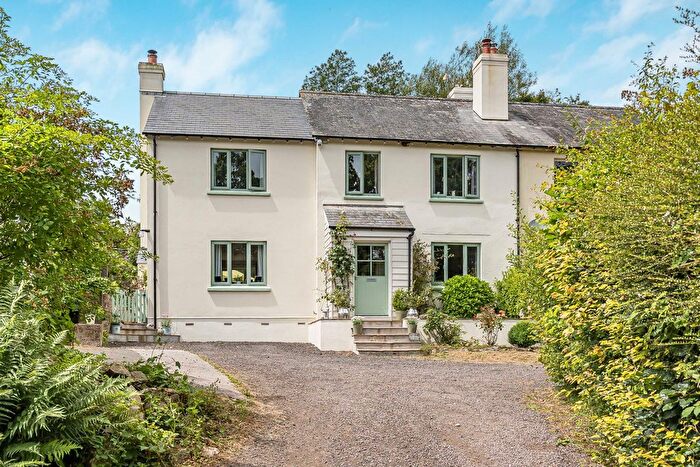
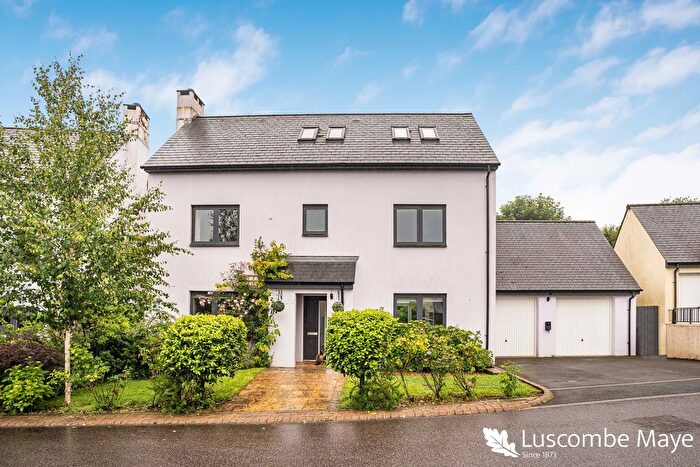
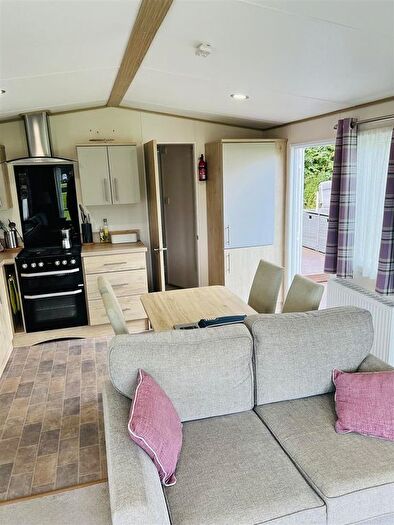
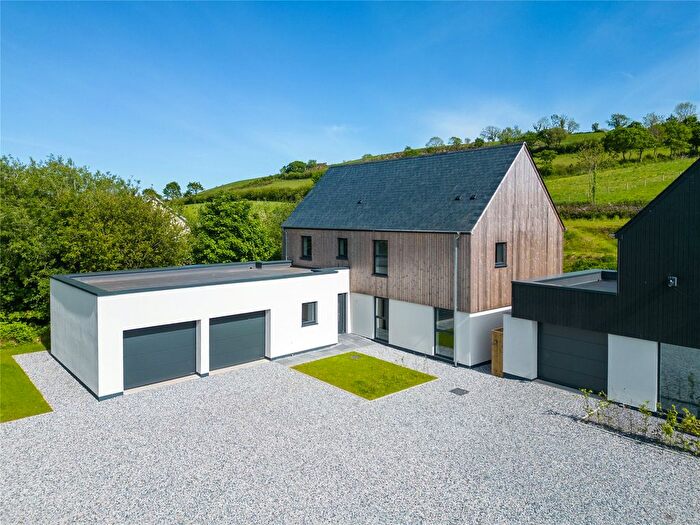
Previously listed properties in South Brent
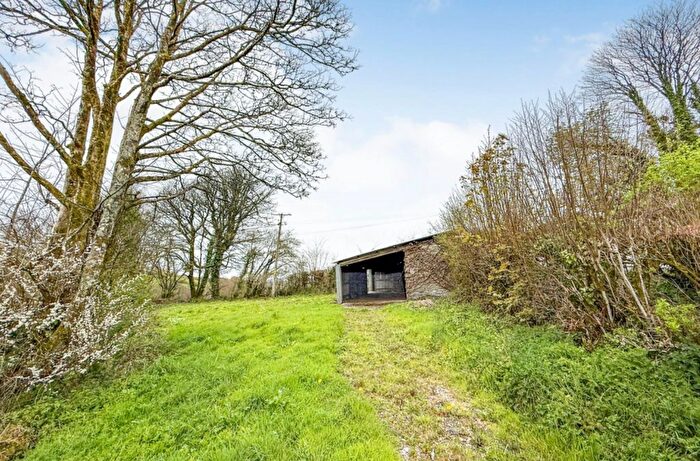
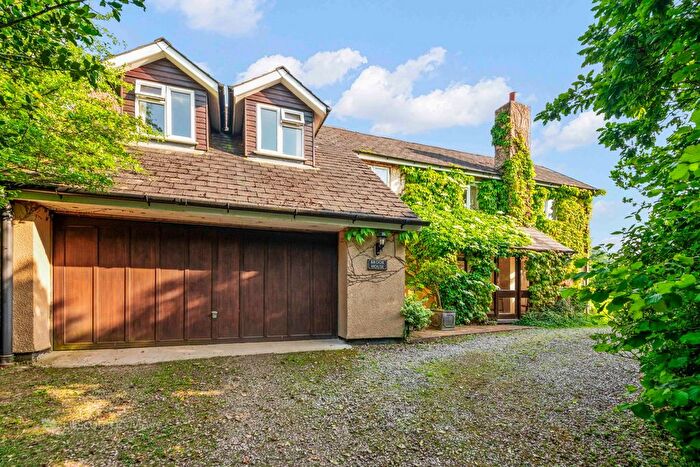
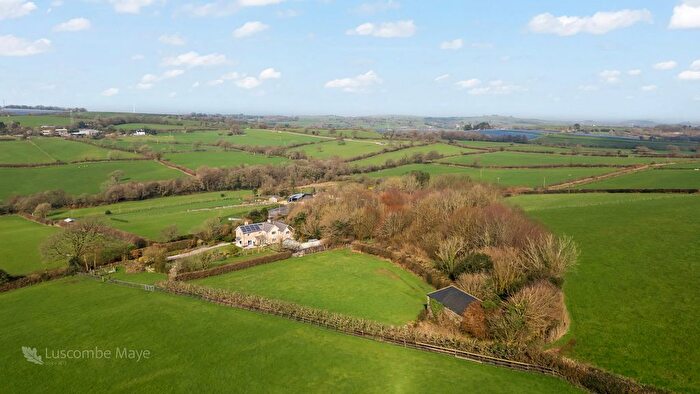
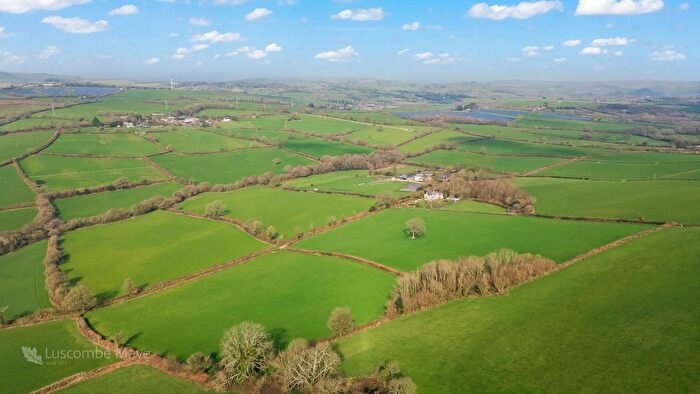
![]()
If you are looking to sell your house, let it out, or receive a property valuation, an expert can help you.
Click the button below to get started.

Roads and Postcodes in South Brent
Navigate through our locations to find the location of your next house in South Brent, Totnes for sale or to rent.
| Streets | Postcodes |
|---|---|
| Elwell Court | TQ9 7PG |
| TQ9 7NH TQ9 7JR TQ9 7JS TQ9 7JY TQ9 7JZ TQ9 7LS TQ9 7LU TQ9 7LZ TQ9 7NA TQ9 7NB TQ9 7ND TQ9 7NN TQ9 7NP TQ9 7PE TQ9 7PF |
Property price trends in South Brent
According to the latest Land Registry data, the average home in South Brent sold for £815,000 in 2025. That figure comes from 18 sales logged over the past 28 years.
Prices have continued to climb over the last three years. Compared with 2022, when the typical sale came in around £718,750, that's a rise of roughly 13.4%.
Looking back five years, average prices are up about 84% since 2020, a gain of around £372,000 in cash terms.
Zoom out to the past decade for the fuller picture. Back in 2015, homes here averaged £1,200,000, so the typical sold price has fallen about 32.1% since then, around 3.8% a year lower.
Frequently asked questions about South Brent
What is the average price for a property for sale in South Brent?
The average price for a property for sale in South Brent is £868,333. This amount is 80% higher than the average price in Totnes. There are 105 property listings for sale in South Brent.
Which train stations are available in or near South Brent?
Some of the train stations available in or near South Brent are Totnes, Ivybridge and Paignton.
Property Price Paid in South Brent by Year
The average sold property price by year was:
| Year | Average Sold Price | Price Change |
Sold Properties
|
|---|---|---|---|
| 2025 | £815,000 | -20% |
2 Properties |
| 2024 | £975,000 | 26% |
1 Property |
| 2022 | £718,750 | 33% |
2 Properties |
| 2021 | £482,500 | 8% |
1 Property |
| 2020 | £443,000 | -92% |
2 Properties |
| 2017 | £850,000 | 59% |
1 Property |
| 2016 | £350,000 | -243% |
1 Property |
| 2015 | £1,200,000 | 66% |
1 Property |
| 2014 | £410,500 | 10% |
2 Properties |
| 2006 | £368,000 | 12% |
1 Property |
Property Price per Property Type in South Brent
Here you can find historic sold price data in order to help with your property search.
The average Property Paid Price for specific property types in the last three years are:
| Property Type | Average Sold Price | Sold Properties |
|---|---|---|
| Detached House | £868,333.00 | 3 Detached Houses |
