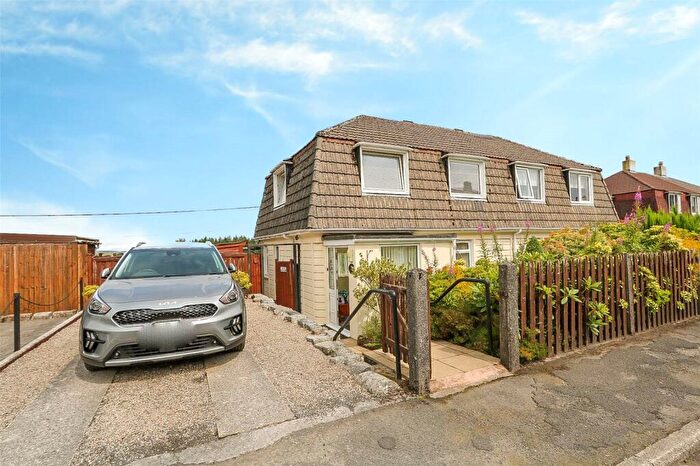
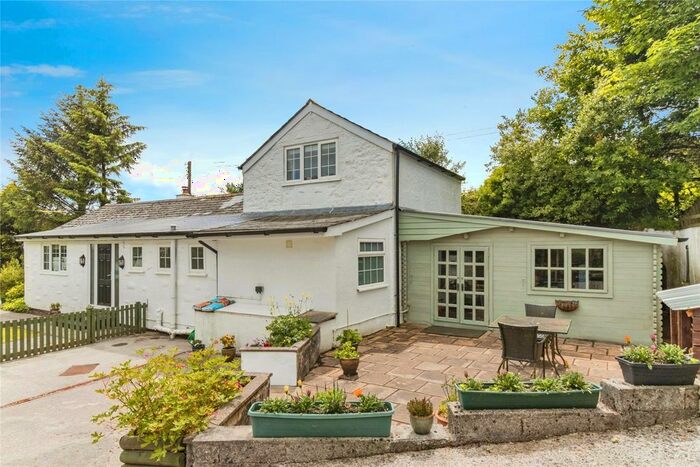
Houses for sale & to rent in Lydford, Yelverton
House Prices in Lydford
Properties in Lydford have an average house price of £295,889.00 and had 32 Property Transactions within the last 3 years¹.
Lydford is an area in Yelverton, Devon with 416 households², where the most expensive property was sold for £800,000.00.
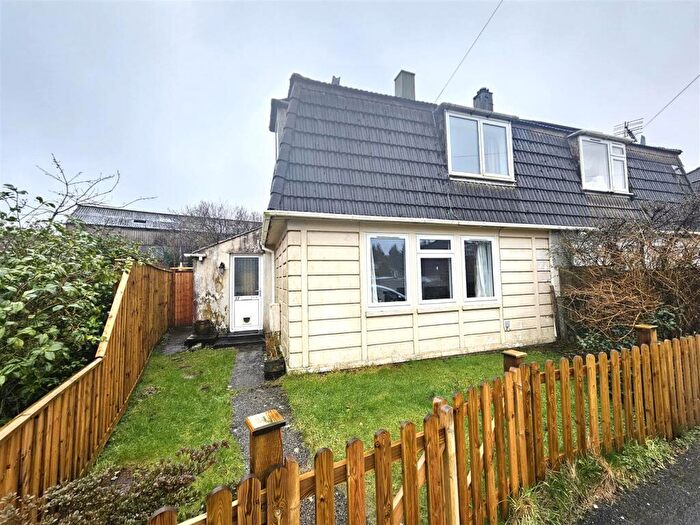
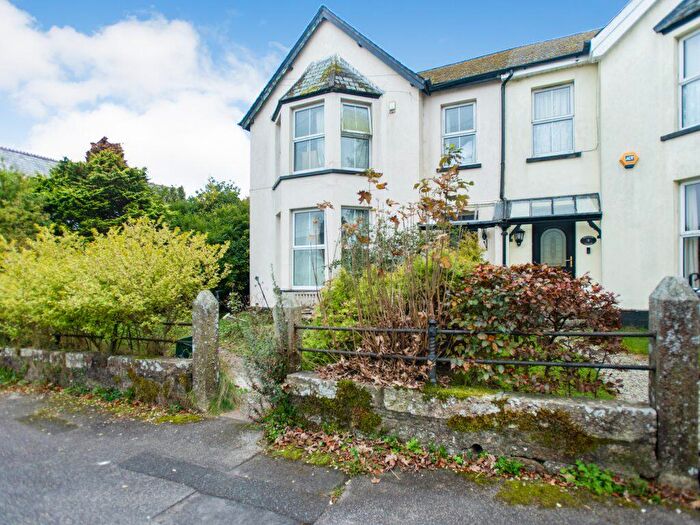
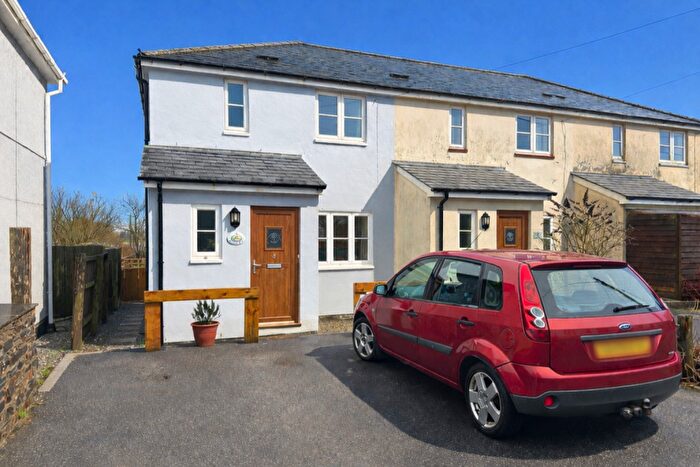
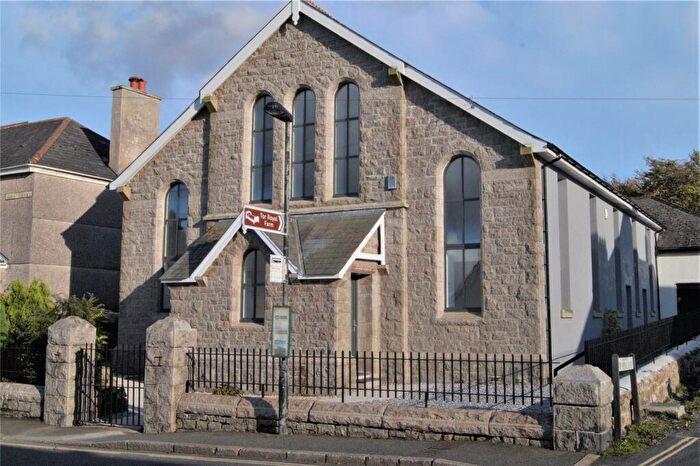
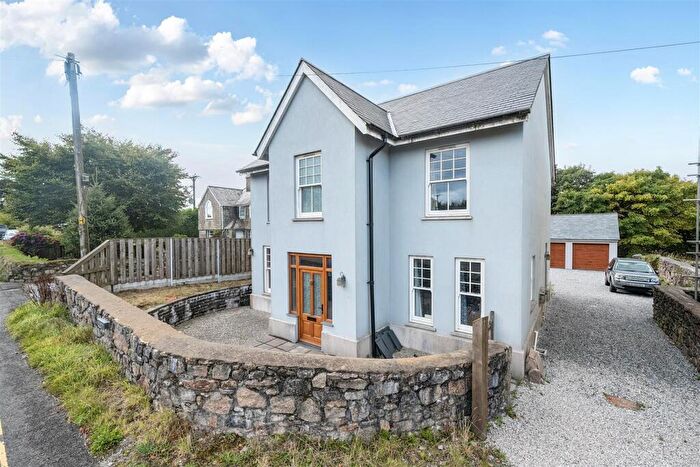
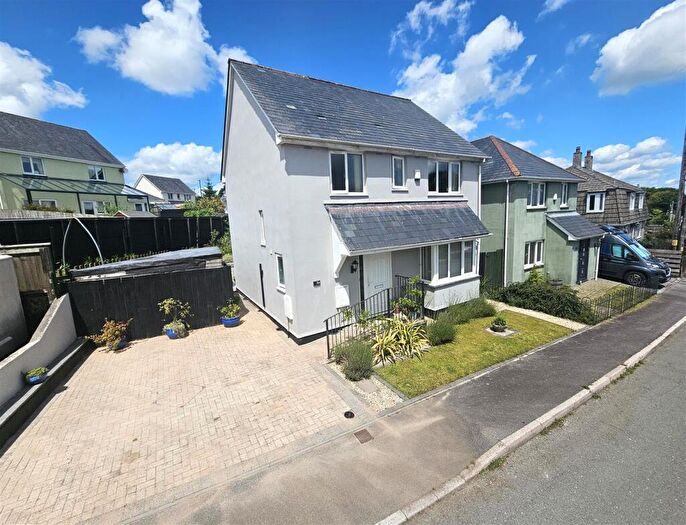
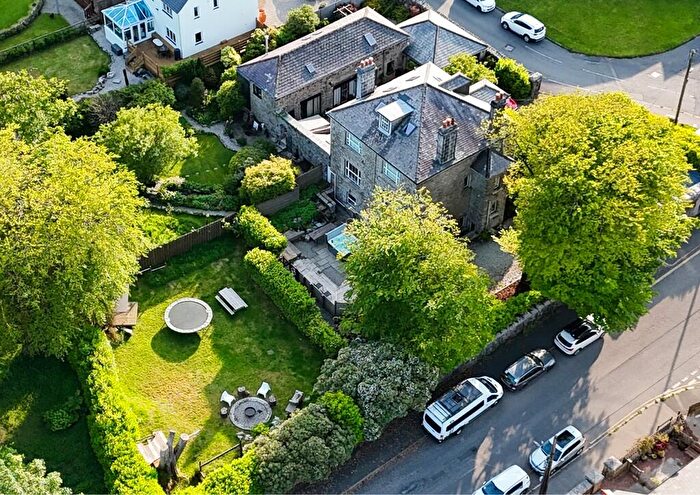
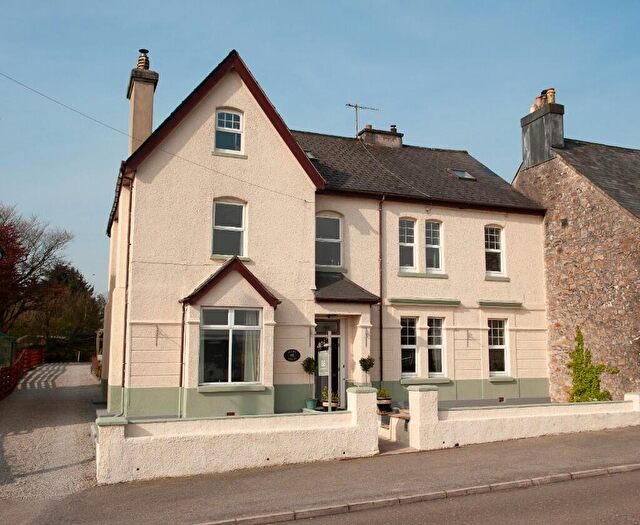
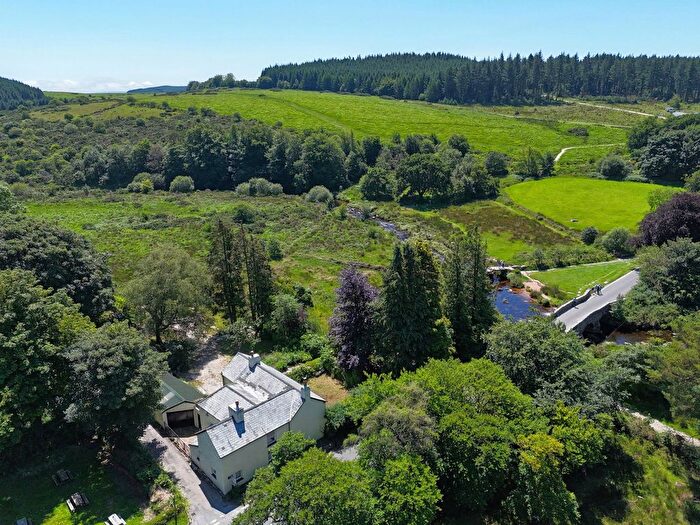
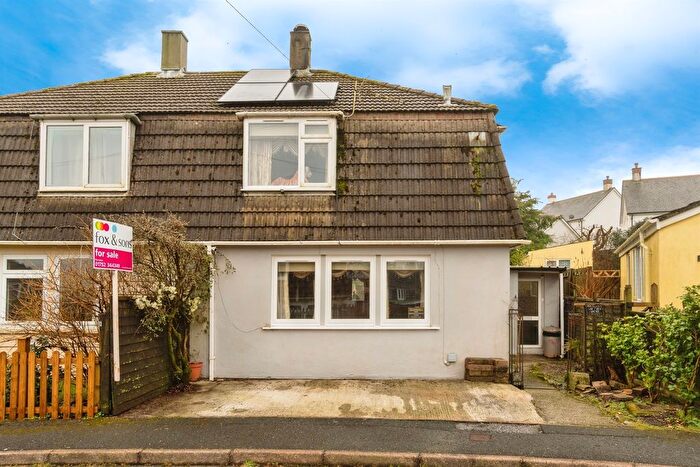
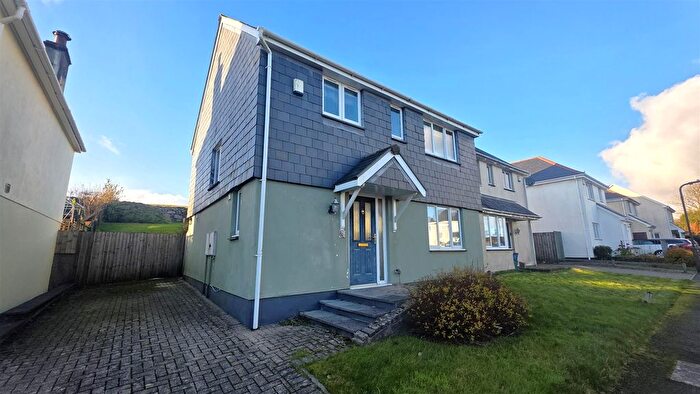
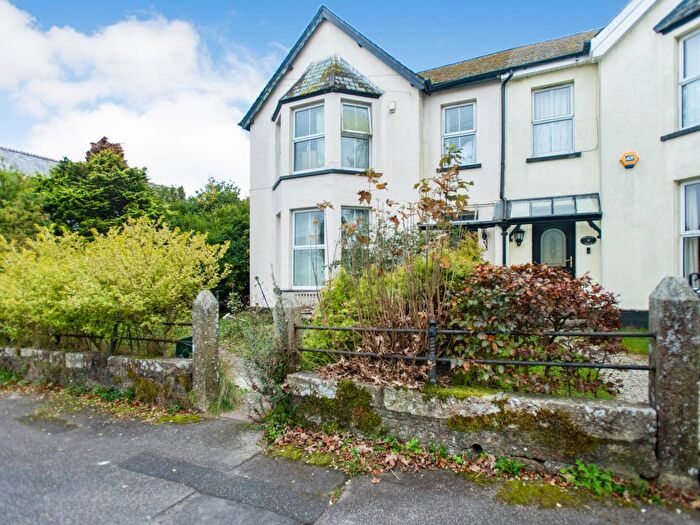
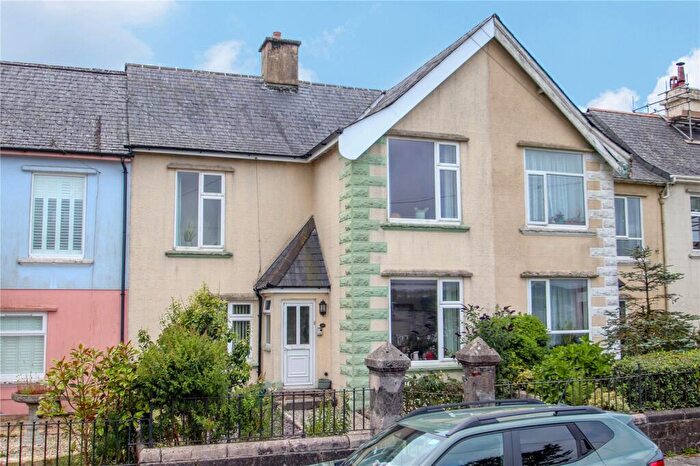
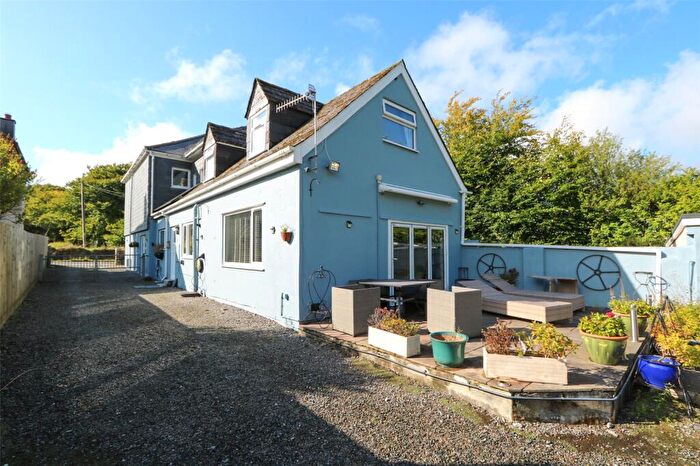
Properties for sale in Lydford
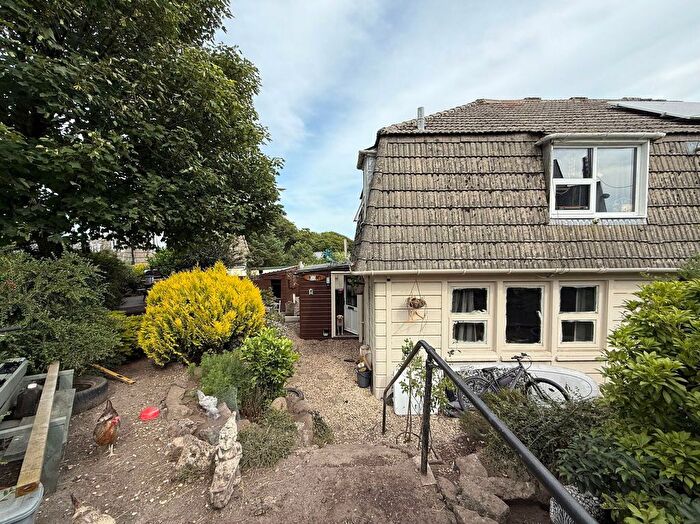
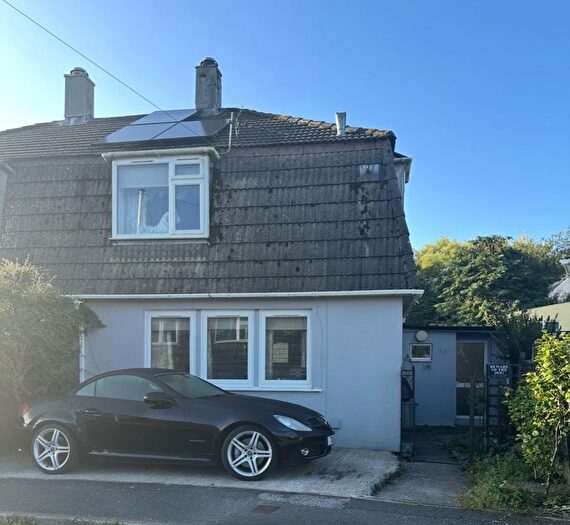
Previously listed properties in Lydford
Roads and Postcodes in Lydford
Navigate through our locations to find the location of your next house in Lydford, Yelverton for sale or to rent.
| Streets | Postcodes |
|---|---|
| Albert Terrace | PL20 6QP |
| Babbs Cottages | PL20 6QJ |
| Beech Crescent | PL20 6FD |
| Bellever | PL20 6TU |
| Bellever Close | PL20 6RT |
| Blackabrook Avenue | PL20 6RH |
| Burrator Avenue | PL20 6RJ |
| Dartmeet | PL20 6SG |
| Devonshire Row | PL20 6QD |
| Duchy Cottages | PL20 6QN |
| Fern Terrace | PL20 6RS |
| Forestry Houses | PL20 6TP PL20 6TW |
| Hessary View | PL20 6RA |
| Hexworthy | PL20 6SD |
| Meavy View | PL20 6RU |
| Moor Crescent | PL20 6RF |
| Moorland View | PL20 6QZ |
| New London | PL20 6QU |
| New Villas | PL20 6RW |
| Oakery Crescent | PL20 6QR |
| Plymouth Hill | PL20 6QG PL20 6QL |
| Postbridge | PL20 6SY PL20 6SZ PL20 6TH PL20 6TJ PL20 6TL PL20 6TR PL20 6TT |
| Squires Cottages | PL20 6QW |
| Station Cottages | PL20 6QY |
| Station Road | PL20 6QX |
| Stoneycliffe Place | PL20 6FG |
| Tavistock Road | PL20 6RE PL20 6RP |
| The Lodge | PL20 6QH |
| Tor View | PL20 6RN |
| Two Bridges Road | PL20 6QS |
| Woodville Avenue | PL20 6RL |
| PL20 6SA PL20 6SF PL20 6SL PL20 6SN PL20 6SR PL20 6SS PL20 6SW |
Transport near Lydford
-
Bere Alston Station
-
Calstock Station
-
Ivybridge Station
-
Gunnislake Station
-
Bere Ferrers Station
-
Okehampton Station
-
St.Budeaux Victoria Road Station
-
St.Budeaux Ferry Road Station
-
Plymouth Station
-
Totnes Station
- FAQ
- Price Paid By Year
- Property Type Price
Frequently asked questions about Lydford
What is the average price for a property for sale in Lydford?
The average price for a property for sale in Lydford is £295,889. This amount is 19% lower than the average price in Yelverton. There are 94 property listings for sale in Lydford.
What streets have the most expensive properties for sale in Lydford?
The streets with the most expensive properties for sale in Lydford are Meavy View at an average of £515,000, Tavistock Road at an average of £413,125 and Two Bridges Road at an average of £358,000.
What streets have the most affordable properties for sale in Lydford?
The streets with the most affordable properties for sale in Lydford are Blackabrook Avenue at an average of £171,862, Burrator Avenue at an average of £175,000 and Stoneycliffe Place at an average of £200,000.
Which train stations are available in or near Lydford?
Some of the train stations available in or near Lydford are Bere Alston, Calstock and Ivybridge.
Property Price Paid in Lydford by Year
The average sold property price by year was:
| Year | Average Sold Price | Price Change |
Sold Properties
|
|---|---|---|---|
| 2025 | £265,825 | -13% |
6 Properties |
| 2024 | £301,571 | -1% |
14 Properties |
| 2023 | £304,291 | 10% |
12 Properties |
| 2022 | £274,708 | 2% |
12 Properties |
| 2021 | £269,782 | 10% |
16 Properties |
| 2020 | £242,308 | 7% |
12 Properties |
| 2019 | £226,313 | 6% |
30 Properties |
| 2018 | £212,731 | 1% |
24 Properties |
| 2017 | £211,116 | 6% |
30 Properties |
| 2016 | £198,197 | -14% |
22 Properties |
| 2015 | £226,398 | 18% |
25 Properties |
| 2014 | £186,522 | 14% |
29 Properties |
| 2013 | £159,534 | 0,2% |
23 Properties |
| 2012 | £159,145 | -70% |
20 Properties |
| 2011 | £270,103 | 39% |
14 Properties |
| 2010 | £164,327 | 15% |
11 Properties |
| 2009 | £140,153 | -32% |
13 Properties |
| 2008 | £184,367 | 6% |
20 Properties |
| 2007 | £173,015 | -5% |
47 Properties |
| 2006 | £181,540 | -10% |
42 Properties |
| 2005 | £200,216 | 33% |
24 Properties |
| 2004 | £135,032 | -54% |
14 Properties |
| 2003 | £207,811 | 49% |
13 Properties |
| 2002 | £105,623 | 28% |
24 Properties |
| 2001 | £76,103 | 6% |
15 Properties |
| 2000 | £71,717 | -8% |
17 Properties |
| 1999 | £77,307 | 22% |
13 Properties |
| 1998 | £59,991 | 9% |
12 Properties |
| 1997 | £54,858 | 11% |
13 Properties |
| 1996 | £48,848 | -35% |
14 Properties |
| 1995 | £66,000 | - |
11 Properties |
Property Price per Property Type in Lydford
Here you can find historic sold price data in order to help with your property search.
The average Property Paid Price for specific property types in the last three years are:
| Property Type | Average Sold Price | Sold Properties |
|---|---|---|
| Semi Detached House | £253,964.00 | 14 Semi Detached Houses |
| Detached House | £502,857.00 | 7 Detached Houses |
| Terraced House | £217,540.00 | 11 Terraced Houses |

