
Houses for sale in Walkham, Tavistock
House Prices in Walkham
Properties in Walkham have an average house price of £743k and had 7 Property Transactions within the last 3 years¹.
Walkham is an area in Tavistock, Devon with 145 households², where the most expensive property was sold for £1.13M.
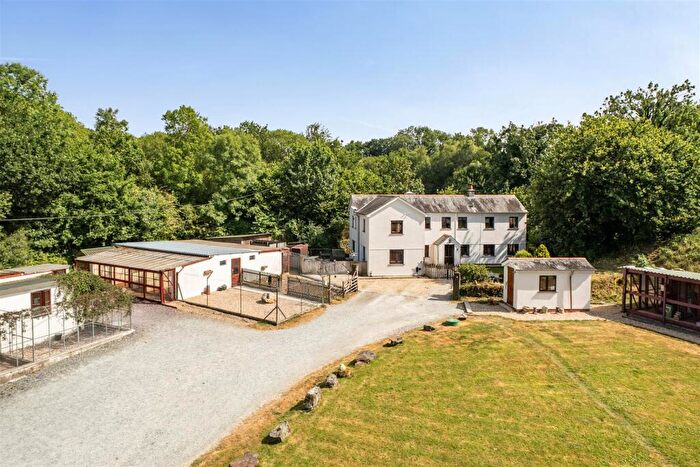
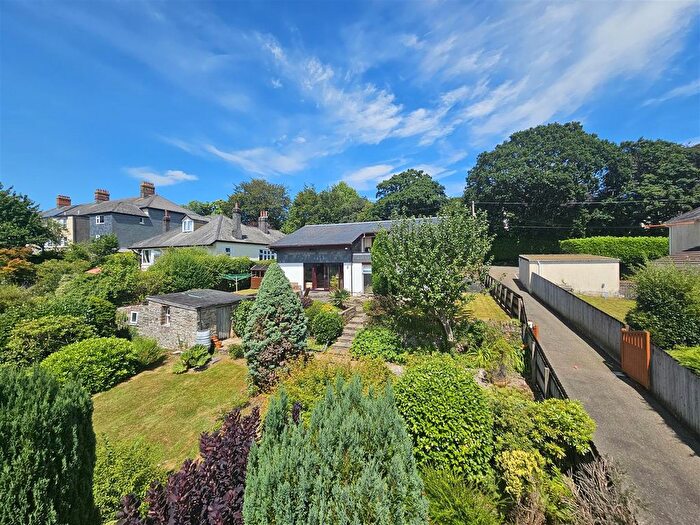
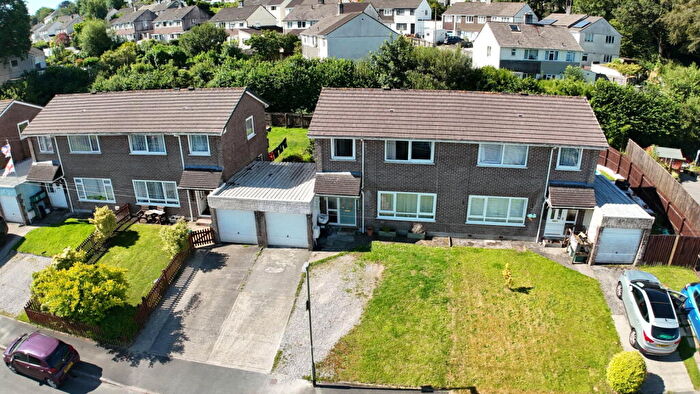
Properties for sale in Walkham
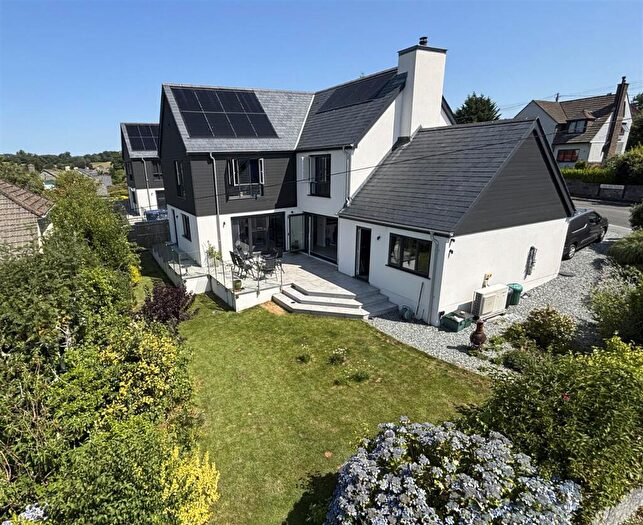
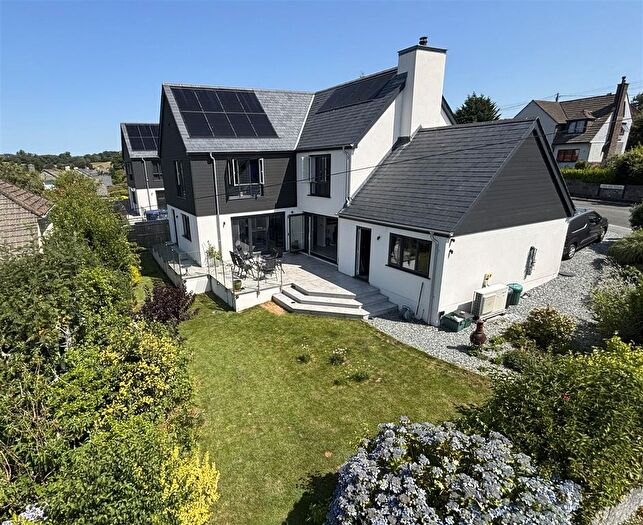

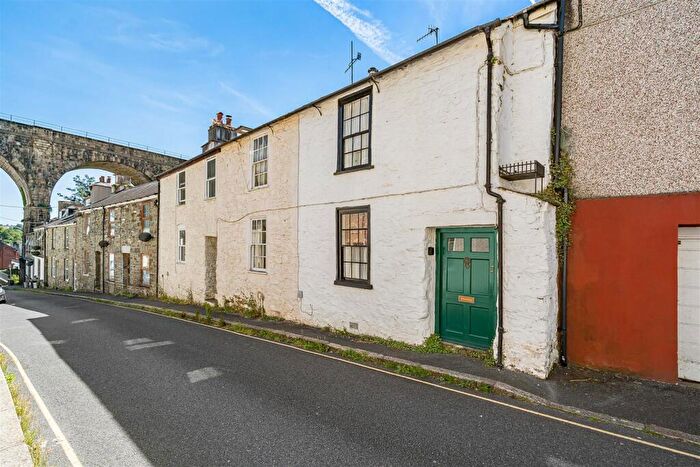
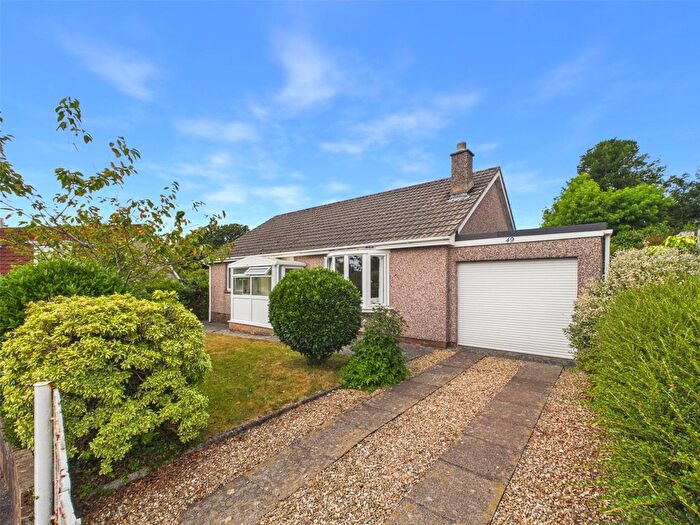
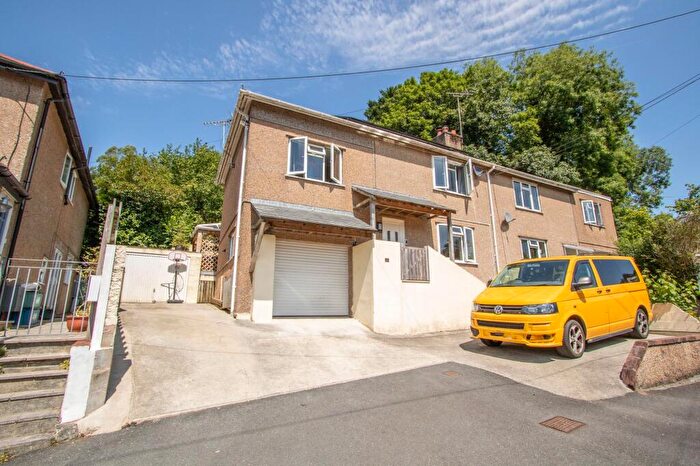
![]()
If you are looking to sell your house, let it out, or receive a property valuation, an expert can help you.
Click the button below to get started.
Roads and Postcodes in Walkham
Navigate through our locations to find the location of your next house in Walkham, Tavistock for sale or to rent.
| Streets | Postcodes |
|---|---|
| Branson Park | PL19 9EN |
| Grenofen Close | PL19 9NE |
| Higher Woodtown | PL19 9EH |
| Rix Hill | PL19 9EB |
| PL19 9EP PL19 9EQ PL19 9ER PL19 9ES PL19 9EW PL19 9JU PL19 9JX PL19 9JZ PL19 9LB PL19 9LE |
Property price trends in Walkham
According to the latest Land Registry data, the average home in Walkham sold for £855,000 in 2025. That figure comes from 139 sales logged over the past 30 years.
Prices have continued to climb over the last three years. Compared with 2022, when the typical sale came in around £465,000, that's a rise of roughly 83.9%.
Looking back five years, average prices are up about 109.8% since 2020, a gain of around £447,400 in cash terms.
Zoom out to the past decade for the fuller picture. Back in 2015, homes here averaged £410,250, so the typical sold price has climbed about 108.4% since then, roughly 7.6% a year. Stretch the view to fifteen years and that annual pace eases back to about 7.4%.
Frequently asked questions about Walkham
What is the average price for a property for sale in Walkham?
The average price for a property for sale in Walkham is £742,857. This amount is 121% higher than the average price in Tavistock. There are 1,683 property listings for sale in Walkham.
Which train stations are available in or near Walkham?
Some of the train stations available in or near Walkham are Gunnislake, Calstock and Bere Alston.
Property Price Paid in Walkham by Year
The average sold property price by year was:
| Year | Average Sold Price | Price Change |
Sold Properties
|
|---|---|---|---|
| 2025 | £855,000 | 30% |
2 Properties |
| 2024 | £597,500 | -28% |
2 Properties |
| 2023 | £765,000 | 39% |
3 Properties |
| 2022 | £465,000 | -40% |
4 Properties |
| 2021 | £653,219 | 38% |
5 Properties |
| 2020 | £407,600 | -41% |
4 Properties |
| 2019 | £573,200 | 20% |
2 Properties |
| 2018 | £458,050 | 1% |
5 Properties |
| 2017 | £453,750 | 25% |
2 Properties |
| 2016 | £341,300 | -20% |
7 Properties |
Property Price per Property Type in Walkham
Here you can find historic sold price data in order to help with your property search.
The average Property Paid Price for specific property types in the last three years are:
| Property Type | Average Sold Price | Sold Properties |
|---|---|---|
| Flat | £387,500.00 | 2 Flats |
| Detached House | £885,000.00 | 5 Detached Houses |
