Houses for sale & to rent in Walkham, Yelverton
House Prices in Walkham
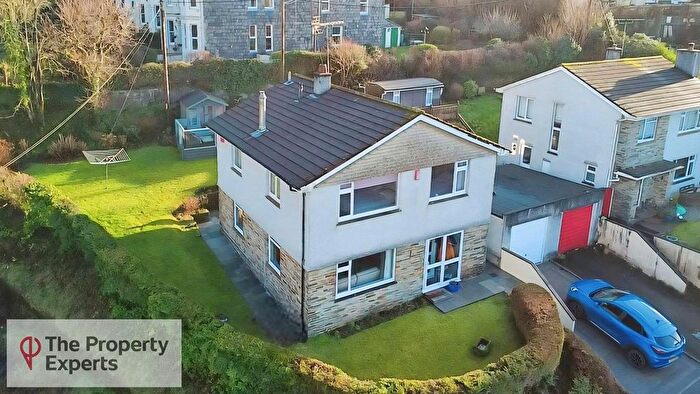
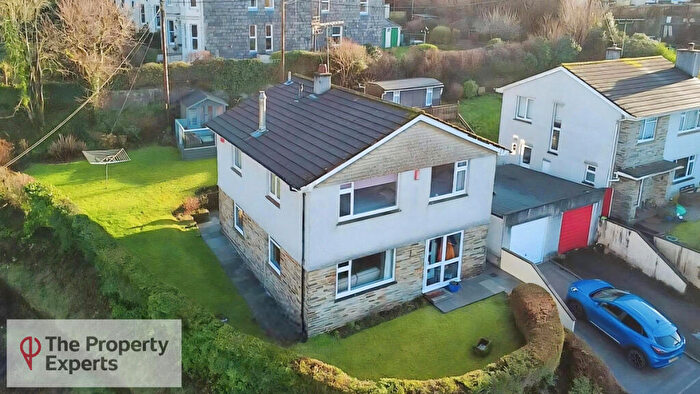
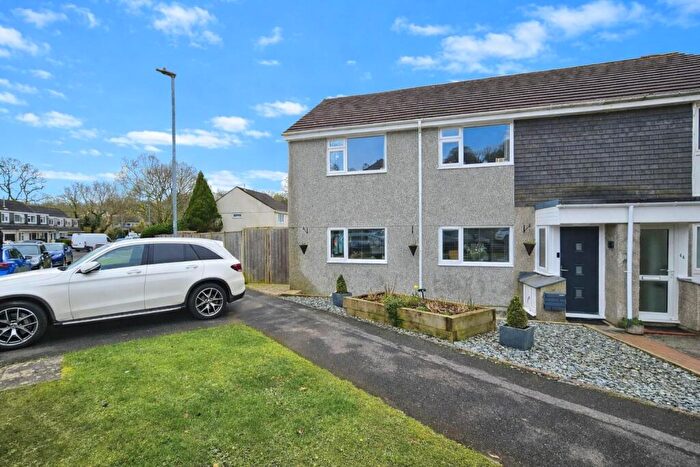
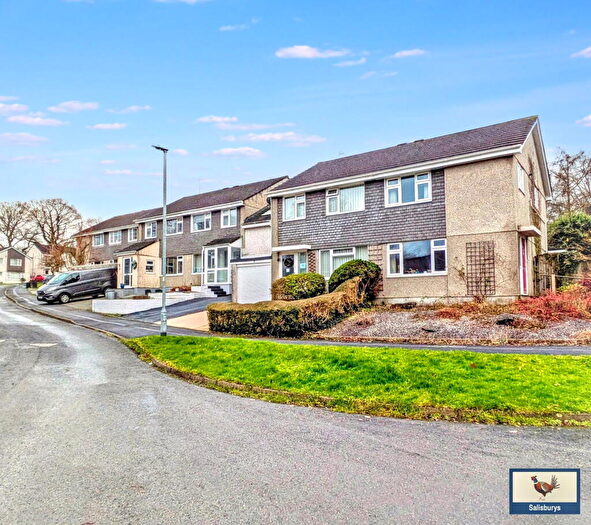
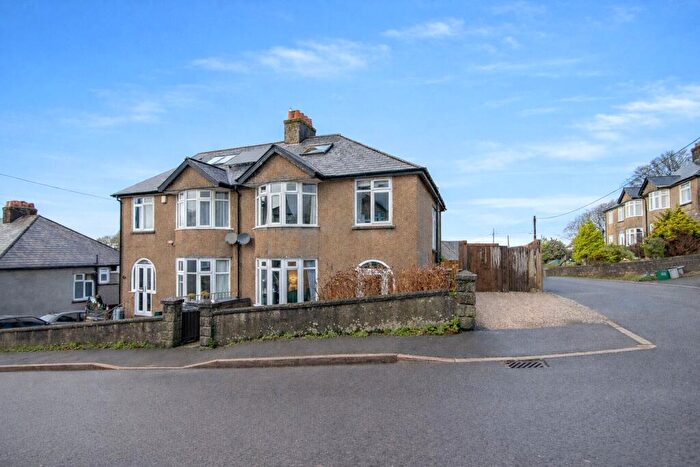
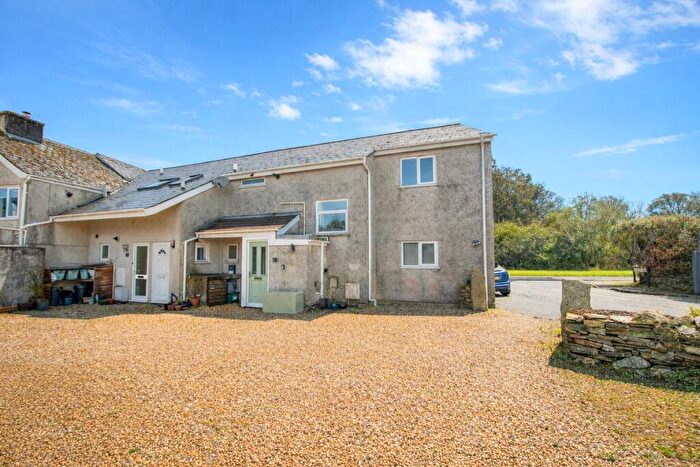
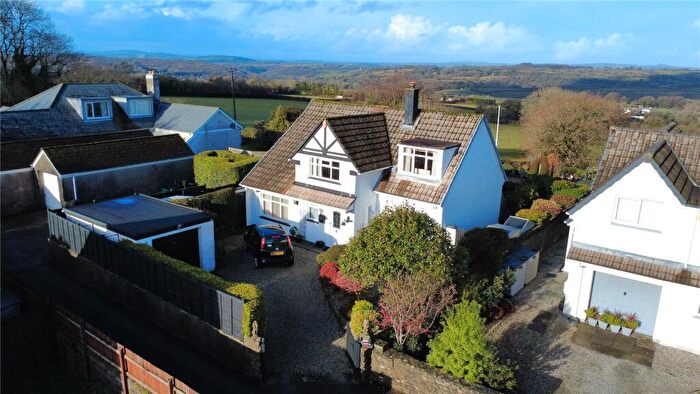
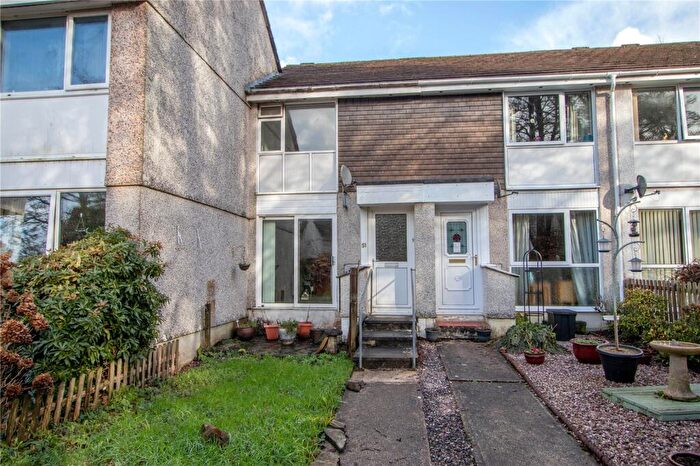
Properties in Walkham have an average house price of £350,047.00 and had 87 Property Transactions within the last 3 years¹.
Walkham is an area in Yelverton, Devon with 1,098 households², where the most expensive property was sold for £1,260,450.00.
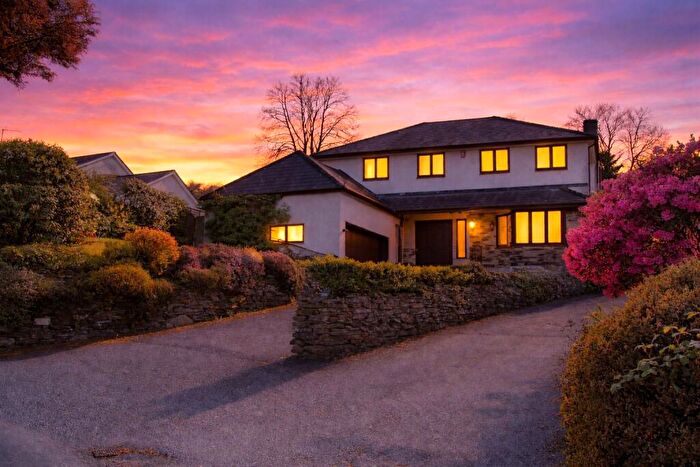
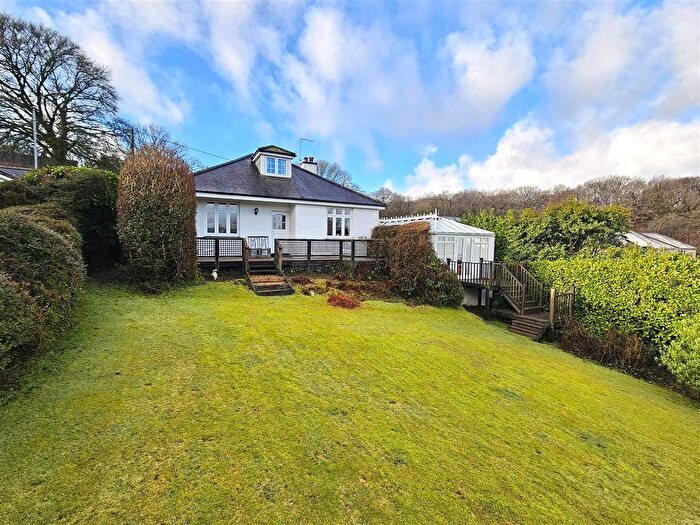
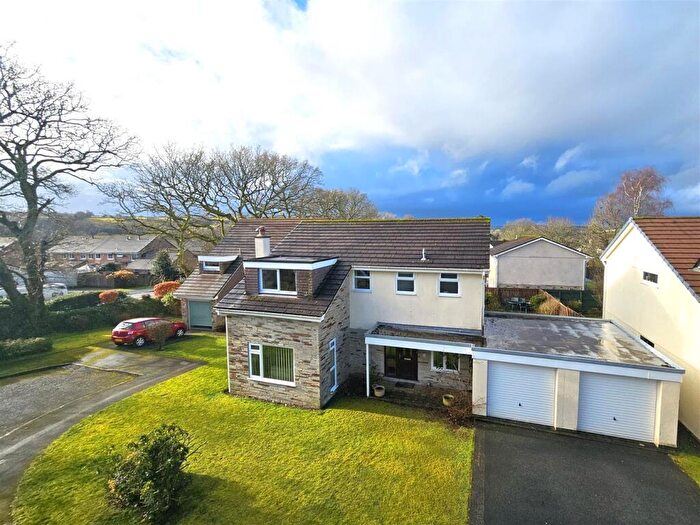
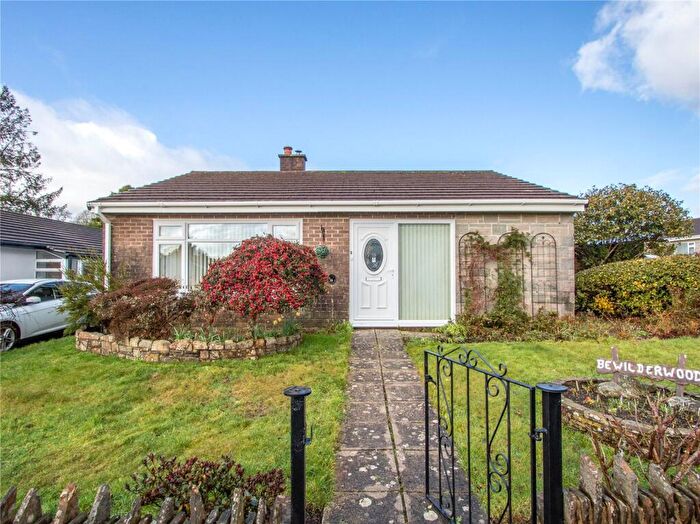
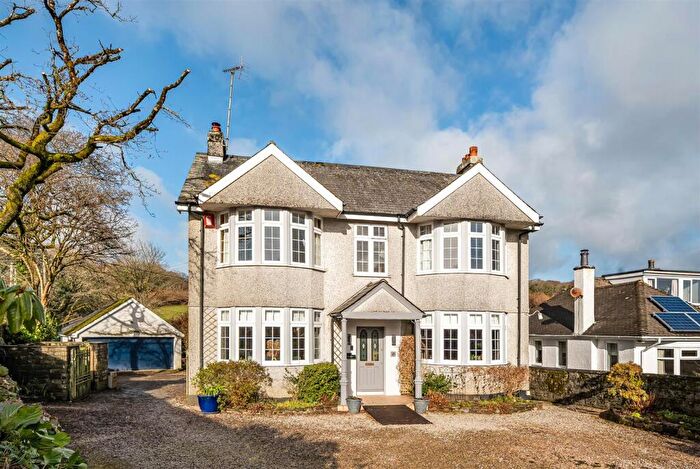
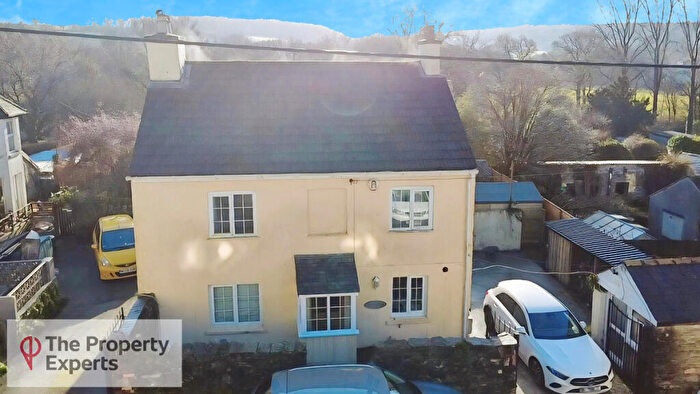
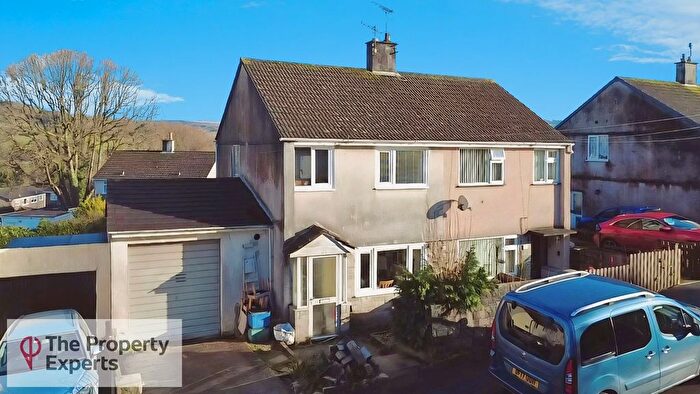
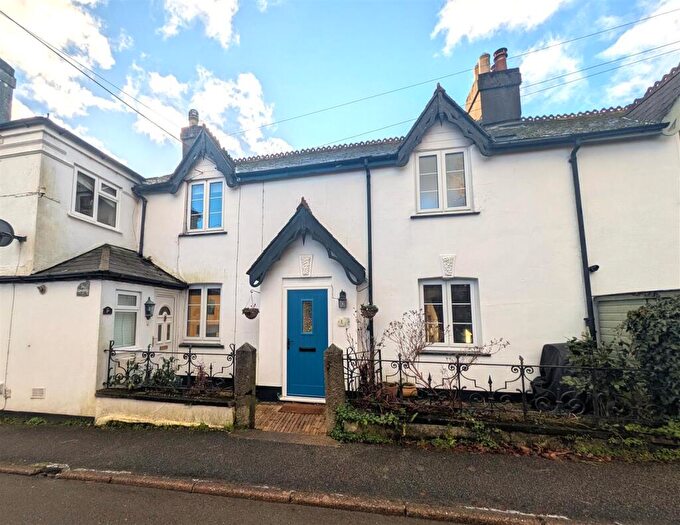
Properties for sale in Walkham
Roads and Postcodes in Walkham
Navigate through our locations to find the location of your next house in Walkham, Yelverton for sale or to rent.
| Streets | Postcodes |
|---|---|
| Ash Close | PL20 6HT |
| Bedford Bridge | PL20 7RZ |
| Bedford Place | PL20 7QD |
| Bedford Road | PL20 7QH PL20 7QJ PL20 7QL PL20 7QW |
| Brook Terrace | PL20 7QU |
| California Cottages | PL20 7QG |
| Caradon Court | PL20 7SH |
| Chapel Close | PL20 7SL |
| Chapel Lane | PL20 7SP |
| Chichester Court | PL20 7SQ |
| Church Park | PL20 7UD |
| Clonway | PL20 6EG |
| Commercial Road | PL20 7QB |
| Copperfields | PL20 7UB |
| Cox Tor Close | PL20 6BH |
| Dostabrook Cottages | PL20 7TH |
| Fillace Lane | PL20 7TG |
| Fillace Park | PL20 7TB PL20 7TD PL20 7TE |
| Grange Road | PL20 6BJ |
| Graybridge Road | PL20 7SE |
| Great Mis Tor Close | PL20 6DH |
| Greenway Close | PL20 7SW |
| Harrowbeer Lane | PL20 6DZ PL20 6EA |
| Horrabridge | PL20 7QE PL20 7QT PL20 7RU PL20 7RW PL20 7TA PL20 7UA |
| Ingra Tor | PL20 6HS |
| Jordan Lane | PL20 7QQ PL20 7QY |
| Knighton Terrace | PL20 7TS |
| Langton Road | PL20 6DG |
| Leather Tor Close | PL20 6EQ |
| Manor Estate | PL20 7RS PL20 7RT |
| Manor Gardens | PL20 7UQ |
| Moorland View | PL20 6ST |
| New Park | PL20 7TF |
| North Road | PL20 6EE |
| Old Station Road | PL20 7RA |
| Pencreber Road | PL20 7SF PL20 7SG |
| Phoenix Close | PL20 7SY |
| Plymouth Road | PL20 7RL PL20 7RR |
| Riverside Close | PL20 7SR |
| Sampford Gardens | PL20 7QZ |
| Sampford Terrace | PL20 7QR |
| Sortridge Park | PL20 7UF |
| South View | PL20 7SU |
| Springfield | PL20 7QS |
| Sprys Tenements | PL20 7TW |
| St Johns Road | PL20 7SX |
| Station Road | PL20 7RD PL20 7RF PL20 7SS PL20 7ST |
| Tavistock Road | PL20 6EB PL20 6ED PL20 6EF |
| The Green | PL20 7QP |
| The Old Station | PL20 7RQ |
| Tor View | PL20 7RE PL20 7RG |
| Torbridge Road | PL20 7SD |
| Town Farm Close | PL20 7SJ |
| Vixen Tor Close | PL20 6EJ |
| Walkham Cottages | PL20 7TN |
| Walkham Meadows | PL20 7UG |
| Walkham Terrace | PL20 7TR |
| Walkham View | PL20 7TL |
| Walkhampton Road | PL20 7SZ |
| West Park Villas | PL20 7TY |
| Whitchurch Road | PL20 7TJ PL20 7TP PL20 7TT PL20 7TX PL20 7TZ |
| Youldon Way | PL20 7SN |
| PL20 6LD PL20 6LE PL20 6LF PL20 6LG PL20 6LH PL20 6LP PL20 7QX |
Transport near Walkham
-
Bere Alston Station
-
Calstock Station
-
Gunnislake Station
-
Bere Ferrers Station
-
St.Budeaux Victoria Road Station
-
St.Budeaux Ferry Road Station
-
Saltash Station
-
Keyham Station
-
Plymouth Station
-
Dockyard Station
- FAQ
- Price Paid By Year
- Property Type Price
Frequently asked questions about Walkham
What is the average price for a property for sale in Walkham?
The average price for a property for sale in Walkham is £350,047. This amount is 4% lower than the average price in Yelverton. There are 1,146 property listings for sale in Walkham.
What streets have the most expensive properties for sale in Walkham?
The streets with the most expensive properties for sale in Walkham are Moorland View at an average of £710,000, Whitchurch Road at an average of £660,000 and The Old Station at an average of £592,400.
What streets have the most affordable properties for sale in Walkham?
The streets with the most affordable properties for sale in Walkham are Dostabrook Cottages at an average of £137,900, The Green at an average of £160,316 and St Johns Road at an average of £180,000.
Which train stations are available in or near Walkham?
Some of the train stations available in or near Walkham are Bere Alston, Calstock and Gunnislake.
Property Price Paid in Walkham by Year
The average sold property price by year was:
| Year | Average Sold Price | Price Change |
Sold Properties
|
|---|---|---|---|
| 2025 | £366,470 | 14% |
25 Properties |
| 2024 | £315,951 | -18% |
32 Properties |
| 2023 | £372,730 | 11% |
30 Properties |
| 2022 | £331,223 | 1% |
38 Properties |
| 2021 | £327,514 | 4% |
38 Properties |
| 2020 | £315,763 | 4% |
38 Properties |
| 2019 | £304,013 | 4% |
29 Properties |
| 2018 | £291,369 | -4% |
39 Properties |
| 2017 | £302,005 | 17% |
39 Properties |
| 2016 | £249,858 | 2% |
37 Properties |
| 2015 | £244,493 | -19% |
36 Properties |
| 2014 | £292,054 | 16% |
38 Properties |
| 2013 | £246,051 | -7% |
29 Properties |
| 2012 | £263,724 | 10% |
31 Properties |
| 2011 | £236,846 | -6% |
42 Properties |
| 2010 | £252,125 | 12% |
33 Properties |
| 2009 | £220,854 | -7% |
51 Properties |
| 2008 | £235,319 | -14% |
30 Properties |
| 2007 | £269,221 | 17% |
53 Properties |
| 2006 | £222,119 | 12% |
75 Properties |
| 2005 | £195,677 | -32% |
55 Properties |
| 2004 | £257,707 | 21% |
38 Properties |
| 2003 | £204,452 | 18% |
42 Properties |
| 2002 | £168,612 | 34% |
52 Properties |
| 2001 | £111,944 | -11% |
58 Properties |
| 2000 | £124,130 | 17% |
45 Properties |
| 1999 | £103,404 | 18% |
55 Properties |
| 1998 | £84,854 | -9% |
42 Properties |
| 1997 | £92,859 | -4% |
44 Properties |
| 1996 | £96,441 | 29% |
46 Properties |
| 1995 | £68,165 | - |
34 Properties |
Property Price per Property Type in Walkham
Here you can find historic sold price data in order to help with your property search.
The average Property Paid Price for specific property types in the last three years are:
| Property Type | Average Sold Price | Sold Properties |
|---|---|---|
| Semi Detached House | £274,620.00 | 29 Semi Detached Houses |
| Detached House | £485,158.00 | 37 Detached Houses |
| Terraced House | £221,123.00 | 19 Terraced Houses |
| Flat | £168,950.00 | 2 Flats |

