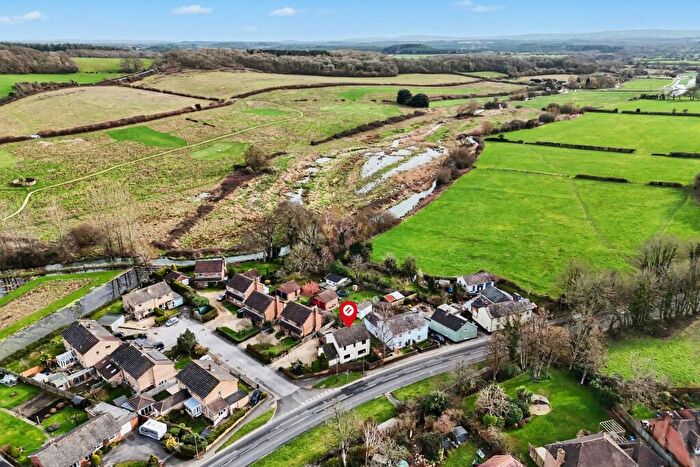
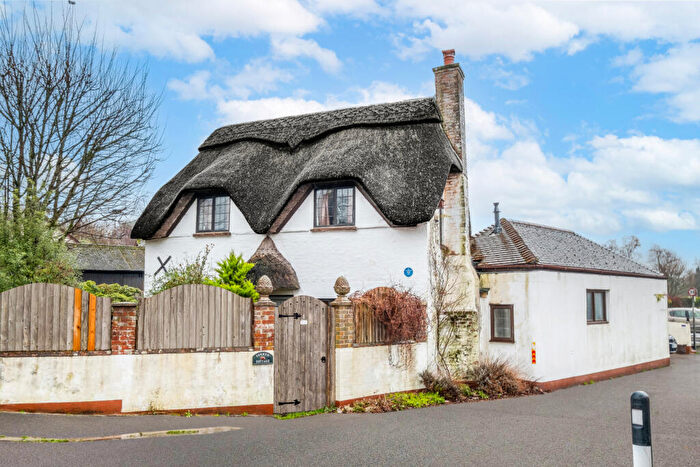
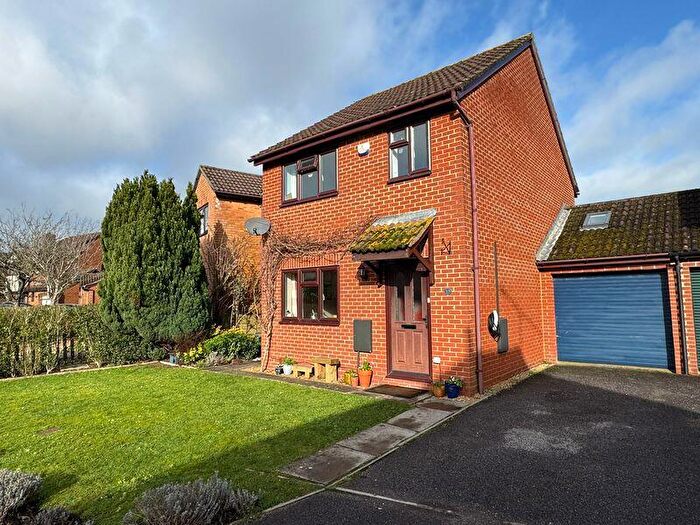
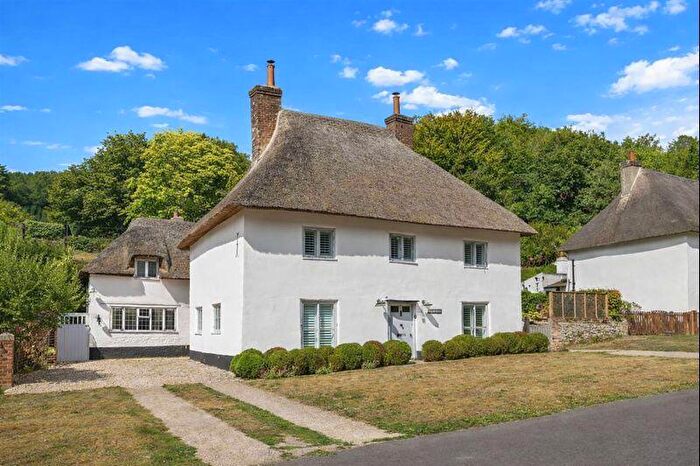
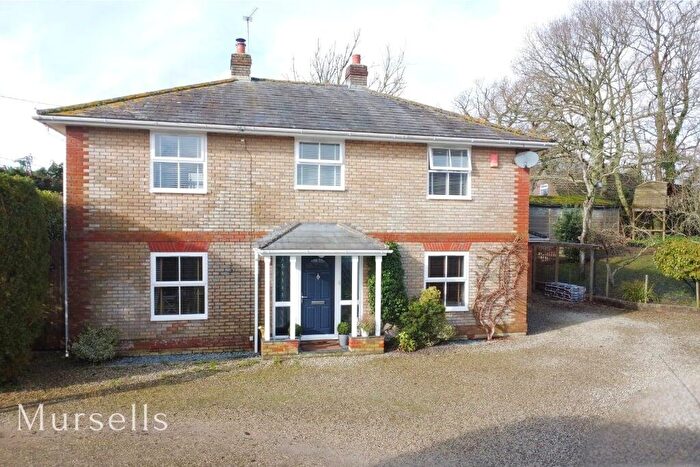
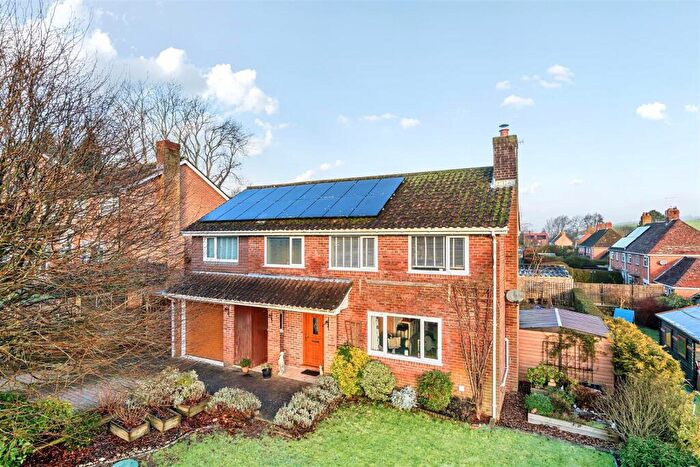
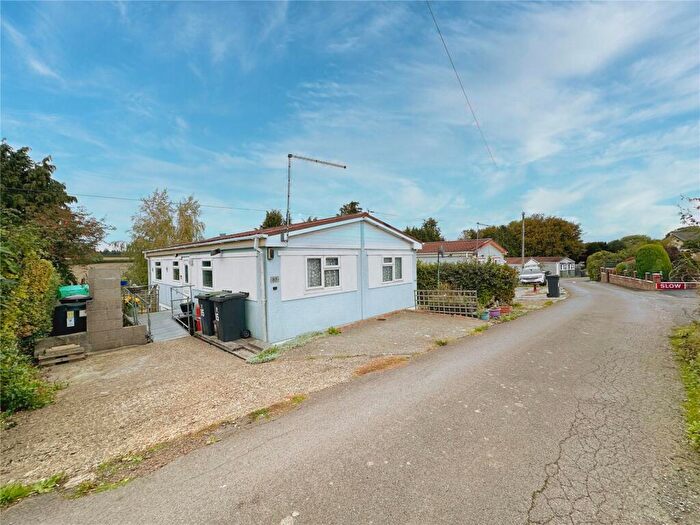
Houses for sale & to rent in Abbey, Blandford Forum
House Prices in Abbey
Properties in Abbey have an average house price of £443,032.00 and had 95 Property Transactions within the last 3 years¹.
Abbey is an area in Blandford Forum, Dorset with 1,220 households², where the most expensive property was sold for £1,190,000.00.
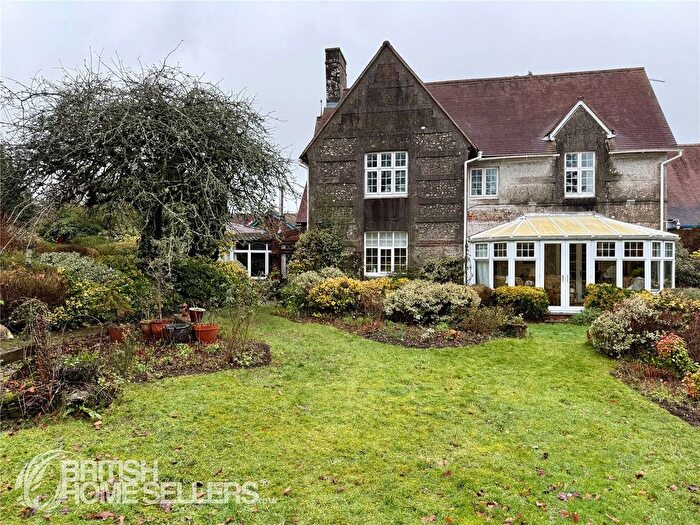
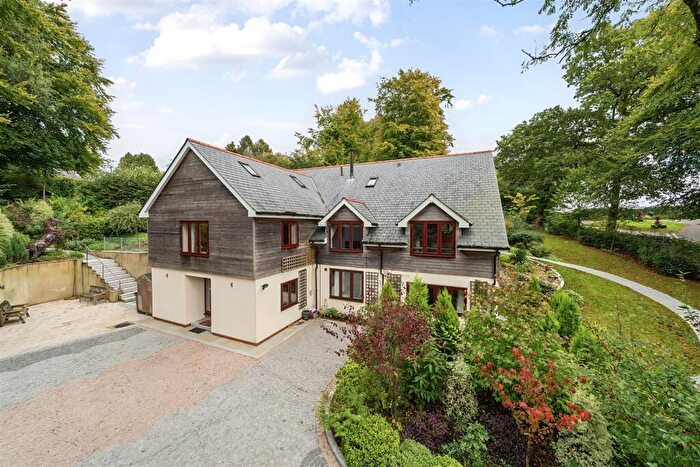
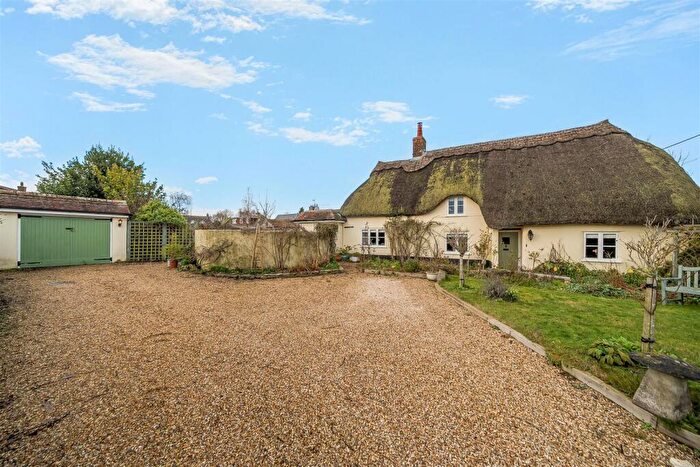
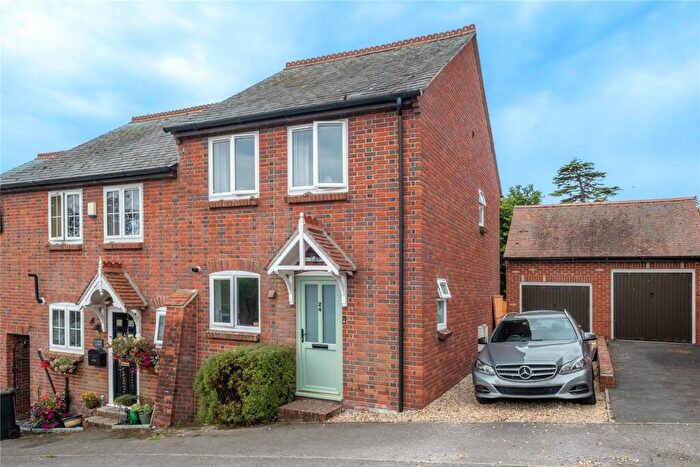
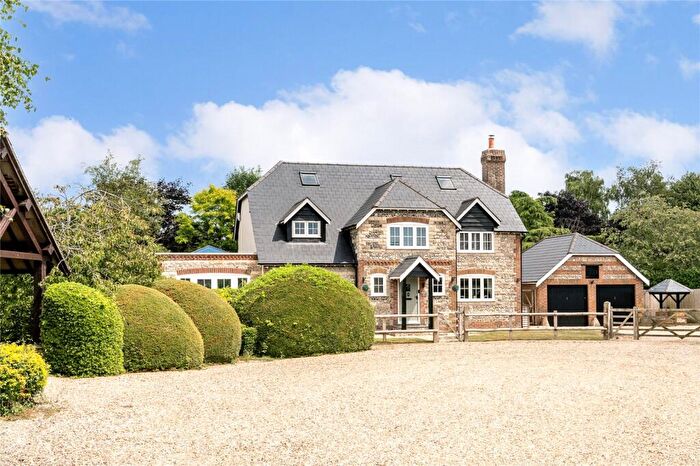
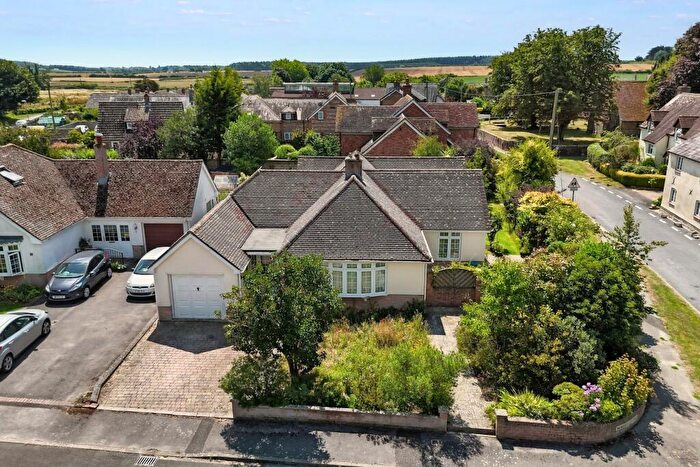
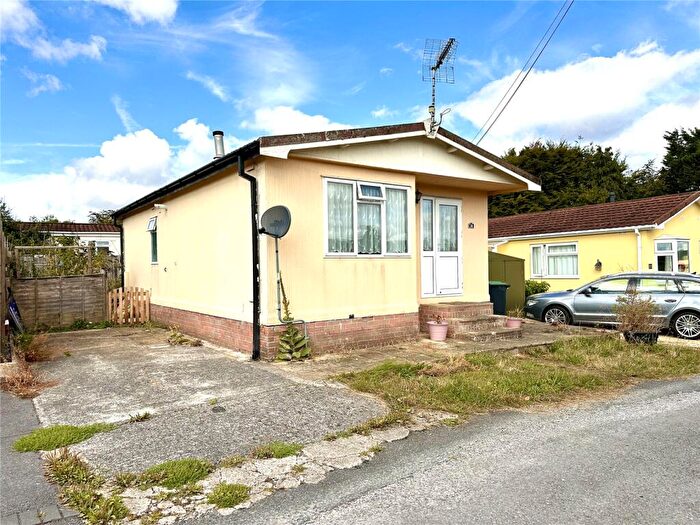
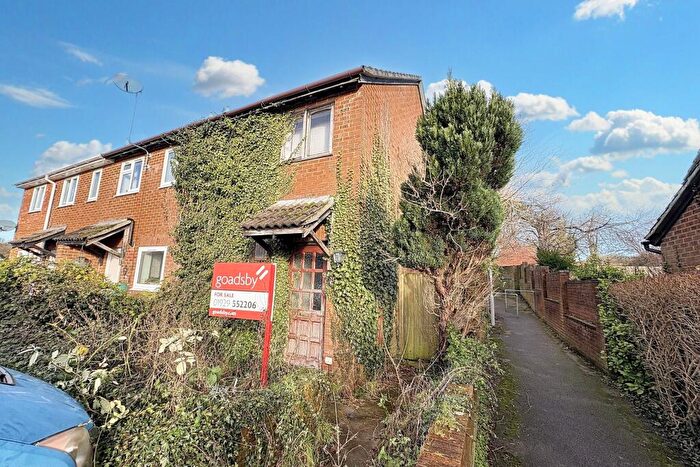
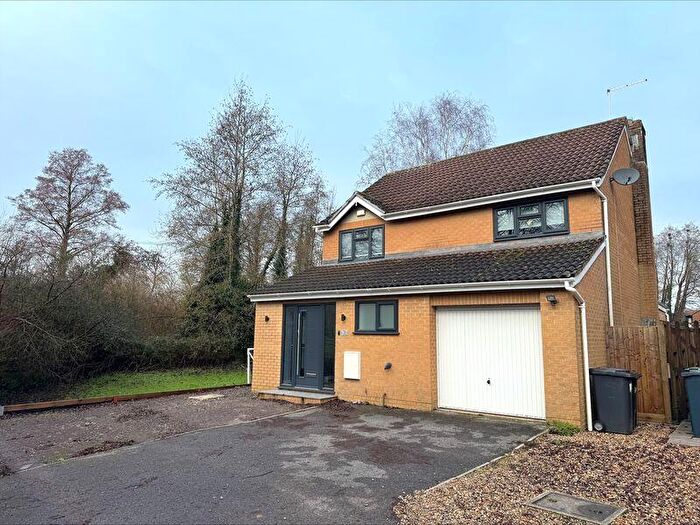
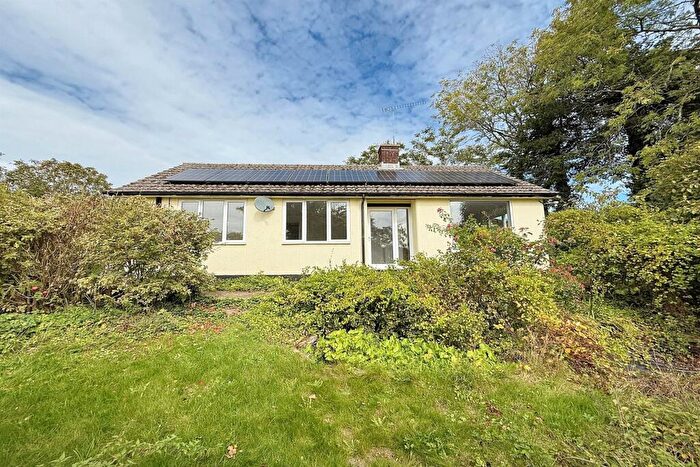
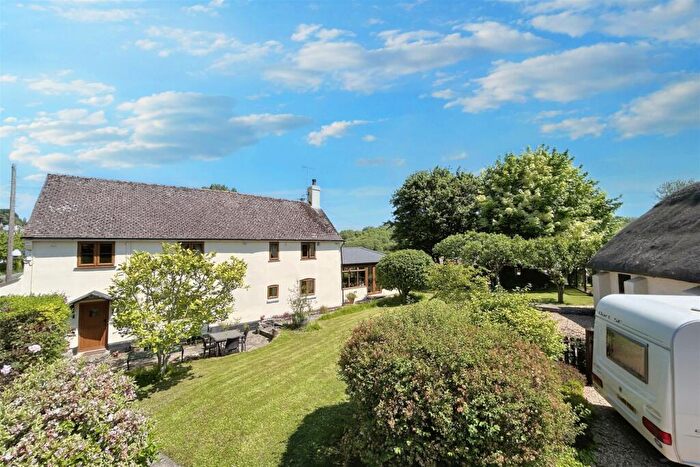
Properties for sale in Abbey
Roads and Postcodes in Abbey
Navigate through our locations to find the location of your next house in Abbey, Blandford Forum for sale or to rent.
| Streets | Postcodes |
|---|---|
| Athelstan Way | DT11 0BA |
| Bagwood Lane | DT11 9BB |
| Bere Road | DT11 9BA DT11 9BD DT11 9BP |
| Bladen View | DT11 0LF |
| Blandford Hill | DT11 0AB DT11 0AE DT11 0JB DT11 0JD |
| Broad Close | DT11 9BL |
| Brooklands | DT11 0LP |
| Bush Park | DT11 9BG |
| Castle Green | DT11 0AL |
| Catherines Well | DT11 0AS DT11 0AT |
| Chapel Street | DT11 0JP |
| Charlotte Gardens | DT11 0AD |
| Chescombe Lane | DT11 0AR |
| Church Lane | DT11 9BE |
| Church Row | DT11 0DD |
| Church Street | DT11 9QE |
| Clypetts | DT11 9AY |
| Coles Lane | DT11 0LG |
| Deer Park | DT11 0AY |
| Dewlish Road | DT11 0JL |
| Dorchester Hill | DT11 0HP DT11 0HW DT11 0JG |
| Duck Street | DT11 9BW |
| East Street | DT11 9BQ |
| Fields Close | DT11 0AQ |
| Fosters Meadows | DT11 0DW |
| Fox View | DT11 0FX |
| Homefield | DT11 0JT |
| Hopsfield | DT11 0LD |
| Huntley Down | DT11 0LN |
| Kingston Barnyard | DT11 9FG |
| Knapp Lane | DT11 0DF |
| Little England | DT11 0JU |
| Little Hewish Cottages | DT11 0DP |
| Longmead Cottages | DT11 0HU |
| Lower Street | DT11 9AR |
| Main Road | DT11 9EX |
| Milton End | DT11 0AN |
| Milton Mills Cottages | DT11 0BQ |
| Milton Road | DT11 0JZ DT11 0LA |
| Milton Road Close | DT11 0JY |
| Milton Terrace | DT11 0LJ |
| New Close Cottages | DT11 0AU |
| New Cottages | DT11 9HE |
| North Street | DT11 9AZ |
| Old Oak Way | DT11 0TN |
| Orchard Lane | DT11 9BF |
| Orchard Rise | DT11 0LL |
| Park Cottages | DT11 9EZ |
| Pitcher Close | DT11 9BZ |
| Plumbley Meadows | DT11 9BY |
| Queens Square | DT11 0AF |
| Rook Lane | DT11 0AH |
| Rose Cottages | DT11 0JW DT11 9AP |
| Sackville Street | DT11 9BJ |
| Sanders Green | DT11 0HN |
| St Andrews View | DT11 0GA |
| St Marys Close | DT11 0DJ |
| Stileham Bank | DT11 0LE |
| Stoneylawn | DT11 9AU |
| The Causeway | DT11 0JX |
| The Knapp | DT11 0DE |
| The Maltings | DT11 0BH |
| The Rings | DT11 0HY |
| The Square | DT11 0JF |
| Wares Close | DT11 9BS |
| West Street | DT11 9AX DT11 9FD |
| Wetherby Close | DT11 0JN |
| Whatcombe Lane | DT11 0AG |
| DT11 0AP DT11 0AZ DT11 0BL DT11 0BP DT11 0BU DT11 0BW DT11 0DA DT11 0DB DT11 0DG DT11 0DQ DT11 0JA DT11 0LH DT11 9AT DT11 9BU DT11 9ES DT11 9ET DT11 9EU DT11 9HB DT11 9HD |
Transport near Abbey
- FAQ
- Price Paid By Year
- Property Type Price
Frequently asked questions about Abbey
What is the average price for a property for sale in Abbey?
The average price for a property for sale in Abbey is £443,032. This amount is 17% higher than the average price in Blandford Forum. There are 650 property listings for sale in Abbey.
What streets have the most expensive properties for sale in Abbey?
The streets with the most expensive properties for sale in Abbey are The Knapp at an average of £1,000,000, New Cottages at an average of £846,000 and Whatcombe Lane at an average of £760,000.
What streets have the most affordable properties for sale in Abbey?
The streets with the most affordable properties for sale in Abbey are Queens Square at an average of £191,550, Castle Green at an average of £232,750 and Bere Road at an average of £270,000.
Which train stations are available in or near Abbey?
Some of the train stations available in or near Abbey are Moreton (Dorset), Wool and Wareham.
Property Price Paid in Abbey by Year
The average sold property price by year was:
| Year | Average Sold Price | Price Change |
Sold Properties
|
|---|---|---|---|
| 2025 | £459,134 | 9% |
41 Properties |
| 2024 | £417,808 | -7% |
31 Properties |
| 2023 | £448,326 | -2% |
23 Properties |
| 2022 | £459,346 | -4% |
51 Properties |
| 2021 | £477,895 | 19% |
58 Properties |
| 2020 | £385,256 | 17% |
41 Properties |
| 2019 | £320,002 | -24% |
37 Properties |
| 2018 | £395,597 | 8% |
47 Properties |
| 2017 | £364,131 | 2% |
42 Properties |
| 2016 | £357,900 | 12% |
57 Properties |
| 2015 | £314,358 | 11% |
59 Properties |
| 2014 | £279,490 | -4% |
53 Properties |
| 2013 | £291,282 | 2% |
57 Properties |
| 2012 | £286,608 | -7% |
45 Properties |
| 2011 | £305,362 | 1% |
43 Properties |
| 2010 | £301,637 | 18% |
40 Properties |
| 2009 | £247,425 | -33% |
43 Properties |
| 2008 | £329,600 | 3% |
23 Properties |
| 2007 | £319,212 | 7% |
51 Properties |
| 2006 | £296,256 | 11% |
72 Properties |
| 2005 | £264,249 | -9% |
50 Properties |
| 2004 | £288,018 | 4% |
87 Properties |
| 2003 | £275,658 | 29% |
61 Properties |
| 2002 | £195,415 | 15% |
92 Properties |
| 2001 | £165,340 | -7% |
64 Properties |
| 2000 | £176,480 | 24% |
72 Properties |
| 1999 | £134,480 | 10% |
81 Properties |
| 1998 | £120,517 | 11% |
71 Properties |
| 1997 | £107,206 | 5% |
102 Properties |
| 1996 | £102,037 | -8% |
53 Properties |
| 1995 | £109,992 | - |
46 Properties |
Property Price per Property Type in Abbey
Here you can find historic sold price data in order to help with your property search.
The average Property Paid Price for specific property types in the last three years are:
| Property Type | Average Sold Price | Sold Properties |
|---|---|---|
| Semi Detached House | £379,480.00 | 25 Semi Detached Houses |
| Detached House | £515,745.00 | 53 Detached Houses |
| Terraced House | £309,797.00 | 17 Terraced Houses |

