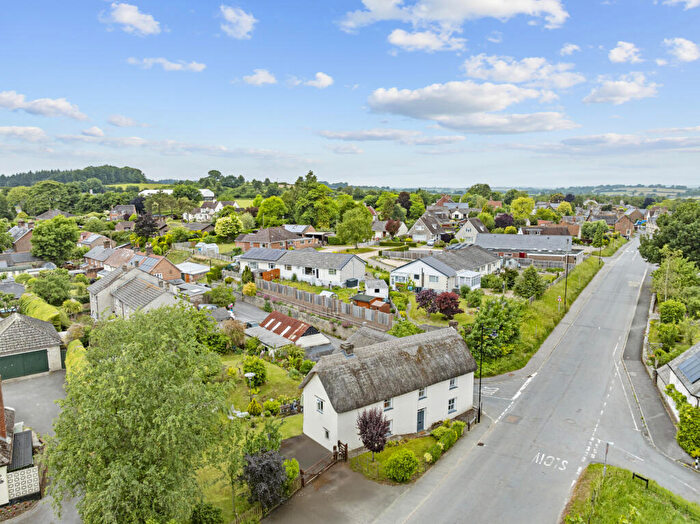
Houses for sale & to rent in Puddletown, Dorchester
House Prices in Puddletown
Properties in Puddletown have an average house price of £402,415.00 and had 121 Property Transactions within the last 3 years¹.
Puddletown is an area in Dorchester, Dorset with 890 households², where the most expensive property was sold for £1,055,000.00.
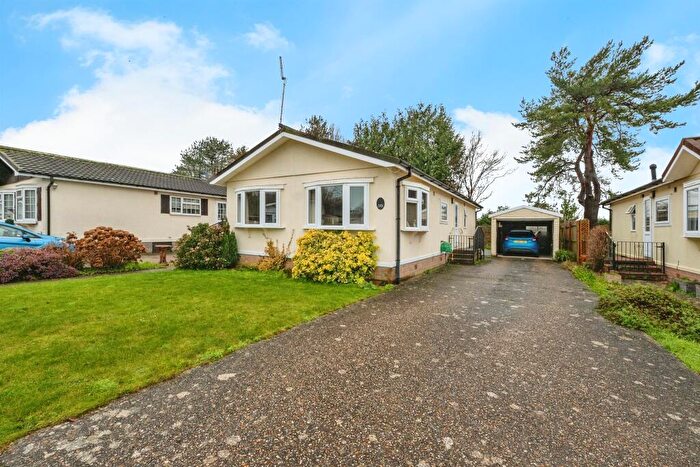
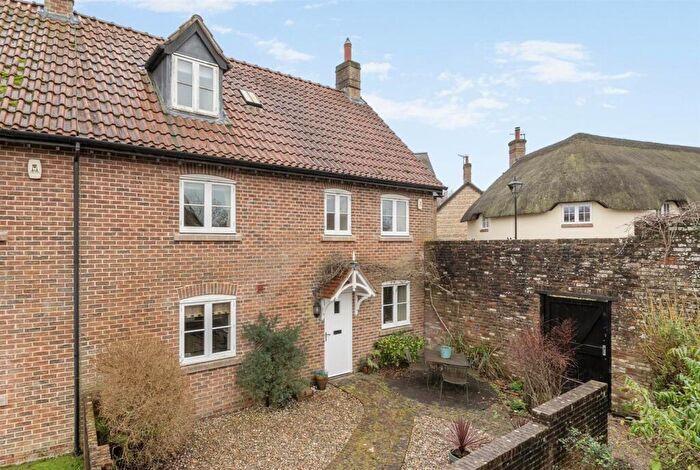
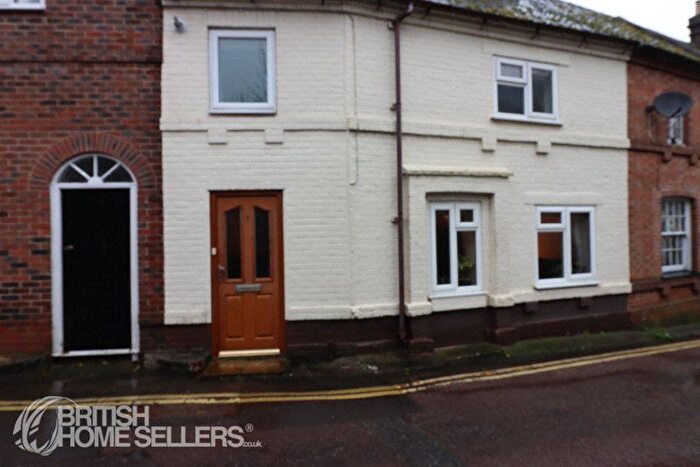
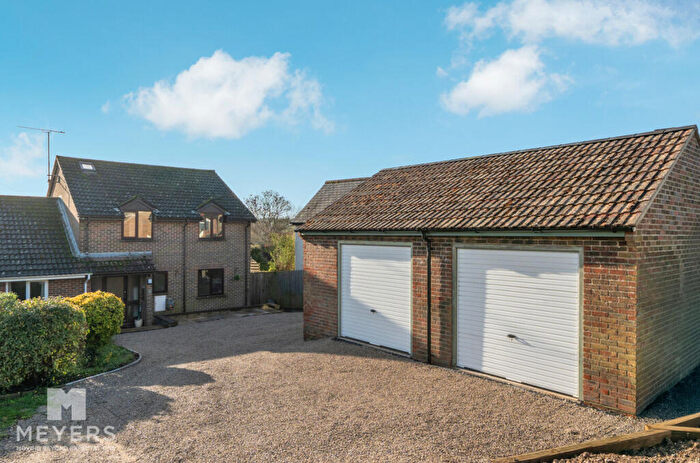
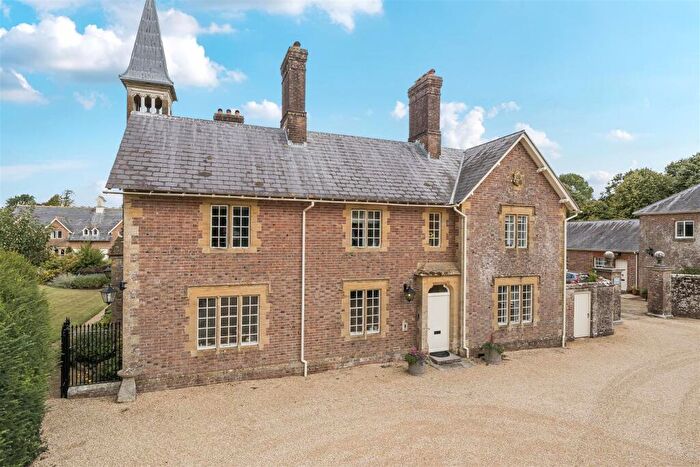
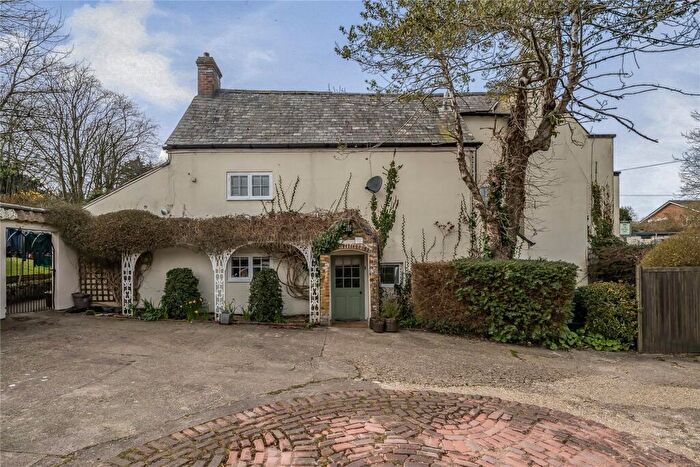
Properties for sale in Puddletown
Roads and Postcodes in Puddletown
Navigate through our locations to find the location of your next house in Puddletown, Dorchester for sale or to rent.
| Streets | Postcodes |
|---|---|
| Ash Tree Close | DT2 8UZ |
| Athelhampton Road | DT2 8SR |
| Beech Road | DT2 8SZ |
| Bellbury Close | DT2 8SG |
| Blandford Road | DT2 8RS |
| Brymer Road | DT2 8SX |
| Butt Close | DT2 8ST DT2 8SU |
| Catmead | DT2 8GX |
| Central Farm Lane | DT2 7FB |
| Chapel View | DT2 8XE |
| Chine Hill Cottages | DT2 7ST |
| Church Street | DT2 7LU |
| Coombe Road | DT2 8RZ |
| Crown Gardens | DT2 7FG |
| Drakes Lane | DT2 7NR |
| Egdon Gardens | DT2 7FE |
| Greenacres | DT2 8GF |
| Greenways | DT2 7LP |
| Hammett Close | DT2 7EF |
| Heath Cottages | DT2 8QL |
| High Street | DT2 8RT DT2 8RU DT2 8RX DT2 8RY DT2 8UE DT2 8WY |
| Kingsmead | DT2 8XH |
| Laycock Farm Cottages | DT2 7SN |
| Lower Waterston Cottages | DT2 7SR |
| Main Road | DT2 7DQ DT2 7EJ DT2 7EL DT2 7EN DT2 7ES DT2 7ET DT2 7EU DT2 7EW DT2 7EY DT2 7EZ DT2 7FD |
| Manor Close | DT2 7SB |
| Manor Farm Cottages | DT2 7SS |
| Middle Street | DT2 7LX |
| Mill Street | DT2 8FS DT2 8SH DT2 8SQ |
| New Street | DT2 8SF |
| Orchard Close | DT2 7RU |
| Orford Mews | DT2 8UG |
| Orford Street | DT2 8TL |
| Pound Lane | DT2 7LZ |
| Sherrings Green Close | DT2 8GZ |
| Southover | DT2 7HD |
| Streetway Lane | DT2 7NU |
| Styles Lane | DT2 8SJ |
| The Courtyard | DT2 8TH |
| The Green | DT2 7EX DT2 8SN |
| The Moor | DT2 8TE DT2 8ZL |
| The Oak Gardens | DT2 8XG |
| The Square | DT2 8SL |
| The Stables | DT2 8TJ |
| Thompson Close | DT2 8TD |
| Three Lanes Way | DT2 8GE |
| Trent Close | DT2 7HA |
| Troytown Cottages | DT2 8QF |
| Whitehill | DT2 7EP DT2 8SB |
| Whitehill Lane | DT2 7ER |
| Willoughby Close | DT2 8SE |
| DT2 7EG DT2 7HG DT2 7LG DT2 7LL DT2 7LR DT2 7LT DT2 7NA DT2 7NB DT2 7ND DT2 7NG DT2 7NH DT2 7NJ DT2 7NL DT2 7NP DT2 7NQ DT2 7NS DT2 7NT DT2 7NW DT2 7NX DT2 7QD DT2 7SP DT2 8RR |
Transport near Puddletown
-
Moreton (Dorset) Station
-
Dorchester South Station
-
Dorchester West Station
-
Wool Station
-
Upwey Station
- FAQ
- Price Paid By Year
- Property Type Price
Frequently asked questions about Puddletown
What is the average price for a property for sale in Puddletown?
The average price for a property for sale in Puddletown is £402,415. This amount is 6% higher than the average price in Dorchester. There are 861 property listings for sale in Puddletown.
What streets have the most expensive properties for sale in Puddletown?
The streets with the most expensive properties for sale in Puddletown are The Square at an average of £580,000, Streetway Lane at an average of £495,000 and New Street at an average of £490,000.
What streets have the most affordable properties for sale in Puddletown?
The streets with the most affordable properties for sale in Puddletown are The Stables at an average of £240,000, Chine Hill Cottages at an average of £246,666 and Chapel View at an average of £250,000.
Which train stations are available in or near Puddletown?
Some of the train stations available in or near Puddletown are Moreton (Dorset), Dorchester South and Dorchester West.
Property Price Paid in Puddletown by Year
The average sold property price by year was:
| Year | Average Sold Price | Price Change |
Sold Properties
|
|---|---|---|---|
| 2025 | £438,660 | 14% |
25 Properties |
| 2024 | £376,357 | -9% |
49 Properties |
| 2023 | £410,303 | 2% |
47 Properties |
| 2022 | £402,238 | 1% |
21 Properties |
| 2021 | £397,987 | 4% |
60 Properties |
| 2020 | £383,389 | 21% |
39 Properties |
| 2019 | £302,272 | -12% |
33 Properties |
| 2018 | £338,364 | 8% |
37 Properties |
| 2017 | £312,637 | 2% |
51 Properties |
| 2016 | £307,585 | -8% |
44 Properties |
| 2015 | £330,771 | 6% |
33 Properties |
| 2014 | £311,234 | 9% |
48 Properties |
| 2013 | £283,692 | 5% |
65 Properties |
| 2012 | £269,183 | 1% |
45 Properties |
| 2011 | £267,633 | 5% |
33 Properties |
| 2010 | £254,705 | -7% |
40 Properties |
| 2009 | £271,585 | -15% |
60 Properties |
| 2008 | £311,480 | -19% |
31 Properties |
| 2007 | £370,071 | 29% |
83 Properties |
| 2006 | £260,951 | -3% |
80 Properties |
| 2005 | £269,654 | 5% |
40 Properties |
| 2004 | £256,561 | 22% |
44 Properties |
| 2003 | £200,311 | 17% |
51 Properties |
| 2002 | £167,076 | -1% |
66 Properties |
| 2001 | £169,172 | 26% |
44 Properties |
| 2000 | £125,640 | -17% |
33 Properties |
| 1999 | £147,569 | 36% |
51 Properties |
| 1998 | £94,944 | 6% |
55 Properties |
| 1997 | £89,618 | 13% |
48 Properties |
| 1996 | £77,629 | 4% |
27 Properties |
| 1995 | £74,401 | - |
31 Properties |
Property Price per Property Type in Puddletown
Here you can find historic sold price data in order to help with your property search.
The average Property Paid Price for specific property types in the last three years are:
| Property Type | Average Sold Price | Sold Properties |
|---|---|---|
| Semi Detached House | £339,784.00 | 43 Semi Detached Houses |
| Detached House | £529,438.00 | 49 Detached Houses |
| Terraced House | £292,360.00 | 25 Terraced Houses |
| Flat | £207,500.00 | 4 Flats |

