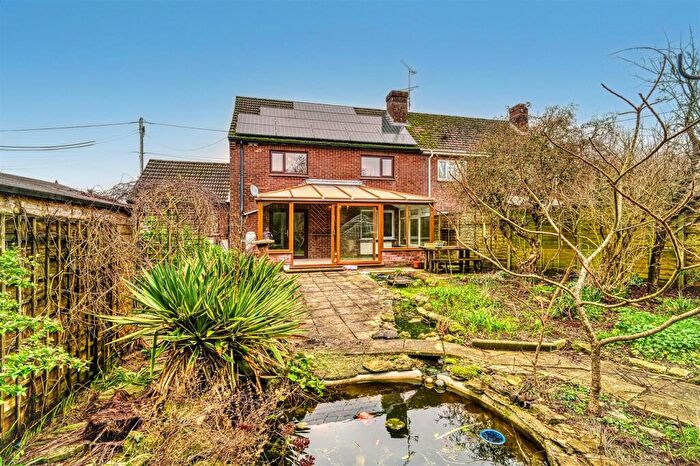
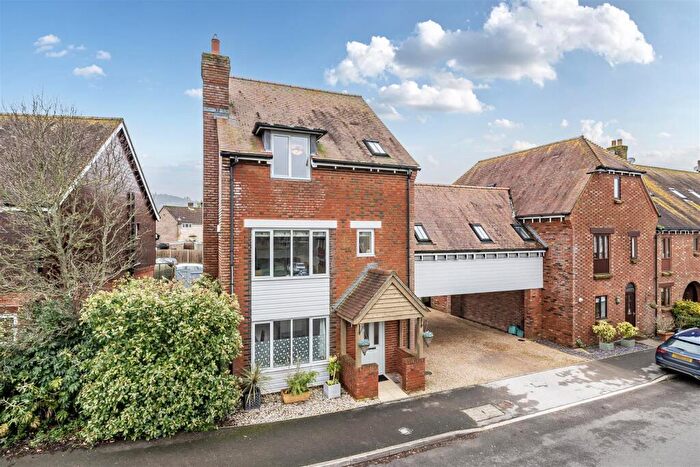
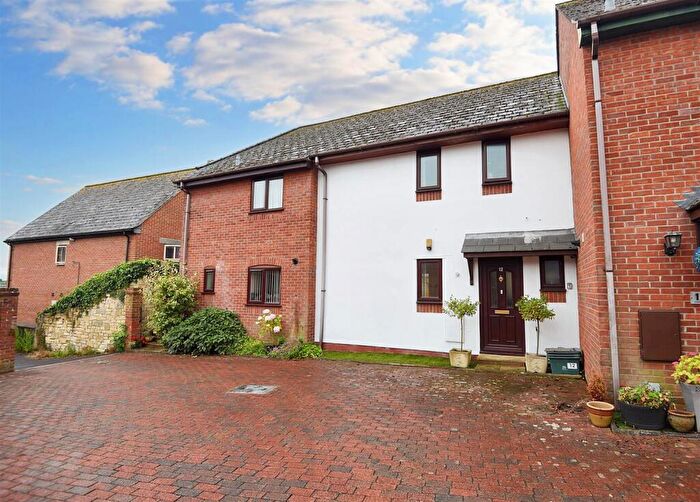
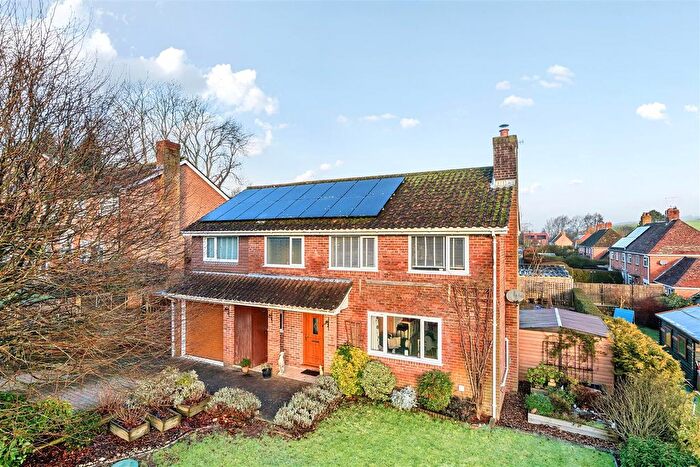
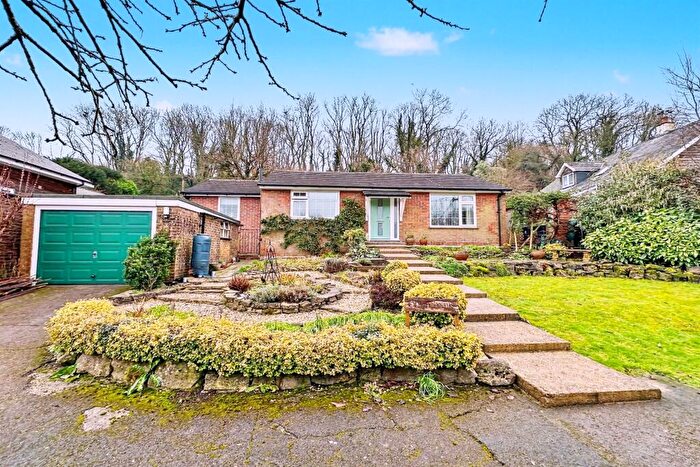
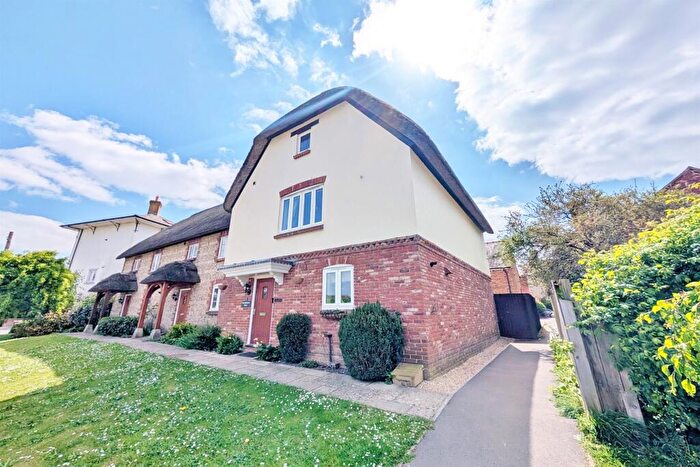
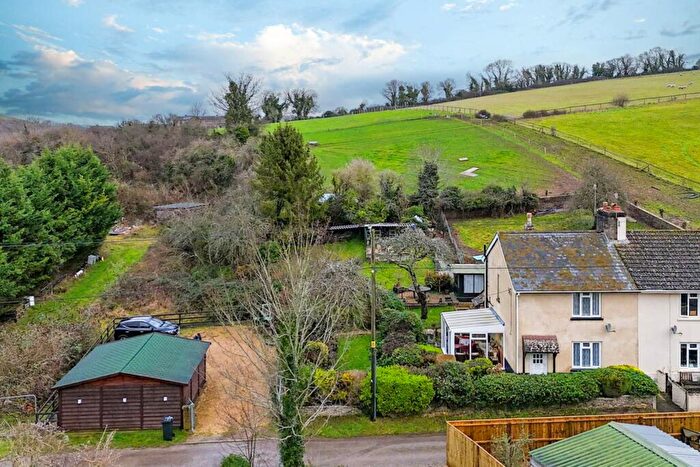
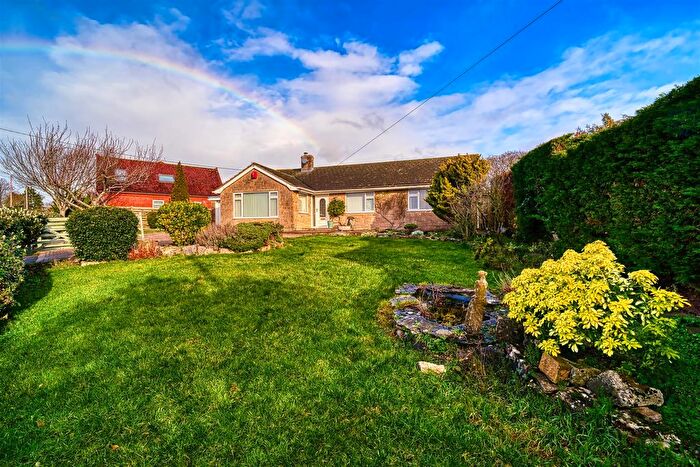
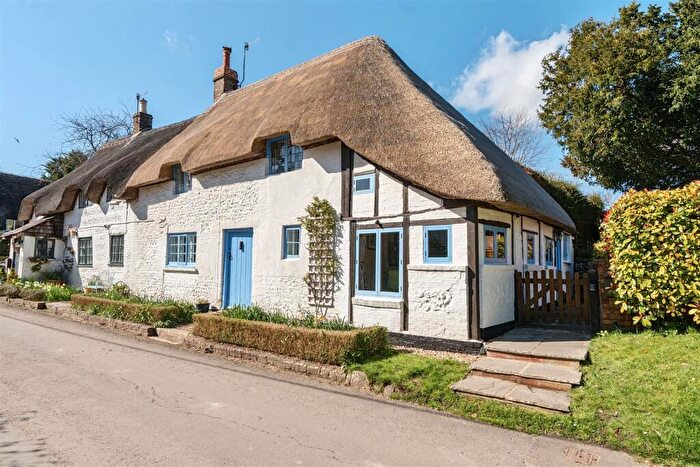
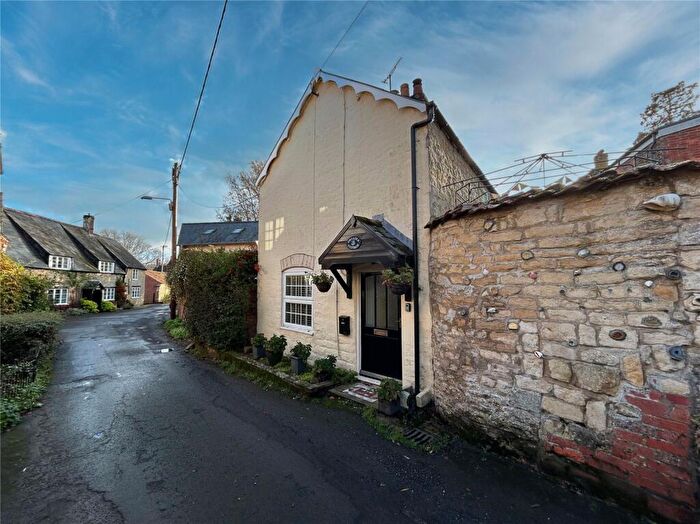
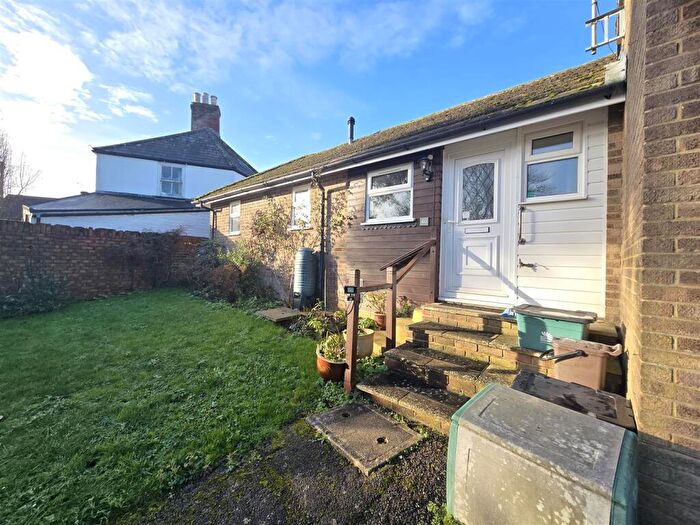
Houses for sale & to rent in Bulbarrow, Blandford Forum
House Prices in Bulbarrow
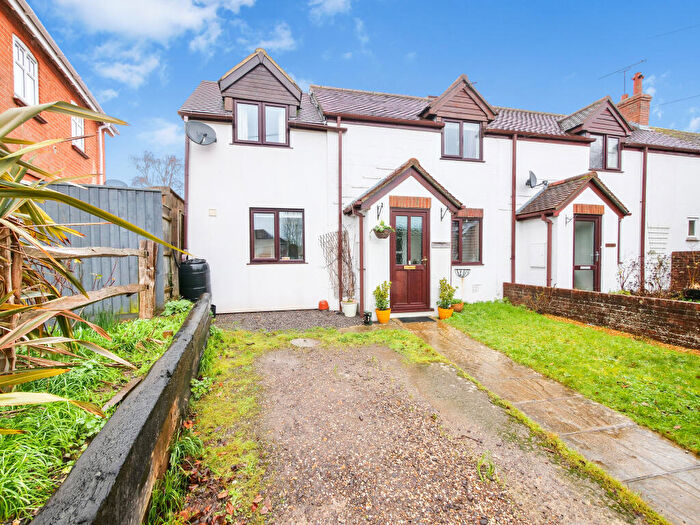
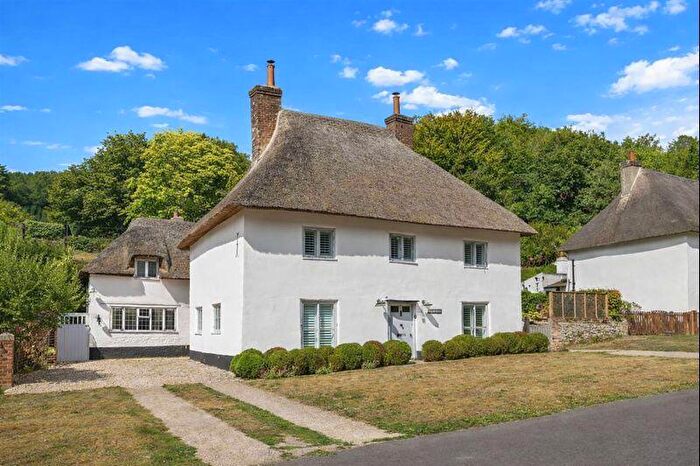
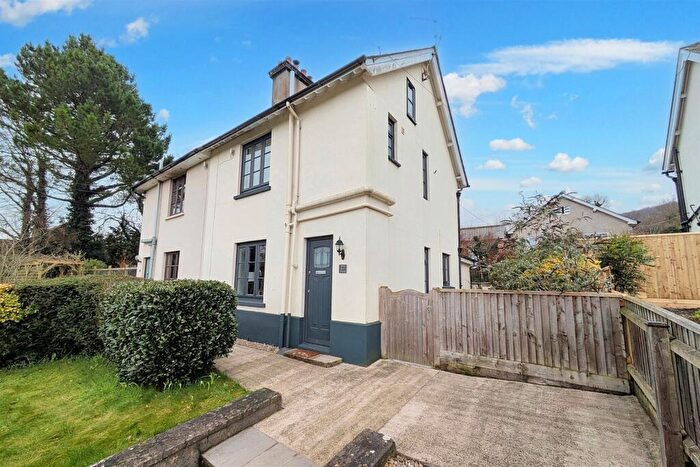
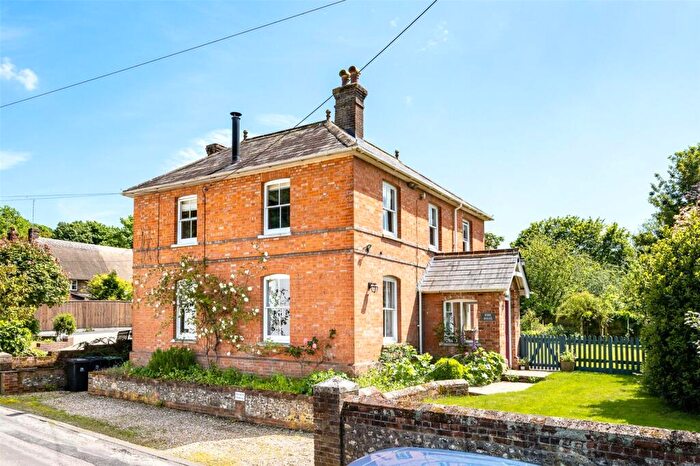
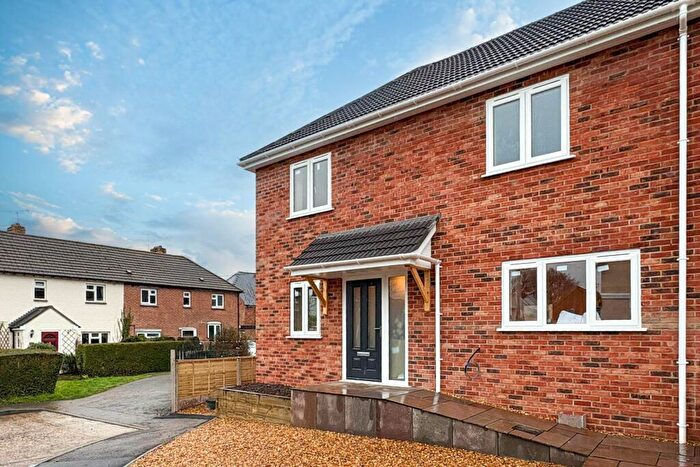
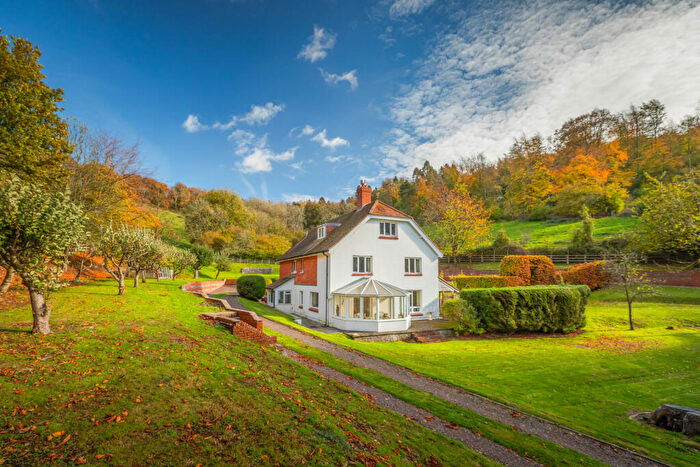
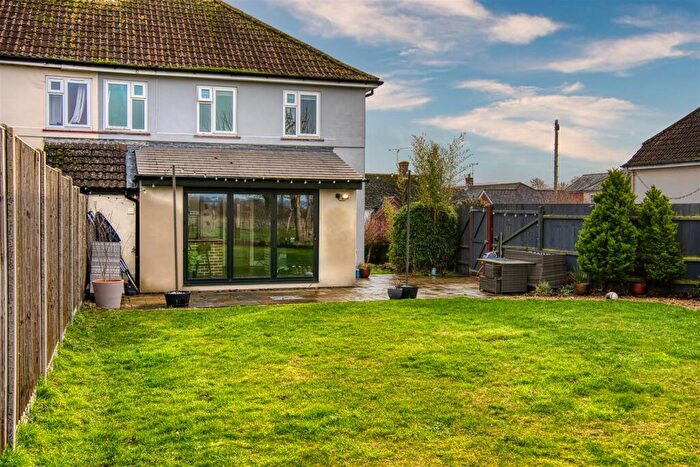
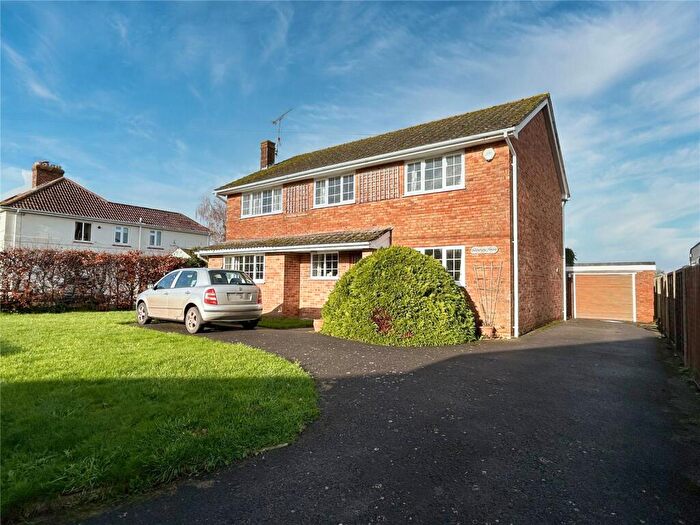
Properties in Bulbarrow have an average house price of £504,264.00 and had 43 Property Transactions within the last 3 years¹.
Bulbarrow is an area in Blandford Forum, Dorset with 690 households², where the most expensive property was sold for £1,400,000.00.
Properties for sale in Bulbarrow
Roads and Postcodes in Bulbarrow
Navigate through our locations to find the location of your next house in Bulbarrow, Blandford Forum for sale or to rent.
| Streets | Postcodes |
|---|---|
| Back Lane | DT11 0LW DT11 0RD |
| Bowey | DT11 0TR |
| Castle Avenue | DT11 0RY |
| Castle Lane | DT11 0RJ DT11 0RL |
| Chapel Lane | DT11 0NG |
| Clenston Road | DT11 0NP |
| Downfield | DT11 0NE |
| Fairmead | DT11 0ND |
| Fippenny Hollow | DT11 0SD |
| Greenhayes | DT11 0RE |
| Hedge End | DT11 0DZ DT11 0EB |
| High Street | DT11 0RG |
| Higher Street | DT11 0RQ |
| Leigh | DT11 0EJ |
| Lower Street | DT11 0RN DT11 0RW |
| Malthouse Cottages | DT11 0RS |
| Mary Gardens | DT11 0RX |
| Nether Mead | DT11 0TP |
| North Street | DT11 0NH DT11 0NJ DT11 0NL |
| Orchard Cottage | DT11 0PG |
| Saxon Rise | DT11 0PQ |
| Shillingstone Lane | DT11 0RB |
| The Common | DT11 0RT |
| The Cross | DT11 0RF |
| The Triangle | DT11 0NW |
| Water Lane | DT11 0PE |
| West Street | DT11 0NT |
| Winterborne Stickland | DT11 0DH DT11 0ED DT11 0LY DT11 0NB DT11 0NN DT11 0NS |
| DT11 0EE DT11 0EF DT11 0EG DT11 0EH DT11 0EL DT11 0EN DT11 0EQ DT11 0LU DT11 0NR DT11 0NU DT11 0NX DT11 0PD DT11 0PF DT11 0RP DT11 0RR |
Transport near Bulbarrow
-
Templecombe Station
-
Gillingham (Dorset) Station
-
Moreton (Dorset) Station
-
Sherborne Station
-
Wool Station
-
Dorchester South Station
-
Dorchester West Station
-
Holton Heath Station
-
Chetnole Station
-
Wareham Station
- FAQ
- Price Paid By Year
- Property Type Price
Frequently asked questions about Bulbarrow
What is the average price for a property for sale in Bulbarrow?
The average price for a property for sale in Bulbarrow is £504,264. This amount is 34% higher than the average price in Blandford Forum. There are 863 property listings for sale in Bulbarrow.
What streets have the most expensive properties for sale in Bulbarrow?
The streets with the most expensive properties for sale in Bulbarrow are Clenston Road at an average of £625,000, Leigh at an average of £585,000 and West Street at an average of £455,000.
What streets have the most affordable properties for sale in Bulbarrow?
The streets with the most affordable properties for sale in Bulbarrow are Water Lane at an average of £230,000, The Cross at an average of £255,000 and Downfield at an average of £305,000.
Which train stations are available in or near Bulbarrow?
Some of the train stations available in or near Bulbarrow are Templecombe, Gillingham (Dorset) and Moreton (Dorset).
Property Price Paid in Bulbarrow by Year
The average sold property price by year was:
| Year | Average Sold Price | Price Change |
Sold Properties
|
|---|---|---|---|
| 2025 | £448,617 | -29% |
16 Properties |
| 2024 | £578,529 | 19% |
17 Properties |
| 2023 | £467,050 | -31% |
10 Properties |
| 2022 | £612,083 | 27% |
24 Properties |
| 2021 | £449,620 | -17% |
36 Properties |
| 2020 | £525,619 | 35% |
30 Properties |
| 2019 | £342,125 | -17% |
16 Properties |
| 2018 | £400,365 | 8% |
29 Properties |
| 2017 | £366,433 | -4% |
31 Properties |
| 2016 | £381,515 | 7% |
32 Properties |
| 2015 | £356,538 | 2% |
31 Properties |
| 2014 | £350,721 | -32% |
26 Properties |
| 2013 | £461,323 | 26% |
17 Properties |
| 2012 | £341,064 | 11% |
24 Properties |
| 2011 | £304,529 | -5% |
17 Properties |
| 2010 | £318,814 | 4% |
17 Properties |
| 2009 | £304,600 | -8% |
40 Properties |
| 2008 | £328,996 | -2% |
15 Properties |
| 2007 | £336,059 | 4% |
30 Properties |
| 2006 | £324,207 | 10% |
41 Properties |
| 2005 | £290,347 | 14% |
23 Properties |
| 2004 | £249,871 | -5% |
30 Properties |
| 2003 | £263,005 | 6% |
28 Properties |
| 2002 | £246,192 | 28% |
46 Properties |
| 2001 | £177,150 | 13% |
25 Properties |
| 2000 | £154,212 | 8% |
27 Properties |
| 1999 | £142,174 | -9% |
31 Properties |
| 1998 | £154,776 | 21% |
25 Properties |
| 1997 | £122,140 | 7% |
45 Properties |
| 1996 | £113,678 | 13% |
40 Properties |
| 1995 | £99,426 | - |
23 Properties |
Property Price per Property Type in Bulbarrow
Here you can find historic sold price data in order to help with your property search.
The average Property Paid Price for specific property types in the last three years are:
| Property Type | Average Sold Price | Sold Properties |
|---|---|---|
| Semi Detached House | £356,117.00 | 17 Semi Detached Houses |
| Detached House | £638,668.00 | 23 Detached Houses |
| Terraced House | £313,333.00 | 3 Terraced Houses |

