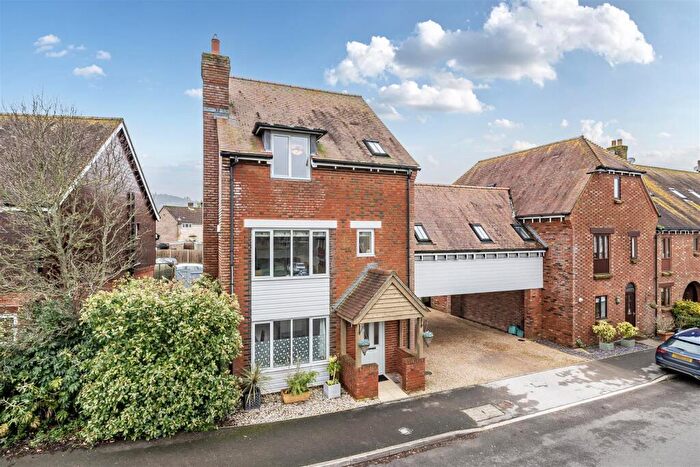
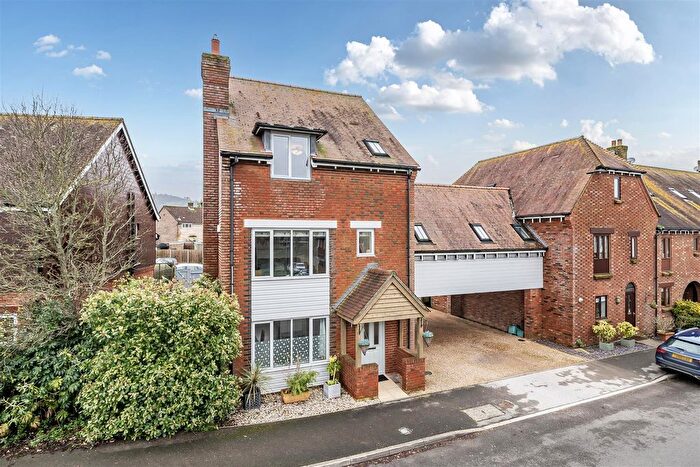
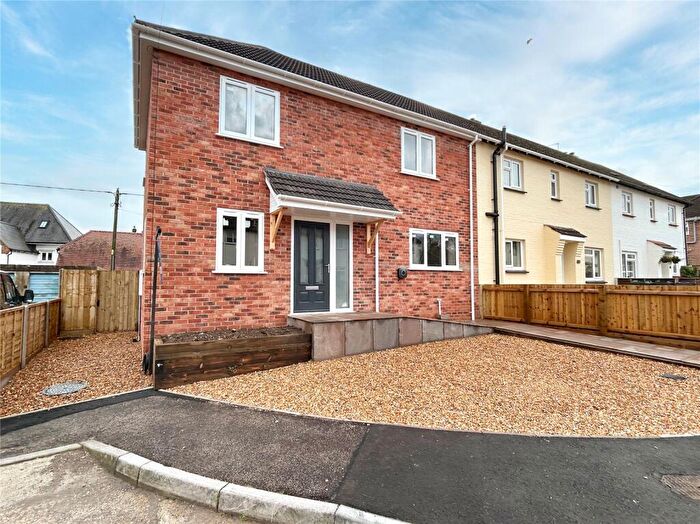
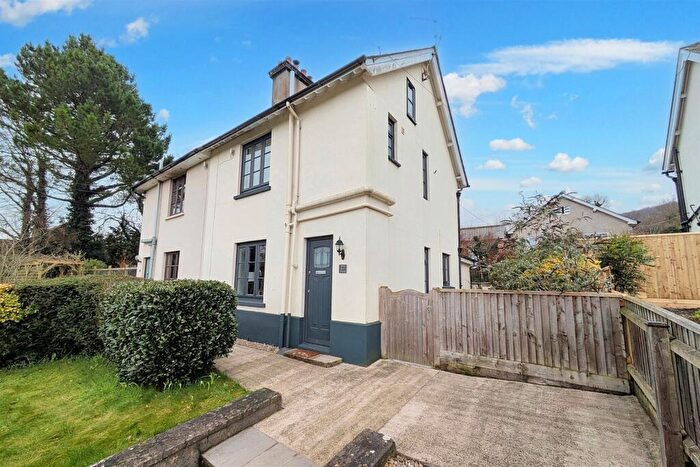
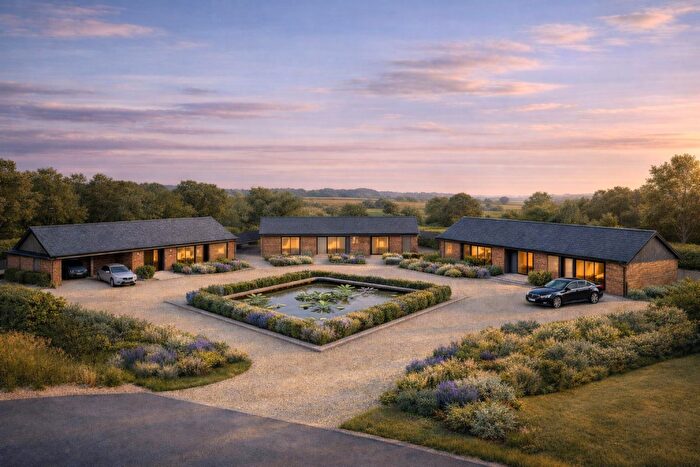
Houses for sale & to rent in Hill Forts, Blandford Forum
House Prices in Hill Forts
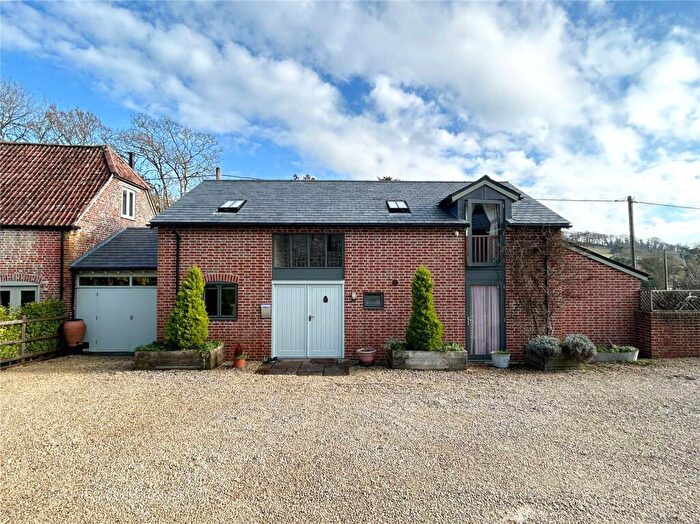
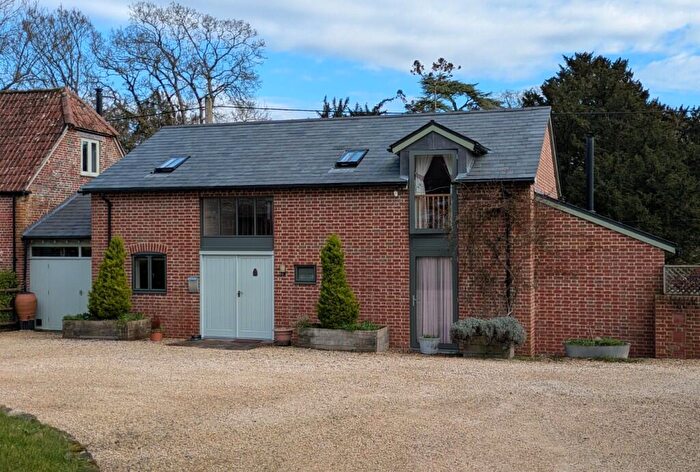
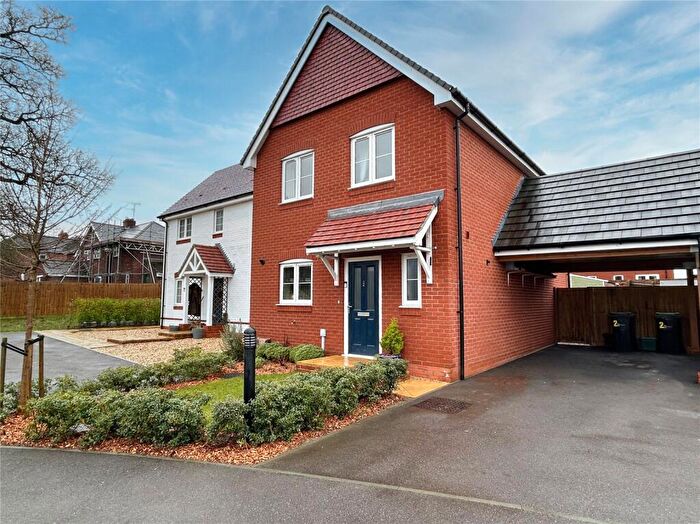
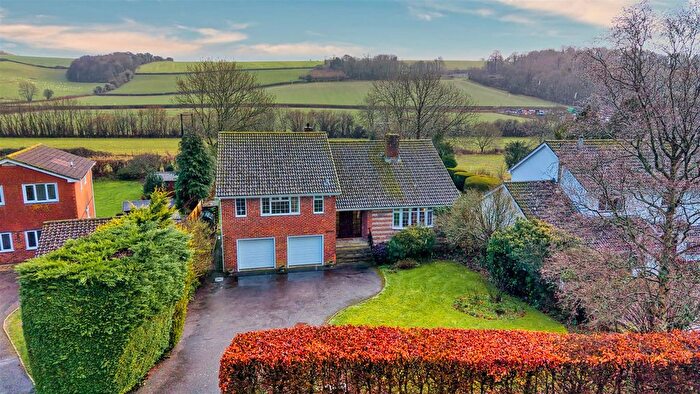
Properties in Hill Forts have an average house price of £477,848.00 and had 162 Property Transactions within the last 3 years¹.
Hill Forts is an area in Blandford Forum, Dorset with 1,772 households², where the most expensive property was sold for £2,860,000.00.
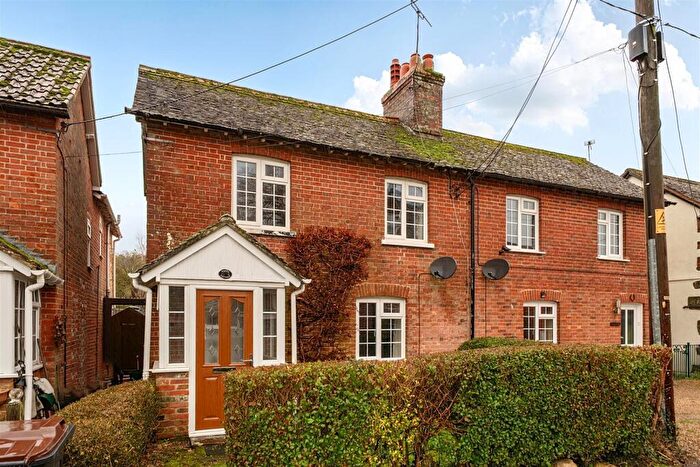
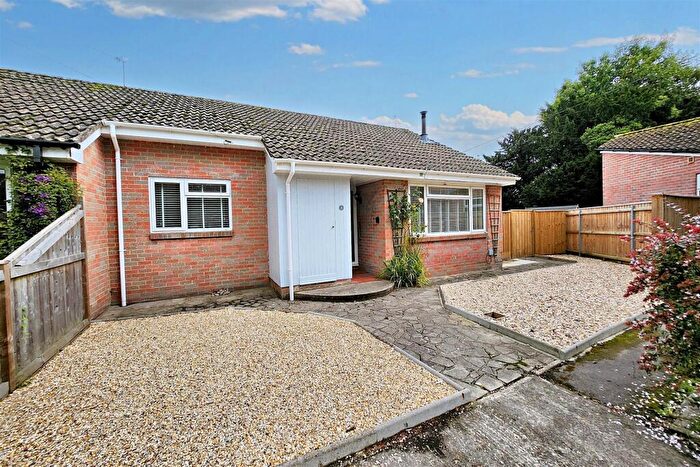
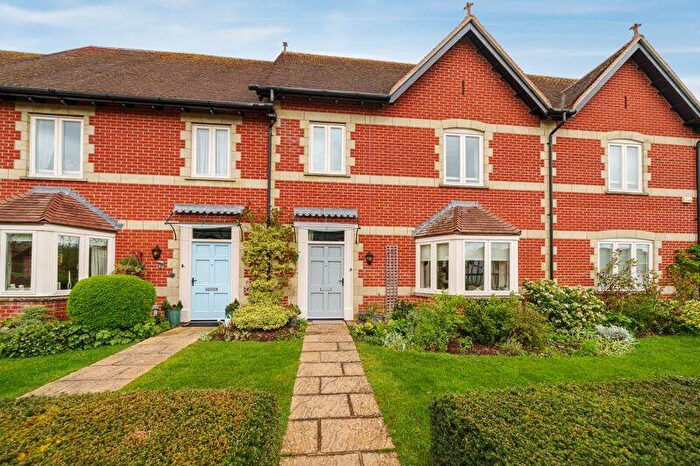
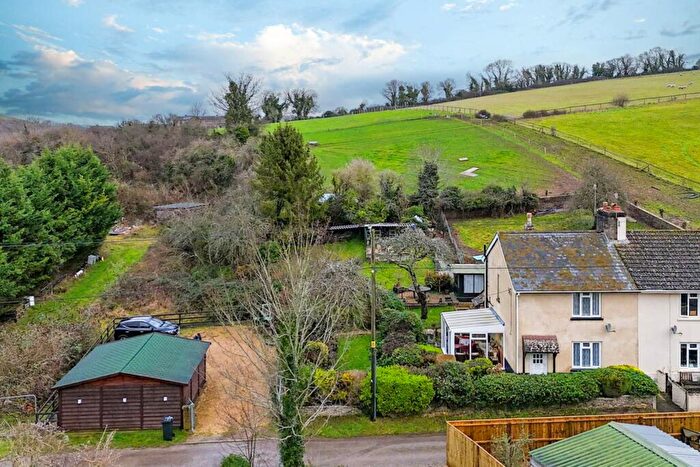
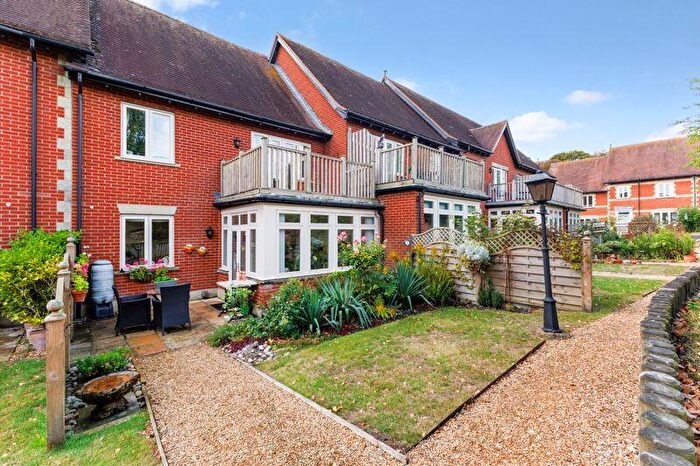
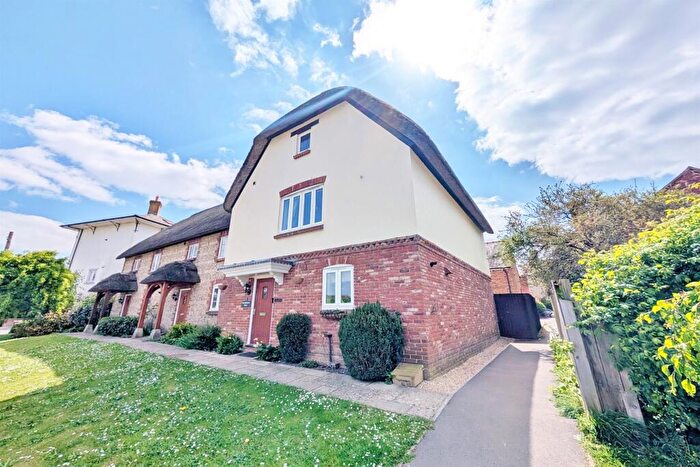
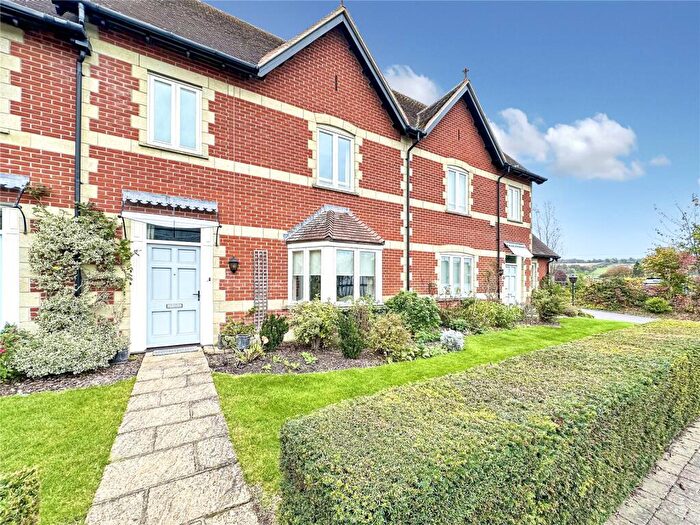
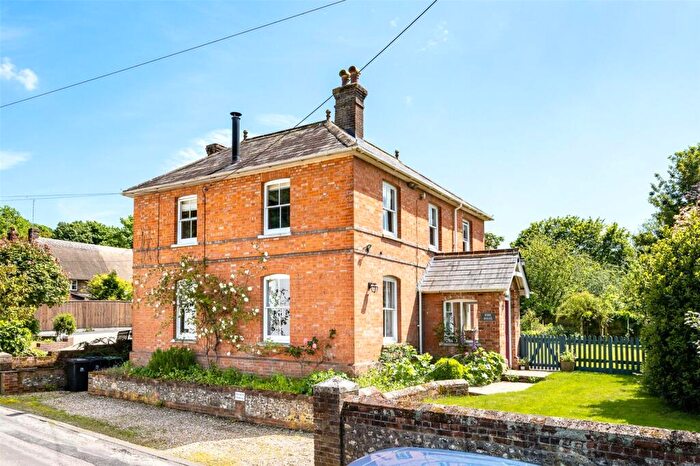
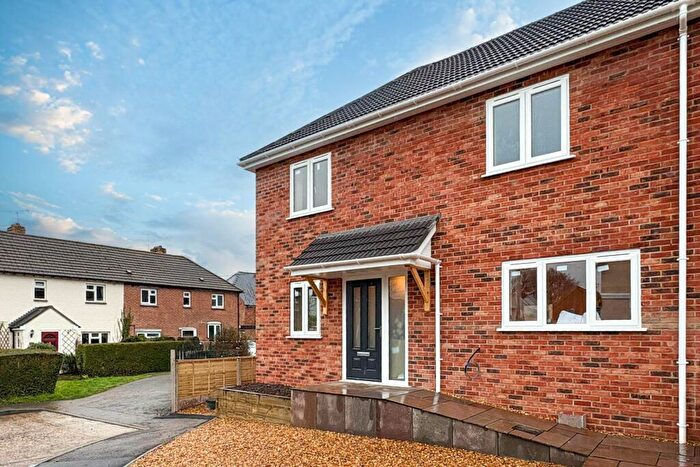
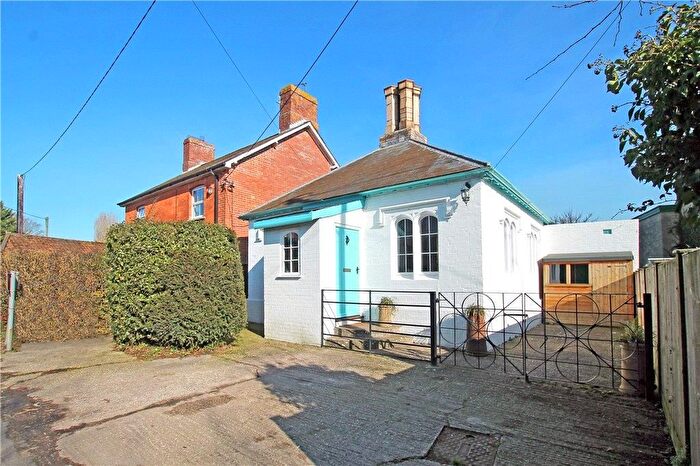
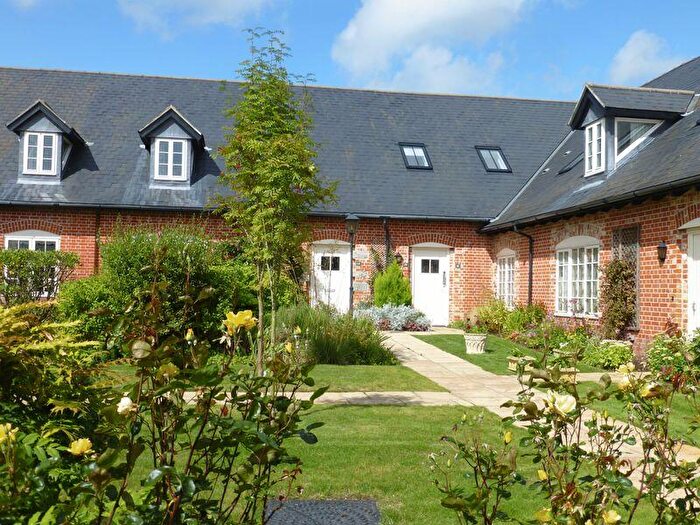
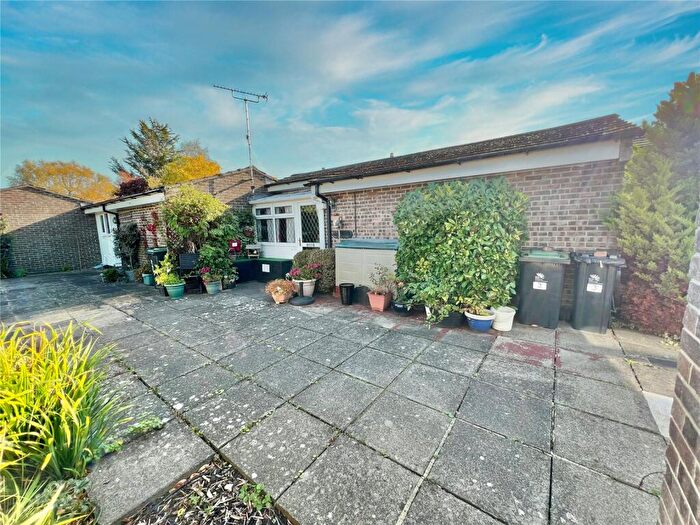
Properties for sale in Hill Forts
Roads and Postcodes in Hill Forts
Navigate through our locations to find the location of your next house in Hill Forts, Blandford Forum for sale or to rent.
| Streets | Postcodes |
|---|---|
| Allen Close | DT11 8EB |
| Aplands Close | DT11 8HR |
| Apple Acre | DT11 8HS |
| Ash Grove | DT11 8DR |
| Augustan Avenue | DT11 0TX |
| Bessells | DT11 8QW |
| Blandford Road | DT11 0SF DT11 0SG DT11 0SQ DT11 8LN DT11 8QN DT11 8QS |
| Bottom Road | DT11 8TF |
| Bower | DT11 8HJ |
| Bramley Grove | DT11 8DW |
| Brodham Way | DT11 0TE |
| Bushes Road | DT11 8SU |
| Chalwell | DT11 8DY |
| Church Hill | DT11 8LS |
| Church Road | DT11 0SL |
| Church View | DT11 8SS |
| Coach Road | DT11 8TL |
| Cookswell Road | DT11 0QZ |
| Coombe Road | DT11 0TB |
| Courtney Close | DT11 8RD |
| Dunns Lane | DT11 8NG |
| East Kennel Cottages | DT11 8PR |
| Everetts Lane | DT11 0SJ |
| Fairfield Road | DT11 8QA |
| Frog Lane | DT11 8QL |
| Gains Cross | DT11 0QP |
| General Wolfe Close | DT11 8QE |
| Gold Hill | DT11 8HD DT11 8HF |
| Greenway | DT11 8DZ |
| Gunn Lane | DT11 0TQ |
| Hambledon Row | DT11 0TY |
| Havelins | DT11 8TH |
| Haycombe | DT11 0PZ |
| Haywards Lane | DT11 8DU DT11 8DX |
| High Street | DT11 8EH DT11 8EJ |
| Higher Common | DT11 8QX |
| Higher Street | DT11 8LX |
| Hinetown | DT11 0SN |
| Hobgoblin | DT11 8LP |
| Hod Drive | DT11 8TJ |
| Hod View | DT11 8TN |
| Holloway Lane | DT11 0SY |
| Home Farm | DT11 8LB |
| Homefield | DT11 8EN |
| Honeysuckle Gardens | DT11 0TJ |
| Ivy Porch Cottages | DT11 8QB |
| Jacobs Ladder | DT11 8EA |
| Knapps | DT11 0RA |
| Knotts Close | DT11 8ES |
| Lanchards | DT11 0QT |
| Lanchards Lane | DT11 0QU DT11 0TF |
| Little Stream | DT11 8FG |
| Manor Road | DT11 8TQ |
| Markstone Cottages | DT11 8ET |
| Melway Gardens | DT11 8EP |
| Melway Lane | DT11 8EW |
| Millbrook Close | DT11 8HA |
| Millbrook Court | DT11 8HP |
| Norton Lane | DT11 0QF |
| Nutmead Close | DT11 8EZ |
| Oak Court | DT11 0TT |
| Oakwood Drive | DT11 8QT |
| Old Mill Cottages | DT11 8TW |
| Olivers Mead | DT11 8HT |
| Orchard Close | DT11 8TE |
| Pepper Hill | DT11 0TD |
| Playcross | DT11 0SH |
| Poplar Hill | DT11 0SE |
| Portman Drive | DT11 8HU |
| Randels | DT11 0SR |
| Rectory Gardens | DT11 8RQ |
| Rectory Lane | DT11 8DT |
| Ridgeway Lane | DT11 8HB |
| Roman Way | DT11 0RH |
| Schelin Way | DT11 0TH |
| Seymer Close | DT11 0PH |
| Shaftesbury Road | DT11 8EQ |
| Shaston Road | DT11 8TA |
| Shroton Cross | DT11 8QG |
| Shroton Lane | DT11 8QP |
| Shute Lane | DT11 8LZ |
| South Holme | DT11 8TG |
| Spencer Gardens | DT11 0TL |
| St Nicholas Gardens | DT11 0QH |
| Station Road | DT11 0TU DT11 8EL |
| Stour Close | DT11 0SU |
| Telegraph Street | DT11 8QQ |
| The Butts | DT11 8ER |
| The Chalk | DT11 8NA |
| The Common | DT11 8QY |
| The Cross | DT11 0SP DT11 8ED |
| The Gardens | DT11 8QJ |
| The Glebe | DT11 8NE DT11 8PX |
| The Hollow | DT11 8EX DT11 8EY |
| The Laurels | DT11 8QF |
| The Paddocks | DT11 8PJ |
| Toll Bar | DT11 0SW |
| Tower Hill | DT11 8NH DT11 8NJ DT11 8NN DT11 8NQ DT11 8NW |
| Townsend | DT11 0SX |
| Trinity Close | DT11 8JZ |
| Upper Street | DT11 8EF DT11 8EG |
| Vale Cottages | DT11 0SS |
| Water Lane | DT11 0QB |
| Watery Lane | DT11 8NB |
| Wessex Avenue | DT11 0TG |
| White Pit | DT11 0SZ DT11 0TA |
| DT11 0QA DT11 0QE DT11 0QW DT11 0QY DT11 8EE DT11 8HH DT11 8HL DT11 8HQ DT11 8HW DT11 8LE DT11 8LT DT11 8LW DT11 8NF DT11 8PP DT11 8PW DT11 8PY DT11 8QD DT11 8QH DT11 8QU DT11 8QZ DT11 8RA |
Transport near Hill Forts
-
Gillingham (Dorset) Station
-
Templecombe Station
-
Tisbury Station
-
Sherborne Station
-
Moreton (Dorset) Station
- FAQ
- Price Paid By Year
- Property Type Price
Frequently asked questions about Hill Forts
What is the average price for a property for sale in Hill Forts?
The average price for a property for sale in Hill Forts is £477,848. This amount is 27% higher than the average price in Blandford Forum. There are 794 property listings for sale in Hill Forts.
What streets have the most expensive properties for sale in Hill Forts?
The streets with the most expensive properties for sale in Hill Forts are Brodham Way at an average of £970,000, Little Stream at an average of £825,000 and Bushes Road at an average of £810,000.
What streets have the most affordable properties for sale in Hill Forts?
The streets with the most affordable properties for sale in Hill Forts are Shaston Road at an average of £230,000, Schelin Way at an average of £250,000 and Jacobs Ladder at an average of £260,500.
Which train stations are available in or near Hill Forts?
Some of the train stations available in or near Hill Forts are Gillingham (Dorset), Templecombe and Tisbury.
Property Price Paid in Hill Forts by Year
The average sold property price by year was:
| Year | Average Sold Price | Price Change |
Sold Properties
|
|---|---|---|---|
| 2025 | £425,948 | -16% |
59 Properties |
| 2024 | £492,354 | -8% |
62 Properties |
| 2023 | £530,597 | 1% |
41 Properties |
| 2022 | £525,747 | 24% |
72 Properties |
| 2021 | £399,451 | -1% |
85 Properties |
| 2020 | £404,100 | -1% |
75 Properties |
| 2019 | £406,400 | 3% |
67 Properties |
| 2018 | £396,194 | 12% |
54 Properties |
| 2017 | £350,578 | 2% |
93 Properties |
| 2016 | £344,928 | -2% |
76 Properties |
| 2015 | £351,812 | -2% |
95 Properties |
| 2014 | £359,202 | 17% |
82 Properties |
| 2013 | £297,021 | -15% |
54 Properties |
| 2012 | £342,684 | 6% |
66 Properties |
| 2011 | £320,870 | -16% |
58 Properties |
| 2010 | £373,260 | 16% |
54 Properties |
| 2009 | £314,552 | -7% |
66 Properties |
| 2008 | £336,804 | -1% |
55 Properties |
| 2007 | £340,287 | 15% |
98 Properties |
| 2006 | £289,709 | -17% |
112 Properties |
| 2005 | £340,363 | 18% |
69 Properties |
| 2004 | £278,842 | 5% |
84 Properties |
| 2003 | £264,062 | 7% |
91 Properties |
| 2002 | £246,442 | 28% |
88 Properties |
| 2001 | £176,831 | -9% |
78 Properties |
| 2000 | £191,954 | 32% |
77 Properties |
| 1999 | £129,663 | 10% |
84 Properties |
| 1998 | £116,743 | 5% |
84 Properties |
| 1997 | £111,459 | 19% |
94 Properties |
| 1996 | £90,521 | -9% |
79 Properties |
| 1995 | £98,569 | - |
83 Properties |
Property Price per Property Type in Hill Forts
Here you can find historic sold price data in order to help with your property search.
The average Property Paid Price for specific property types in the last three years are:
| Property Type | Average Sold Price | Sold Properties |
|---|---|---|
| Semi Detached House | £383,120.00 | 39 Semi Detached Houses |
| Detached House | £620,392.00 | 79 Detached Houses |
| Terraced House | £303,750.00 | 41 Terraced Houses |
| Flat | £335,000.00 | 3 Flats |

