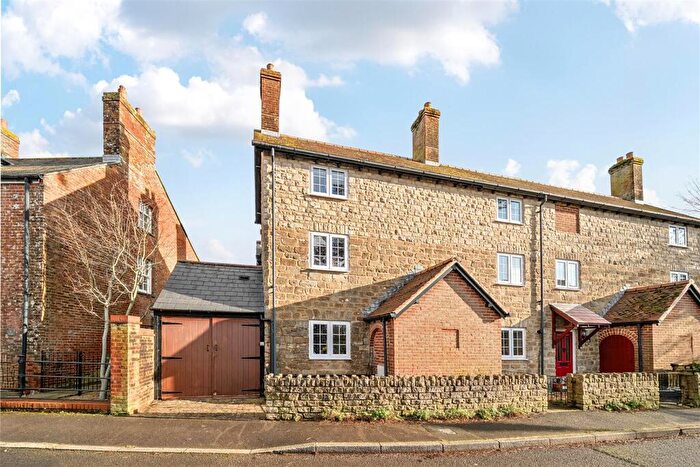
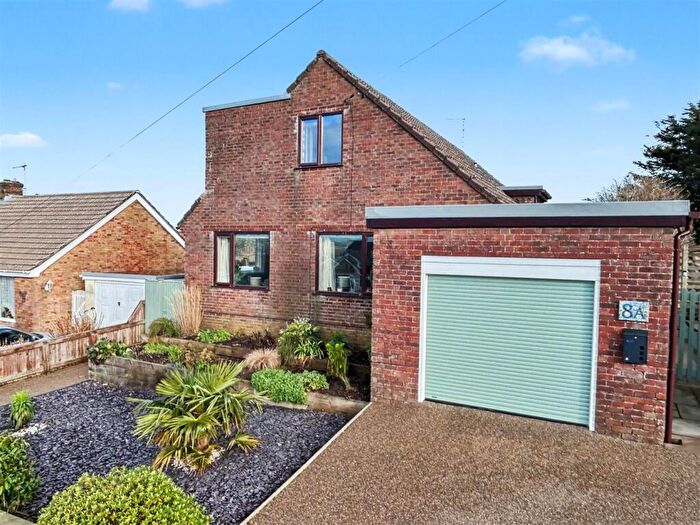
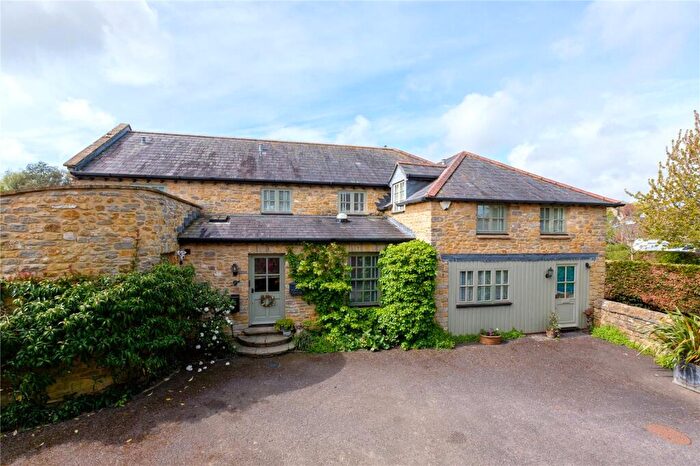
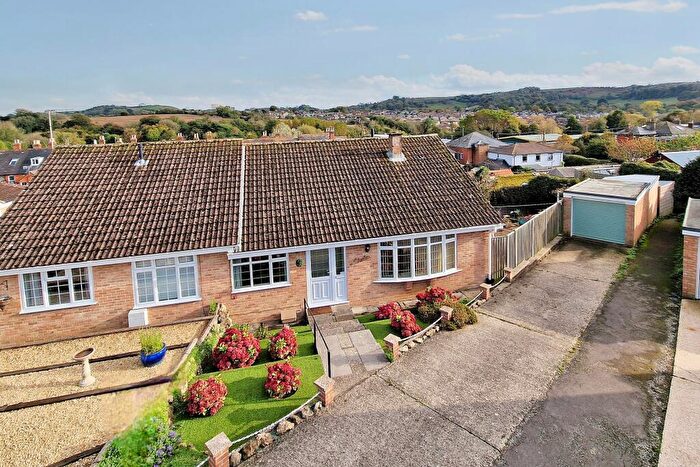
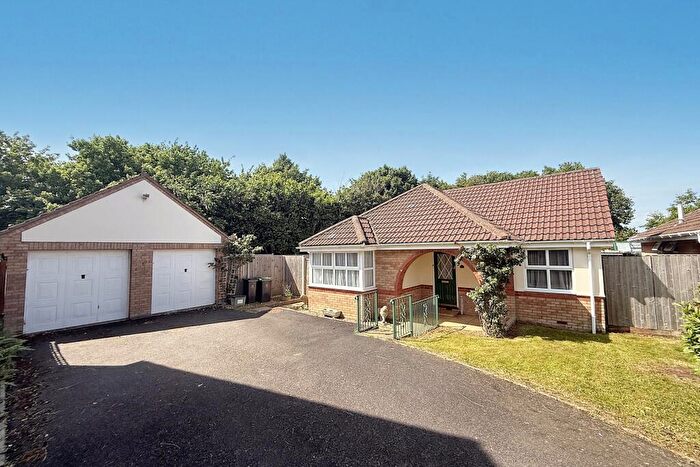
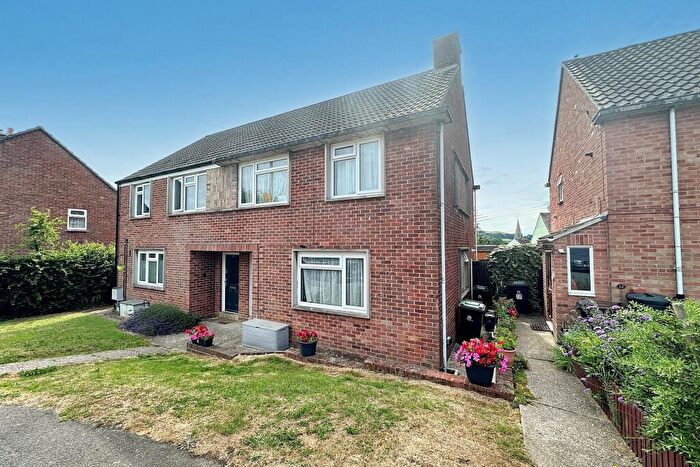
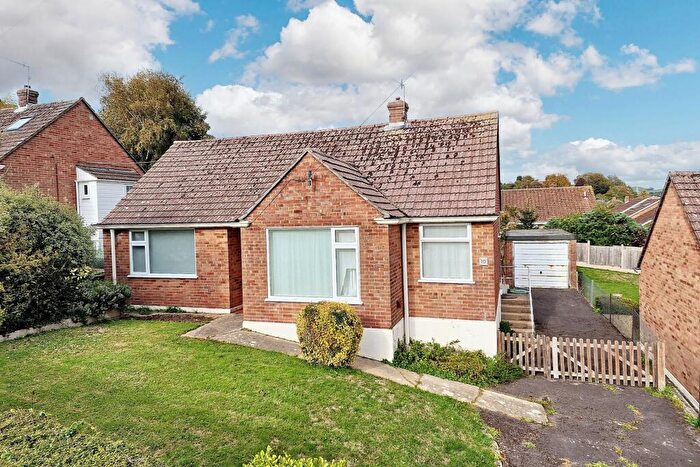
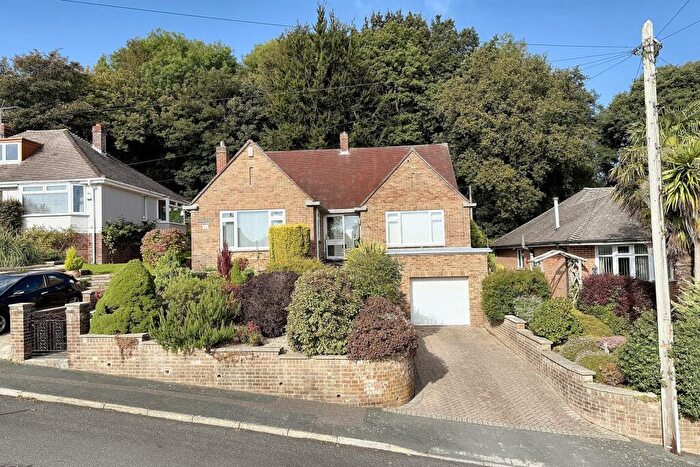
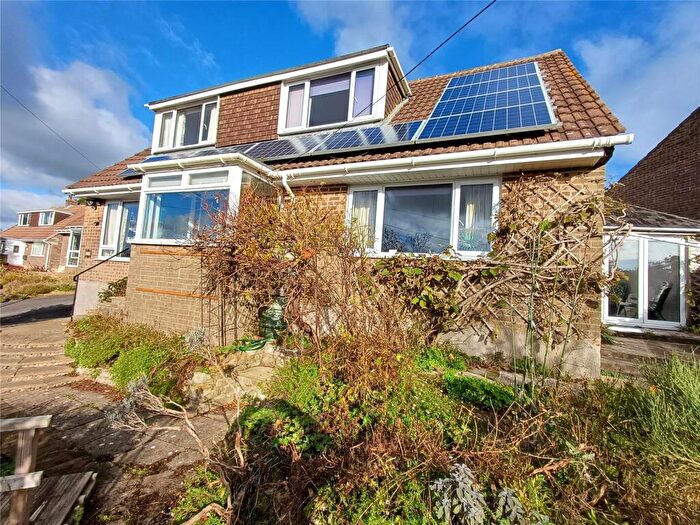
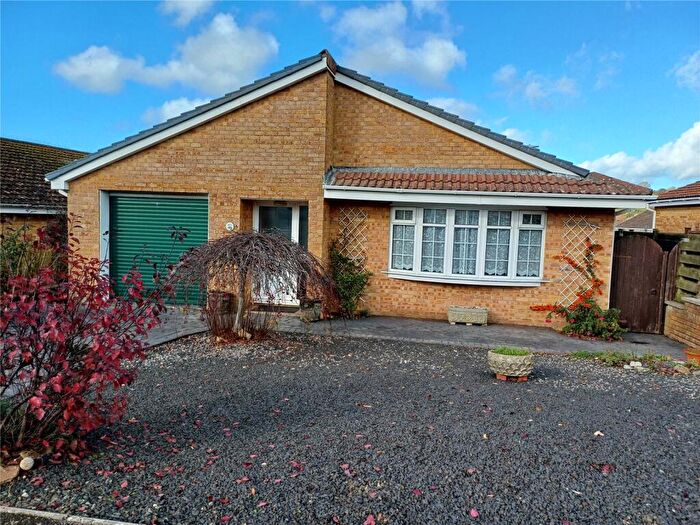
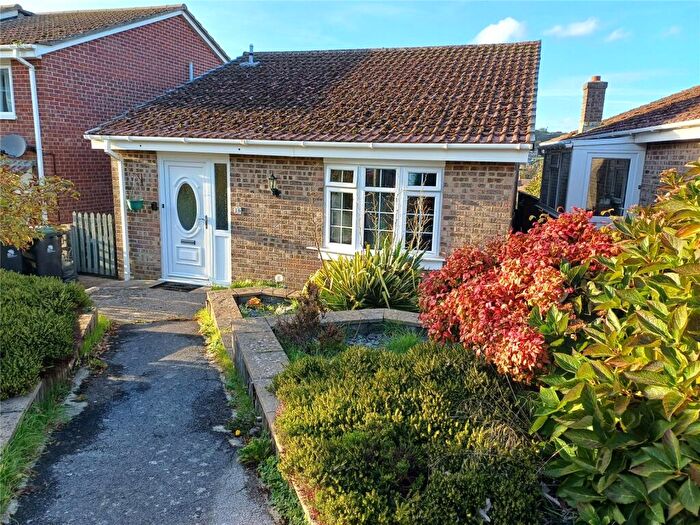
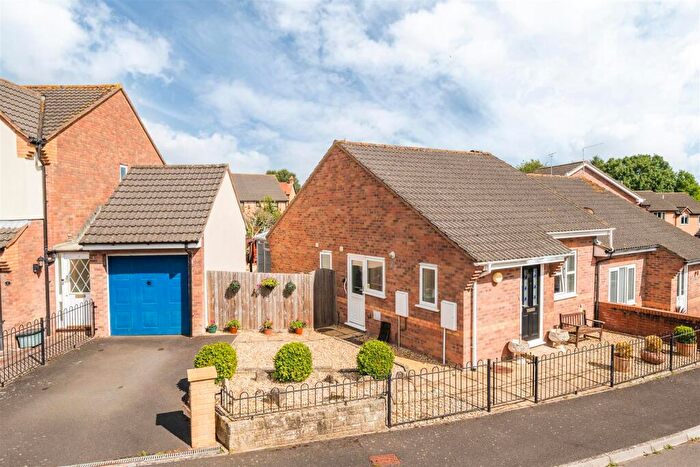
Houses for sale & to rent in Bradpole, Bridport
House Prices in Bradpole
Properties in Bradpole have an average house price of £384,103.00 and had 94 Property Transactions within the last 3 years¹.
Bradpole is an area in Bridport, Dorset with 927 households², where the most expensive property was sold for £1,575,000.00.
Properties for sale in Bradpole
Roads and Postcodes in Bradpole
Navigate through our locations to find the location of your next house in Bradpole, Bridport for sale or to rent.
| Streets | Postcodes |
|---|---|
| Banton Shard | DT6 3EB |
| Bath Orchard | DT6 3FD |
| Blind Lane Close | DT6 3FE |
| Caley Way | DT6 3HD |
| Church Close | DT6 3EW |
| Corbin Way | DT6 3UX |
| Court Close | DT6 3EH DT6 3EJ DT6 3EL DT6 3EQ |
| Dodhams Farm Close | DT6 3EZ |
| Dodhams Lane | DT6 3DY |
| Drew Close | DT6 3JG |
| East Road | DT6 4AG DT6 4AL |
| Fishweir Lane | DT6 3HN DT6 3XW |
| Fishweir Terrace | DT6 3HW |
| Forsters Lane | DT6 3HY |
| Fox Close | DT6 3JF |
| Gladstone Close | DT6 4EF |
| Gordon Terrace | DT6 3HT |
| Gore Cross Way | DT6 3EN |
| Gore Lane | DT6 3JE |
| Gore Terrace | DT6 3JD |
| Happy Island Way | DT6 4JZ |
| Hemlets Close | DT6 3FB |
| Higher Street | DT6 3HZ DT6 3JA |
| Hill View | DT6 3EF |
| Jessopp Avenue | DT6 4AN DT6 4AS DT6 4AT DT6 4ES |
| King Charles Way | DT6 4AH |
| King William Head | DT6 3EA |
| Kings Head Hill | DT6 3DZ |
| Kingsnorth Close | DT6 4BZ |
| Lee Lane | DT6 4AJ DT6 4AP |
| Mangerton Lane | DT6 3SF |
| Middle Street | DT6 3HS DT6 3HU DT6 3HX |
| Newfoundland | DT6 3JB |
| Norman Close | DT6 4ET |
| Old School Houses | DT6 3EP |
| Pageant Close | DT6 3EG |
| Queenwell | DT6 5PG |
| Railway Crossing | DT6 4AR |
| Ridgeway | DT6 3ED |
| Spring Close | DT6 3XL |
| St James Park | DT6 3UR |
| Stuart Way | DT6 4AU |
| Suttil Crescent | DT6 5QU |
| The Buildings | DT6 5PN |
| Thread Mill Lane | DT6 5QT |
| Townsend Way | DT6 3FA |
| Trinity Way | DT6 3XJ DT6 3XN |
| Village Road | DT6 3ES |
| Warne Hill | DT6 4AQ |
| Willow Way | DT6 4RU |
| DT6 3TS |
Transport near Bradpole
-
Maiden Newton Station
-
Crewkerne Station
-
Chetnole Station
-
Axminster Station
-
Yetminster Station
-
Dorchester West Station
-
Thornford Station
-
Dorchester South Station
-
Yeovil Junction Station
-
Upwey Station
- FAQ
- Price Paid By Year
- Property Type Price
Frequently asked questions about Bradpole
What is the average price for a property for sale in Bradpole?
The average price for a property for sale in Bradpole is £384,103. This amount is 9% lower than the average price in Bridport. There are 449 property listings for sale in Bradpole.
What streets have the most expensive properties for sale in Bradpole?
The streets with the most expensive properties for sale in Bradpole are Forsters Lane at an average of £1,167,500, Gore Lane at an average of £813,500 and Queenwell at an average of £700,000.
What streets have the most affordable properties for sale in Bradpole?
The streets with the most affordable properties for sale in Bradpole are St James Park at an average of £183,333, Newfoundland at an average of £235,000 and Court Close at an average of £243,000.
Which train stations are available in or near Bradpole?
Some of the train stations available in or near Bradpole are Maiden Newton, Crewkerne and Chetnole.
Property Price Paid in Bradpole by Year
The average sold property price by year was:
| Year | Average Sold Price | Price Change |
Sold Properties
|
|---|---|---|---|
| 2025 | £376,821 | -21% |
28 Properties |
| 2024 | £456,460 | 29% |
32 Properties |
| 2023 | £322,000 | -28% |
34 Properties |
| 2022 | £411,483 | 16% |
31 Properties |
| 2021 | £346,050 | 16% |
64 Properties |
| 2020 | £292,125 | 4% |
34 Properties |
| 2019 | £280,954 | -23% |
34 Properties |
| 2018 | £344,591 | 13% |
37 Properties |
| 2017 | £301,460 | 11% |
52 Properties |
| 2016 | £267,481 | 3% |
56 Properties |
| 2015 | £259,362 | 12% |
48 Properties |
| 2014 | £228,040 | -13% |
45 Properties |
| 2013 | £256,838 | 12% |
42 Properties |
| 2012 | £226,522 | 2% |
37 Properties |
| 2011 | £221,079 | -11% |
34 Properties |
| 2010 | £246,051 | 8% |
38 Properties |
| 2009 | £225,456 | -4% |
36 Properties |
| 2008 | £234,000 | -1% |
25 Properties |
| 2007 | £237,012 | 6% |
67 Properties |
| 2006 | £221,961 | -1% |
72 Properties |
| 2005 | £224,779 | 7% |
49 Properties |
| 2004 | £209,220 | 9% |
58 Properties |
| 2003 | £189,437 | 19% |
70 Properties |
| 2002 | £153,963 | 21% |
59 Properties |
| 2001 | £121,711 | 11% |
63 Properties |
| 2000 | £108,712 | 15% |
37 Properties |
| 1999 | £91,896 | 12% |
64 Properties |
| 1998 | £80,611 | 7% |
102 Properties |
| 1997 | £74,638 | 16% |
95 Properties |
| 1996 | £62,326 | -17% |
47 Properties |
| 1995 | £73,095 | - |
33 Properties |
Property Price per Property Type in Bradpole
Here you can find historic sold price data in order to help with your property search.
The average Property Paid Price for specific property types in the last three years are:
| Property Type | Average Sold Price | Sold Properties |
|---|---|---|
| Semi Detached House | £340,673.00 | 13 Semi Detached Houses |
| Detached House | £479,275.00 | 49 Detached Houses |
| Terraced House | £273,944.00 | 27 Terraced Houses |
| Flat | £159,200.00 | 5 Flats |

