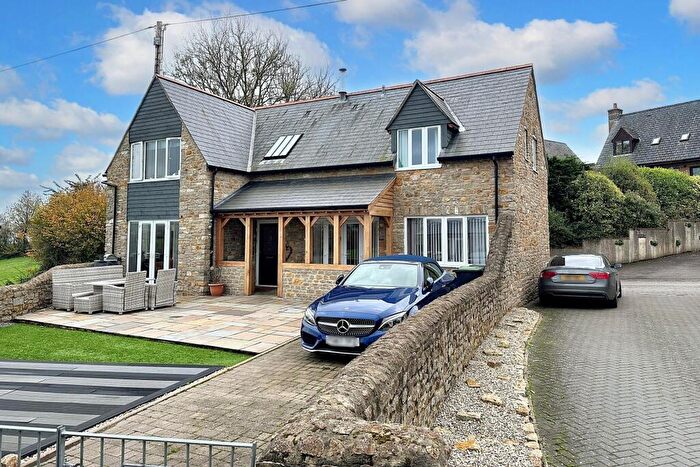
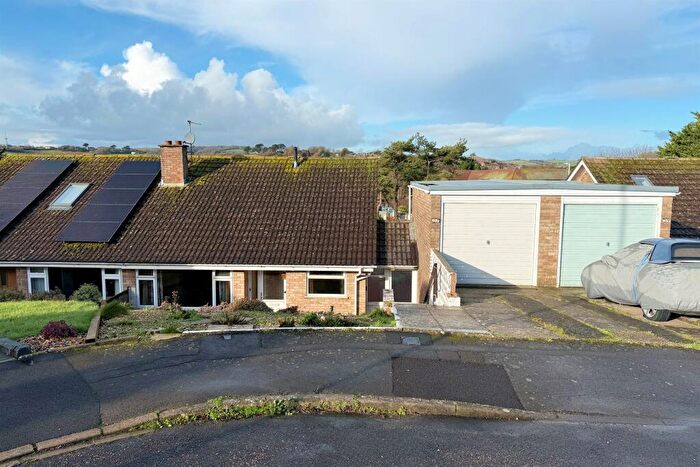
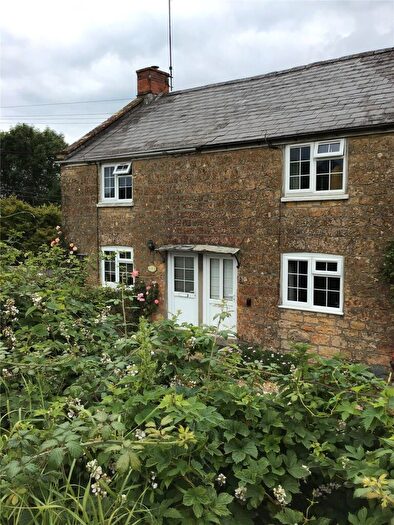
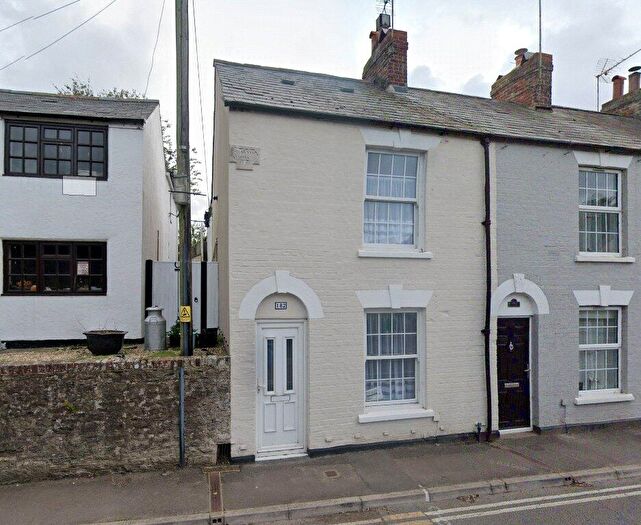
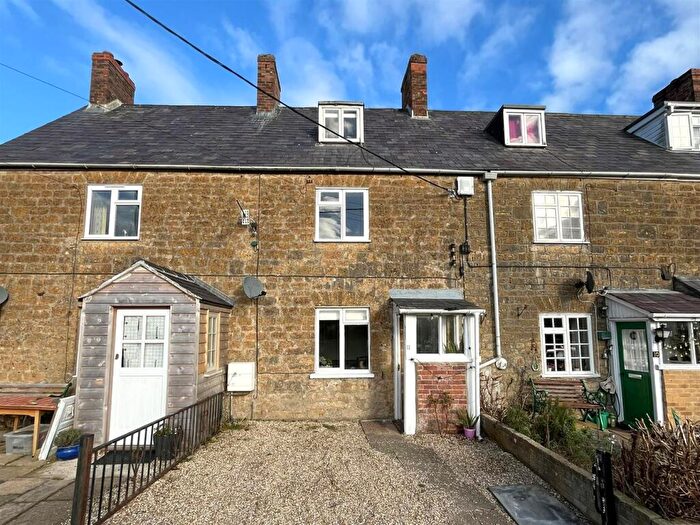
Houses for sale & to rent in Netherbury, Bridport
House Prices in Netherbury
Properties in Netherbury have an average house price of £408,851.00 and had 58 Property Transactions within the last 3 years¹.
Netherbury is an area in Bridport, Dorset with 835 households², where the most expensive property was sold for £1,250,000.00.
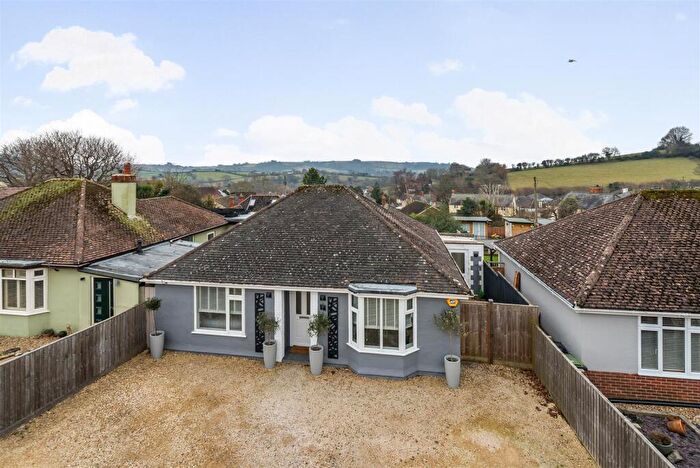
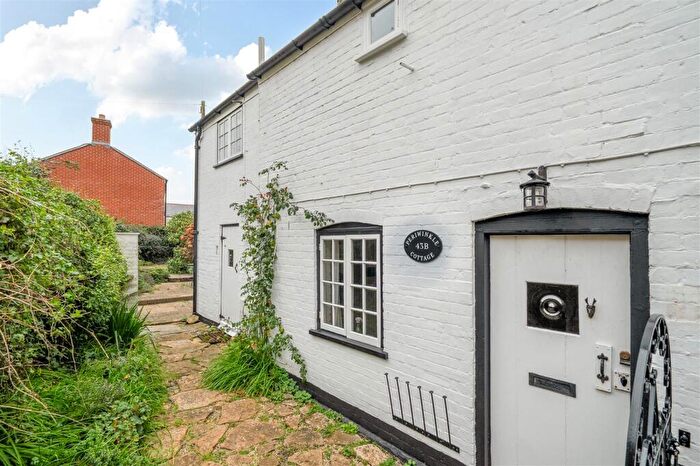
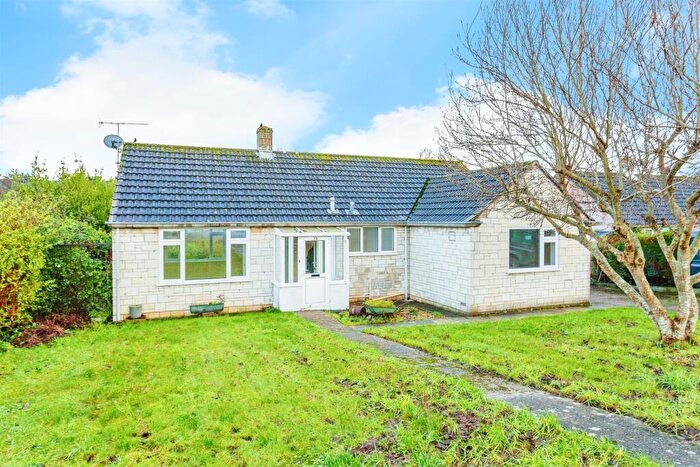
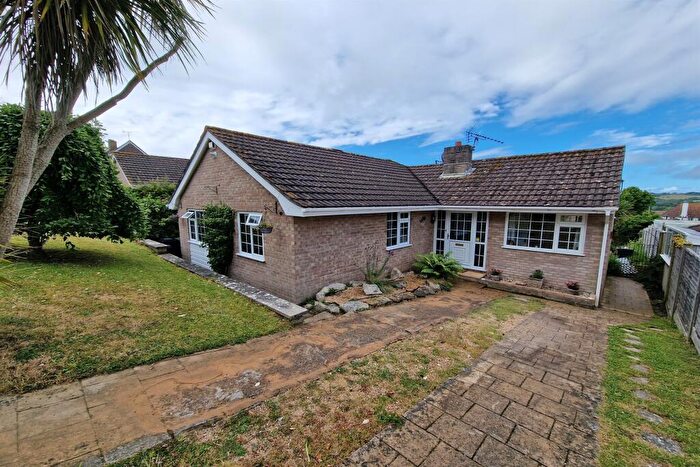
Properties for sale in Netherbury
Roads and Postcodes in Netherbury
Navigate through our locations to find the location of your next house in Netherbury, Bridport for sale or to rent.
| Streets | Postcodes |
|---|---|
| Ash Lane | DT6 5JA |
| Binghams Farm Cottages | DT6 3TT |
| Bridge Street | DT6 5LS DT6 5LU |
| Buckhorn Close | DT6 3UZ |
| Chantry Street | DT6 5NB |
| Chantry Walk | DT6 5PD |
| Cherry Tree | DT6 5HH DT6 5HQ |
| Crook Hill | DT6 5LY |
| Dottery Cottages | DT6 5PT |
| Dottery Lane | DT6 5FE |
| Drury Lane | DT6 5LZ |
| Fir Tree Close | DT6 5JP |
| Follet Close | DT6 5JH |
| Foundry Close | DT6 5JT |
| Highfield Gardens | DT6 5LT |
| Houndsell Way | DT6 5QX |
| Laurel Close | DT6 5RQ |
| Lodge Lane | DT6 5QR |
| Longhayes Avenue | DT6 5HN |
| Mapperton Lane | DT6 3UE DT6 3UF |
| Mead Fields | DT6 5RE DT6 5RF |
| Morbae Grove | DT6 5SA |
| Neddys Close | DT6 5RH |
| North Allington | DT6 5EE |
| Oxbridge | DT6 3TZ DT6 3UA DT6 3UB |
| Pineapple Lane | DT6 5HY DT6 5HZ |
| Pitchers | DT6 5QS |
| Pond End | DT6 5SB |
| Pymore Island | DT6 5SD |
| Pymore Lane | DT6 5PS |
| Pymore Terrace | DT6 5PH |
| Quarrs Close | DT6 5JQ |
| Salway Drive | DT6 5LD |
| Simene Close | DT6 5JS |
| St James Road | DT6 5LL DT6 5LP DT6 5LW |
| St Lukes Court | DT6 5RG |
| Stevens Close | DT6 5RT |
| Tower Hill | DT6 5ND |
| Watton View | DT6 5QZ |
| West Mead | DT6 5RU DT6 5RX |
| West Road | DT6 5JR |
| Whitecross | DT6 5NH |
| DT6 3SG DT6 3TU DT6 3UD DT6 3UH DT6 3UQ DT6 5HP DT6 5HR DT6 5HS DT6 5HT DT6 5HU DT6 5HX DT6 5JB DT6 5JE DT6 5JF DT6 5JG DT6 5JN DT6 5LE DT6 5LF DT6 5LG DT6 5LJ DT6 5LQ DT6 5LR DT6 5NG DT6 5NQ DT6 5PL DT6 5PU DT6 5SH |
Transport near Netherbury
-
Crewkerne Station
-
Maiden Newton Station
-
Chetnole Station
-
Axminster Station
-
Yetminster Station
-
Yeovil Junction Station
-
Thornford Station
-
Yeovil Pen Mill Station
-
Dorchester West Station
-
Dorchester South Station
- FAQ
- Price Paid By Year
- Property Type Price
Frequently asked questions about Netherbury
What is the average price for a property for sale in Netherbury?
The average price for a property for sale in Netherbury is £408,851. This amount is 3% lower than the average price in Bridport. There are 1,342 property listings for sale in Netherbury.
What streets have the most expensive properties for sale in Netherbury?
The streets with the most expensive properties for sale in Netherbury are Oxbridge at an average of £841,750, St James Road at an average of £642,800 and Foundry Close at an average of £600,000.
What streets have the most affordable properties for sale in Netherbury?
The streets with the most affordable properties for sale in Netherbury are Pymore Island at an average of £180,000, Pymore Terrace at an average of £217,900 and Mead Fields at an average of £250,000.
Which train stations are available in or near Netherbury?
Some of the train stations available in or near Netherbury are Crewkerne, Maiden Newton and Chetnole.
Property Price Paid in Netherbury by Year
The average sold property price by year was:
| Year | Average Sold Price | Price Change |
Sold Properties
|
|---|---|---|---|
| 2025 | £449,269 | 25% |
26 Properties |
| 2024 | £337,023 | -23% |
16 Properties |
| 2023 | £415,000 | -4% |
16 Properties |
| 2022 | £431,159 | -6% |
22 Properties |
| 2021 | £458,522 | 29% |
42 Properties |
| 2020 | £327,831 | -7% |
30 Properties |
| 2019 | £351,431 | 2% |
29 Properties |
| 2018 | £343,126 | 9% |
29 Properties |
| 2017 | £312,794 | 3% |
34 Properties |
| 2016 | £304,668 | -10% |
42 Properties |
| 2015 | £336,355 | 19% |
39 Properties |
| 2014 | £272,610 | 4% |
39 Properties |
| 2013 | £261,928 | -15% |
35 Properties |
| 2012 | £300,315 | 6% |
22 Properties |
| 2011 | £282,611 | 14% |
29 Properties |
| 2010 | £243,844 | -4% |
36 Properties |
| 2009 | £253,697 | 11% |
40 Properties |
| 2008 | £226,419 | -17% |
13 Properties |
| 2007 | £264,522 | 1% |
43 Properties |
| 2006 | £262,901 | -1% |
54 Properties |
| 2005 | £265,189 | 11% |
55 Properties |
| 2004 | £237,314 | -2% |
76 Properties |
| 2003 | £242,442 | 34% |
48 Properties |
| 2002 | £158,886 | -11% |
37 Properties |
| 2001 | £176,408 | 20% |
40 Properties |
| 2000 | £141,489 | 28% |
68 Properties |
| 1999 | £101,335 | 1% |
56 Properties |
| 1998 | £100,050 | 12% |
32 Properties |
| 1997 | £88,163 | 2% |
74 Properties |
| 1996 | £86,752 | 14% |
44 Properties |
| 1995 | £74,964 | - |
34 Properties |
Property Price per Property Type in Netherbury
Here you can find historic sold price data in order to help with your property search.
The average Property Paid Price for specific property types in the last three years are:
| Property Type | Average Sold Price | Sold Properties |
|---|---|---|
| Semi Detached House | £295,250.00 | 10 Semi Detached Houses |
| Detached House | £557,056.00 | 28 Detached Houses |
| Terraced House | £269,392.00 | 16 Terraced Houses |
| Flat | £213,250.00 | 4 Flats |

