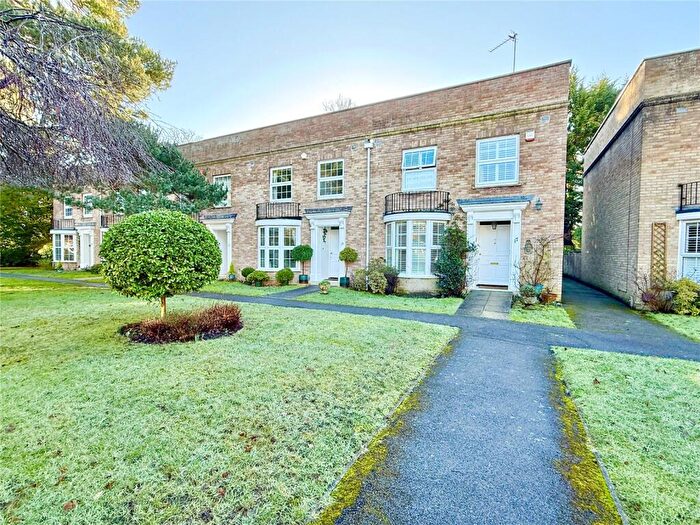
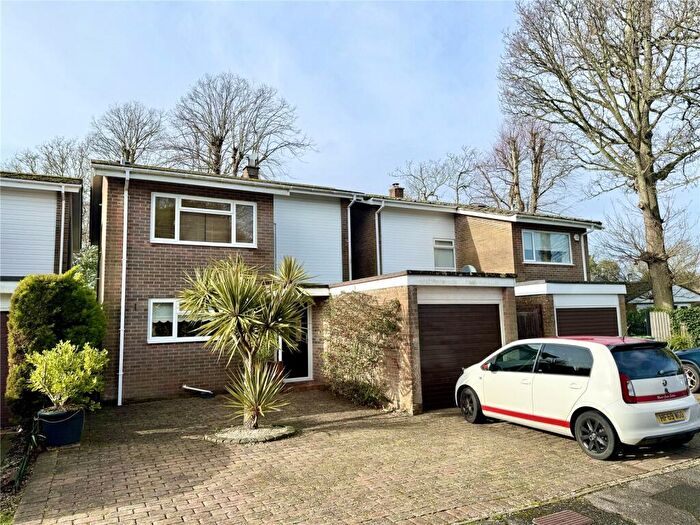
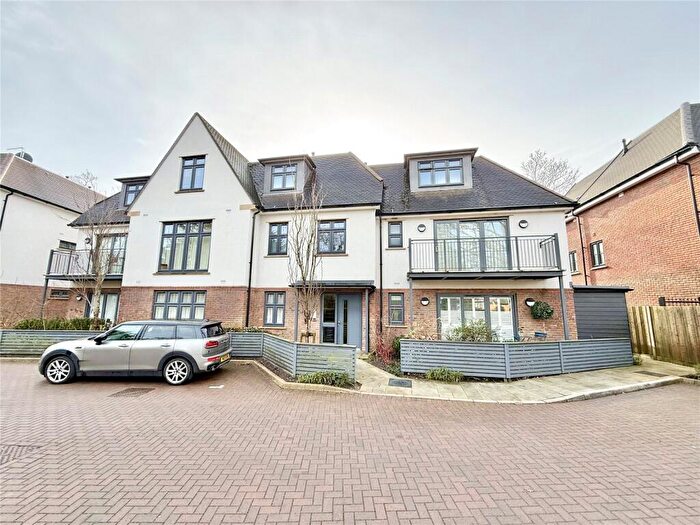
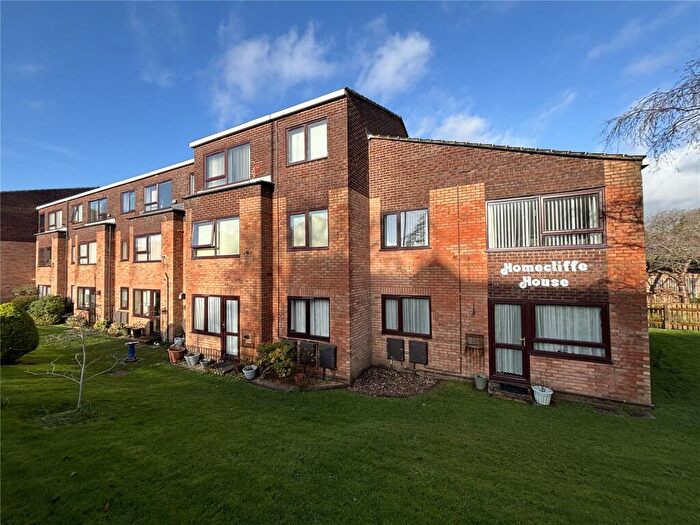
Houses for sale & to rent in Highcliffe, Christchurch
House Prices in Highcliffe
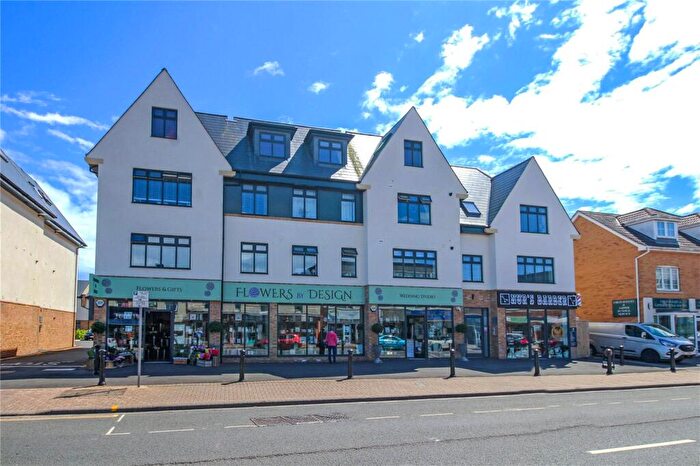
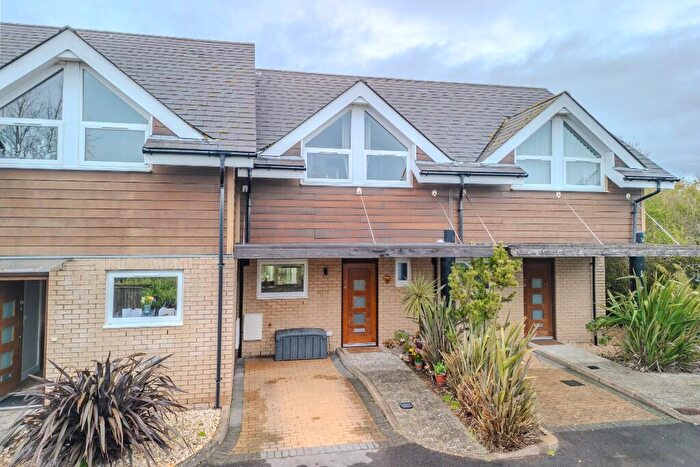
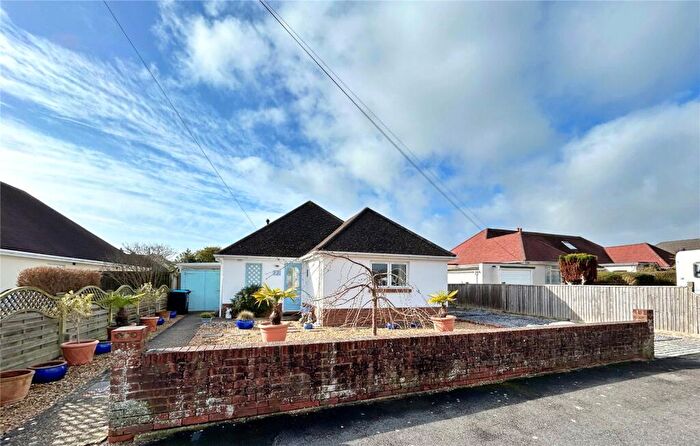
Properties in Highcliffe have an average house price of £452,798.00 and had 351 Property Transactions within the last 3 years¹.
Highcliffe is an area in Christchurch, Dorset with 1,819 households², where the most expensive property was sold for £3,000,000.00.
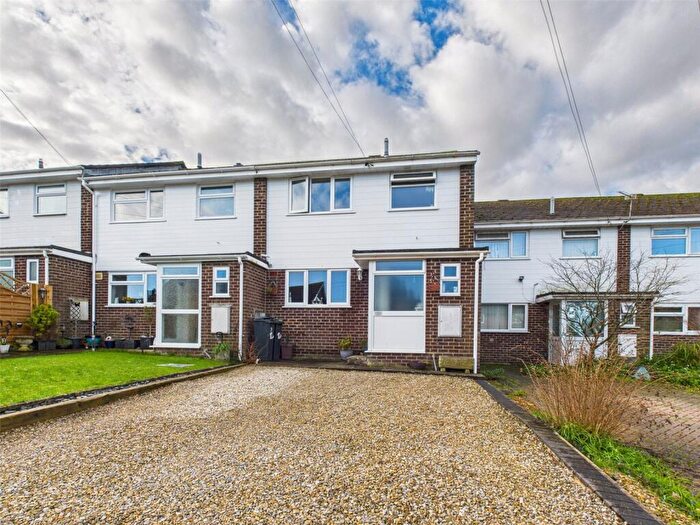
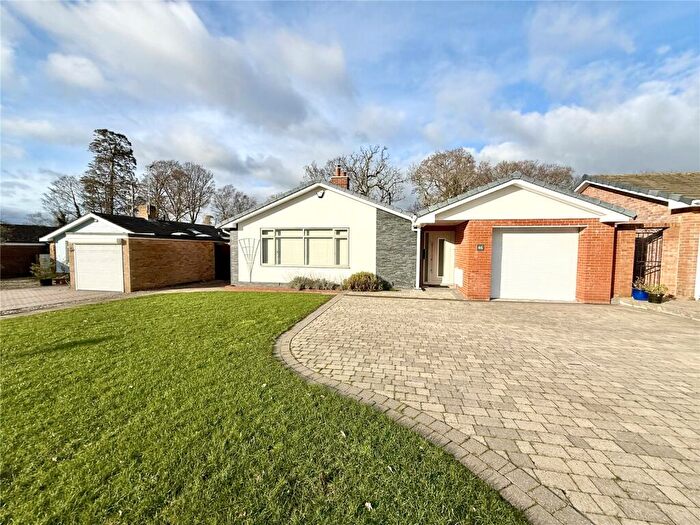
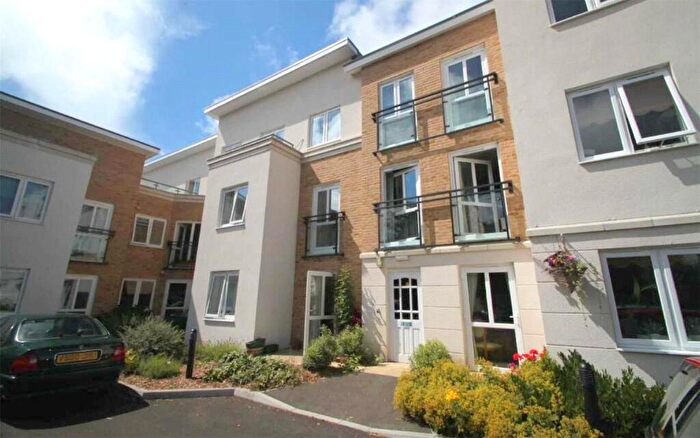
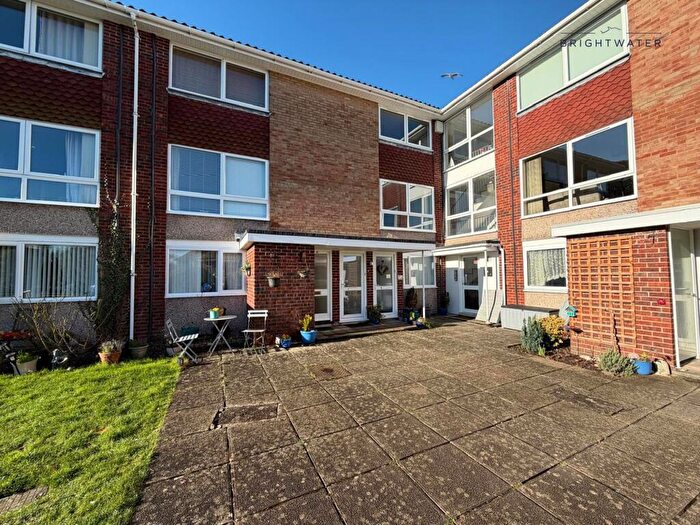
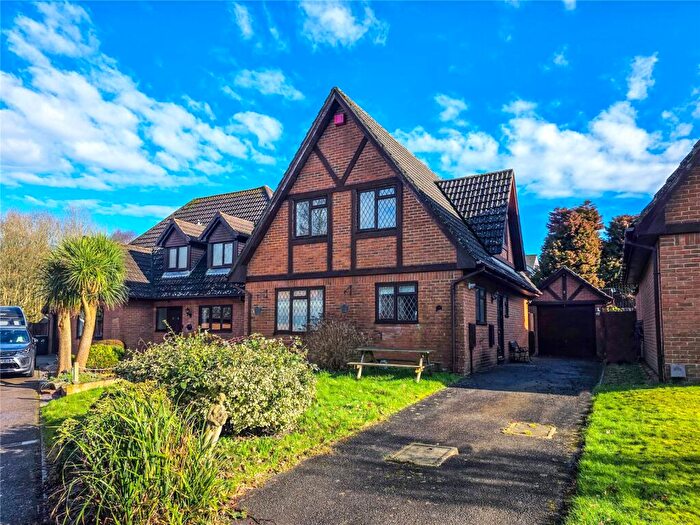
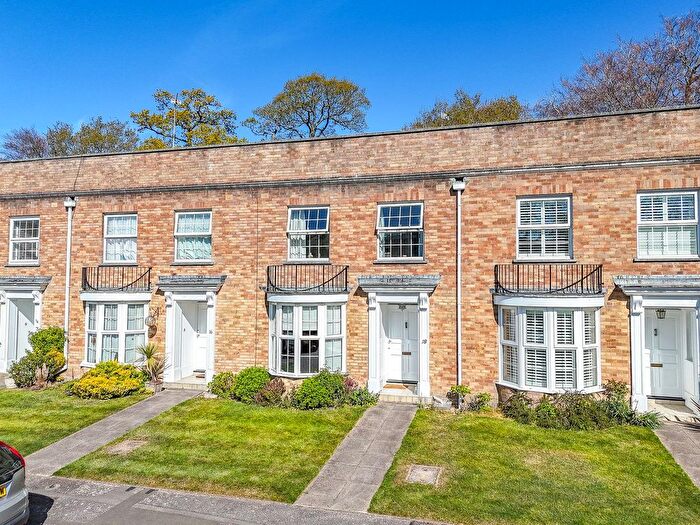
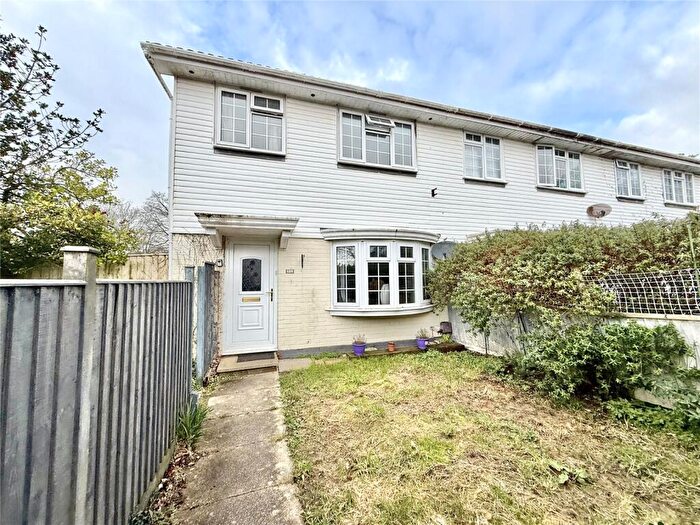
Properties for sale in Highcliffe
Roads and Postcodes in Highcliffe
Navigate through our locations to find the location of your next house in Highcliffe, Christchurch for sale or to rent.
| Streets | Postcodes |
|---|---|
| Abbots Close | BH23 5BH |
| Abingdon Drive | BH23 5JY BH23 5JZ |
| Amberley Close | BH23 5AR |
| Angeline Close | BH23 5BS |
| Arundel Way | BH23 5DX |
| Barberry Court | BH23 5TD |
| Beacon Drive | BH23 5BY BH23 5DH |
| Braemar Drive | BH23 5NL BH23 5NN BH23 5NW |
| Buce Hayes Close | BH23 5HJ |
| Bute Drive | BH23 5LE |
| Chewton Common Road | BH23 5LT BH23 5LU |
| Chewton Lodge | BH23 5LQ |
| Colemere Gardens | BH23 5AS |
| Crispin Close | BH23 5BT |
| Denham Drive | BH23 5AT |
| Earlsdon Way | BH23 5AU BH23 5TB |
| Elmwood Way | BH23 5DL |
| Felton Crescent | BH23 5AX |
| Germaine Close | BH23 5BU |
| Gordon Road | BH23 5HN |
| Greenways | BH23 5AZ BH23 5BA BH23 5BB BH23 5BD |
| Haslemere Avenue | BH23 5BQ |
| Hinton Wood Avenue | BH23 5AA BH23 5AB BH23 5AD |
| Holme Road | BH23 5LJ |
| Imber Drive | BH23 5BE BH23 5BG |
| Jesmond Avenue | BH23 5AY |
| Julia Close | BH23 5BX |
| Kilmington Way | BH23 5BL |
| Loraine Avenue | BH23 5LB |
| Lyme Crescent | BH23 5BJ |
| Lymington Road | BH23 4JS BH23 5DZ BH23 5EB BH23 5EG BH23 5EN BH23 5EP BH23 5ET BH23 5EW BH23 5EY BH23 5HD BH23 5HE BH23 5HF BH23 5HG |
| Maple Close | BH23 5BZ |
| Merley Drive | BH23 5BN BH23 5BW |
| Mill Lane | BH23 5LA |
| Montagu Road | BH23 5JT BH23 5JU BH23 5JX |
| Norleywood | BH23 5TA |
| Oakleigh Way | BH23 5DQ |
| Poplar Close | BH23 5HR |
| Ranelagh Road | BH23 5DY |
| Redan Close | BH23 5DJ |
| Rothesay Drive | BH23 4LB BH23 4LD BH23 4LE |
| Seaton Close | BH23 5HP |
| Seaton Road | BH23 5HW |
| Stanley Road | BH23 5HL |
| Stuart Road | BH23 5HQ BH23 5JS BH23 5PP |
| Studley Close | BH23 5LD |
| Sylvan Wood | BH23 4FJ |
| The Lawns | BH23 5LF |
| Waterford Gardens | BH23 5DP BH23 5DW BH23 5LH |
| Waterford Place | BH23 5HS BH23 5HT BH23 5HU BH23 5HX BH23 5HY BH23 5HZ BH23 5LG |
| Waterford Road | BH23 5JA BH23 5JL BH23 5JP BH23 5JR BH23 5JW |
| Wharncliffe Gardens | BH23 5DN |
| Wharncliffe Road | BH23 5DA BH23 5DB BH23 5DD BH23 5DE BH23 5DF BH23 5DG BH23 5UA BH23 5UB |
| Wortley Road | BH23 5DR BH23 5DS BH23 5DT BH23 5DU BH23 5GJ |
Transport near Highcliffe
- FAQ
- Price Paid By Year
- Property Type Price
Frequently asked questions about Highcliffe
What is the average price for a property for sale in Highcliffe?
The average price for a property for sale in Highcliffe is £452,798. This amount is 0.03% higher than the average price in Christchurch. There are 785 property listings for sale in Highcliffe.
What streets have the most expensive properties for sale in Highcliffe?
The streets with the most expensive properties for sale in Highcliffe are Rothesay Drive at an average of £1,521,500, Hinton Wood Avenue at an average of £995,000 and Chewton Common Road at an average of £975,000.
What streets have the most affordable properties for sale in Highcliffe?
The streets with the most affordable properties for sale in Highcliffe are The Lawns at an average of £218,318, Waterford Place at an average of £258,043 and Holme Road at an average of £262,500.
Which train stations are available in or near Highcliffe?
Some of the train stations available in or near Highcliffe are Hinton Admiral, New Milton and Christchurch.
Property Price Paid in Highcliffe by Year
The average sold property price by year was:
| Year | Average Sold Price | Price Change |
Sold Properties
|
|---|---|---|---|
| 2025 | £463,159 | 7% |
98 Properties |
| 2024 | £428,691 | -10% |
130 Properties |
| 2023 | £470,021 | -7% |
123 Properties |
| 2022 | £505,063 | 25% |
136 Properties |
| 2021 | £378,248 | -0,5% |
203 Properties |
| 2020 | £380,084 | 1% |
120 Properties |
| 2019 | £376,992 | 2% |
116 Properties |
| 2018 | £367,722 | -1% |
113 Properties |
| 2017 | £371,474 | 7% |
148 Properties |
| 2016 | £343,820 | 11% |
157 Properties |
| 2015 | £307,005 | -8% |
177 Properties |
| 2014 | £331,396 | 16% |
138 Properties |
| 2013 | £277,276 | -9% |
135 Properties |
| 2012 | £302,890 | -3% |
103 Properties |
| 2011 | £310,537 | 1% |
95 Properties |
| 2010 | £307,080 | 23% |
105 Properties |
| 2009 | £237,133 | -17% |
145 Properties |
| 2008 | £278,334 | -5% |
110 Properties |
| 2007 | £292,380 | 16% |
234 Properties |
| 2006 | £246,702 | -11% |
197 Properties |
| 2005 | £274,540 | 4% |
110 Properties |
| 2004 | £262,975 | 9% |
148 Properties |
| 2003 | £239,202 | 15% |
119 Properties |
| 2002 | £202,137 | 10% |
133 Properties |
| 2001 | £181,804 | 14% |
152 Properties |
| 2000 | £156,710 | 22% |
112 Properties |
| 1999 | £122,474 | 15% |
167 Properties |
| 1998 | £104,574 | 5% |
125 Properties |
| 1997 | £99,156 | 15% |
131 Properties |
| 1996 | £84,489 | 4% |
150 Properties |
| 1995 | £81,239 | - |
137 Properties |
Property Price per Property Type in Highcliffe
Here you can find historic sold price data in order to help with your property search.
The average Property Paid Price for specific property types in the last three years are:
| Property Type | Average Sold Price | Sold Properties |
|---|---|---|
| Semi Detached House | £589,525.00 | 14 Semi Detached Houses |
| Detached House | £749,217.00 | 112 Detached Houses |
| Terraced House | £387,666.00 | 15 Terraced Houses |
| Flat | £290,244.00 | 210 Flats |

