
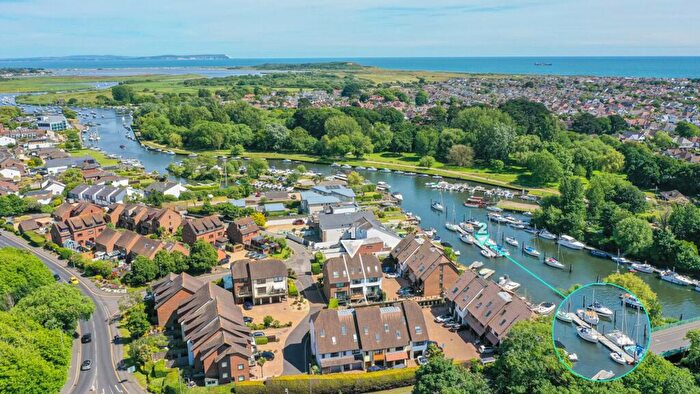
Houses for sale in Christchurch, Dorset
House Prices in Christchurch
Properties in Christchurch have an average house price of £451k and had 2,484 Property Transactions within the last 3 years.¹
Christchurch is an area in Dorset with 22,838 households², where the most expensive property was sold for £4.13M.
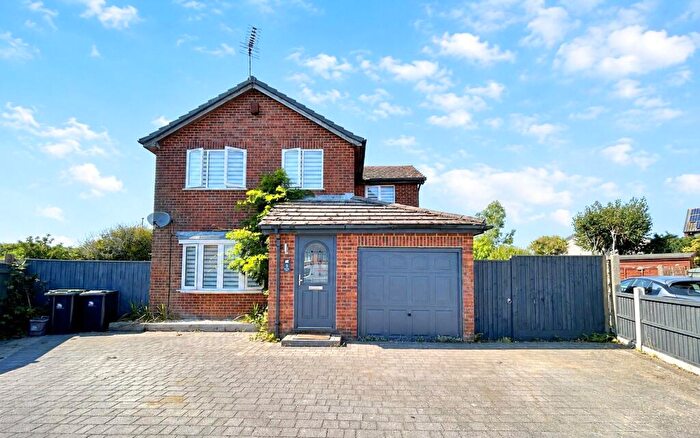
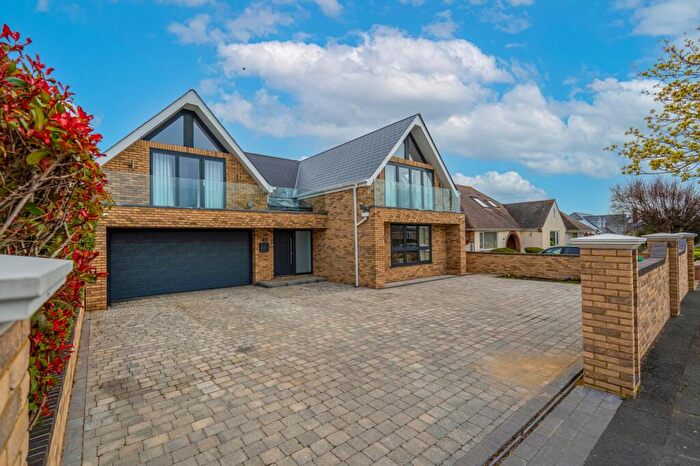
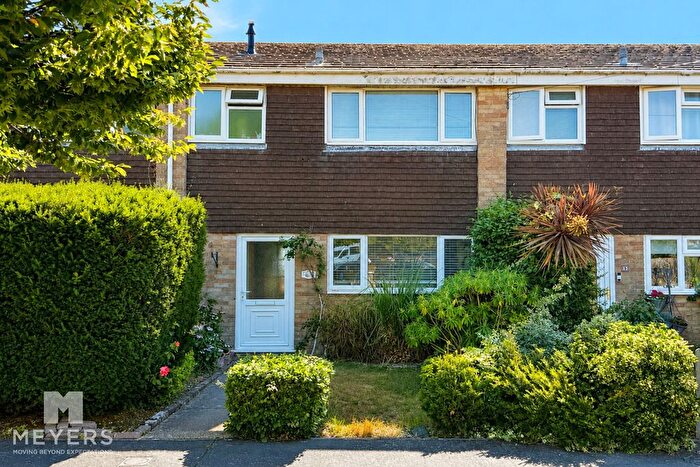
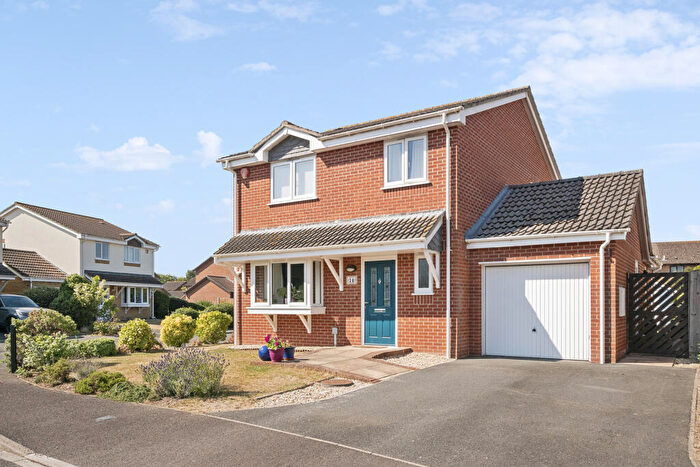
Properties for sale in Christchurch
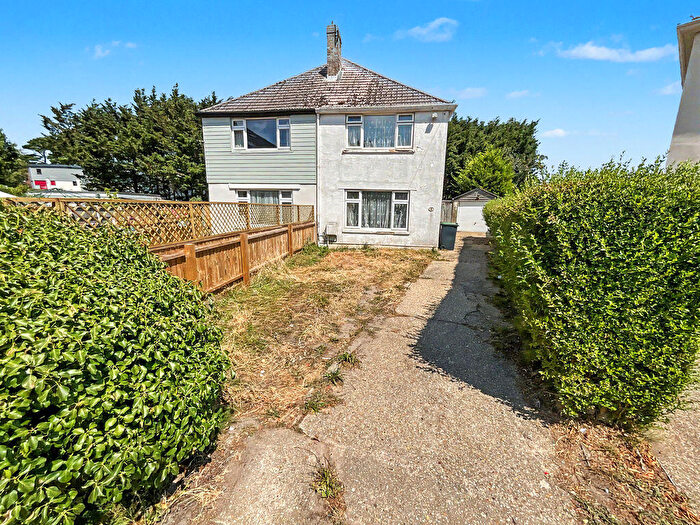
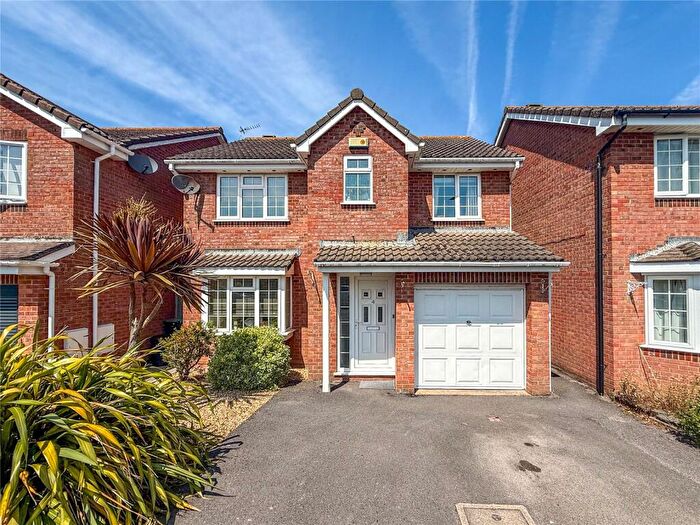
![]()
If you are looking to sell your house, let it out, or receive a property valuation, an expert can help you.
Click the button below to get started.

Neighbourhoods in Christchurch
Navigate through our locations to find the location of your next house in Christchurch, Dorset for sale or to rent.
- Burton And Winkton
- Grange
- Highcliffe
- Jumpers
- Mudeford And Friars Cliff
- North Highcliffe And Walkford
- Portfield
- Purewell And Stanpit
- St Catherines And Hurn
- Town Centre
- West Highcliffe
- Christchurch Town
- Commons
- Burton & Grange
- Mudeford, Stanpit & West Highcliffe
- Highcliffe & Walkford
- St Leonards & St Ives
Property price trends in Christchurch
According to the latest Land Registry data, the average home in Christchurch sold for £384,208 in 2026. That figure comes from a substantial record of 34,393 sales logged over the past 31 years.
Prices have fallen back over the last three years. Compared with 2023, when the typical sale came in around £447,074, that's a fall of roughly 14.1%.
Looking back five years, average prices are down about 7.1% since 2021, a drop of around £29,192 in cash terms.
Zoom out to the past decade for the fuller picture. Back in 2016, homes here averaged £348,709, so the typical sold price has climbed about 10.2% since then, roughly 1% a year. Stretch the view to fifteen years and that annual pace edges up closer to 2.1%.
Frequently asked questions about Christchurch
What is the average price for a property for sale in Christchurch?
The average price for a property for sale in Christchurch is £451,432. This amount is 15% higher than the average price in Dorset. There are more than 10,000 property listings for sale in Christchurch.
What locations have the most expensive properties for sale in Christchurch?
The locations with the most expensive properties for sale in Christchurch are Burton & Grange at an average of £642,000, Mudeford And Friars Cliff at an average of £614,335 and North Highcliffe And Walkford at an average of £524,967.
What locations have the most affordable properties for sale in Christchurch?
The locations with the most affordable properties for sale in Christchurch are Commons at an average of £165,500, Highcliffe & Walkford at an average of £296,460 and Grange at an average of £307,218.
Which train stations are available in or near Christchurch?
Some of the train stations available in or near Christchurch are Christchurch, Hinton Admiral and Pokesdown.
Property Price Paid in Christchurch by Year
The average sold property price by year was:
| Year | Average Sold Price | Price Change |
Sold Properties
|
|---|---|---|---|
| 2026 | £384,208 | -18% |
84 Properties |
| 2025 | £452,981 | -2% |
812 Properties |
| 2024 | £460,782 | 3% |
825 Properties |
| 2023 | £447,074 | -10% |
763 Properties |
| 2022 | £490,830 | 16% |
931 Properties |
| 2021 | £413,400 | 4% |
1,300 Properties |
| 2020 | £398,376 | 2% |
901 Properties |
| 2019 | £388,526 | 4% |
965 Properties |
| 2018 | £373,534 | 1% |
1,046 Properties |
| 2017 | £369,495 | 6% |
1,069 Properties |
Property Price per Property Type in Christchurch
Here you can find historic sold price data in order to help with your property search.
The average Property Paid Price for specific property types in the last three years are:
| Property Type | Average Sold Price | Sold Properties |
|---|---|---|
| Semi Detached House | £417,180.00 | 392 Semi Detached Houses |
| Terraced House | £380,918.00 | 452 Terraced Houses |
| Detached House | £618,687.00 | 1,007 Detached Houses |
| Flat | £256,918.00 | 633 Flats |
Transport in Christchurch
Please see below transportation links in this area:
