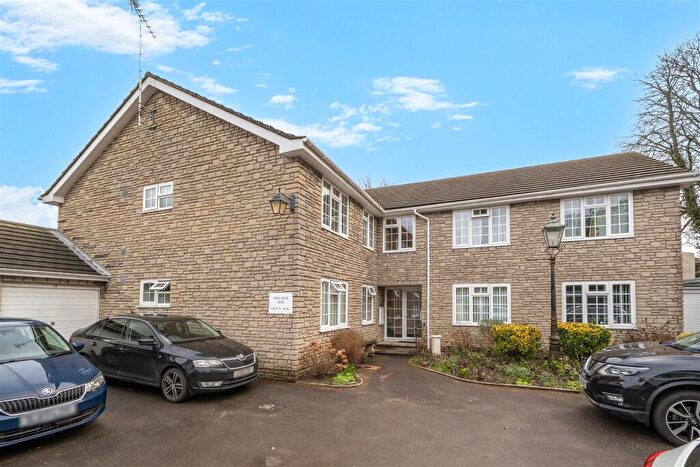
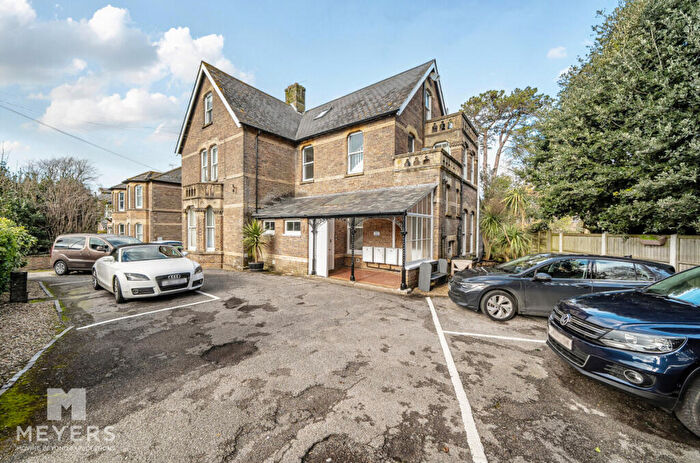
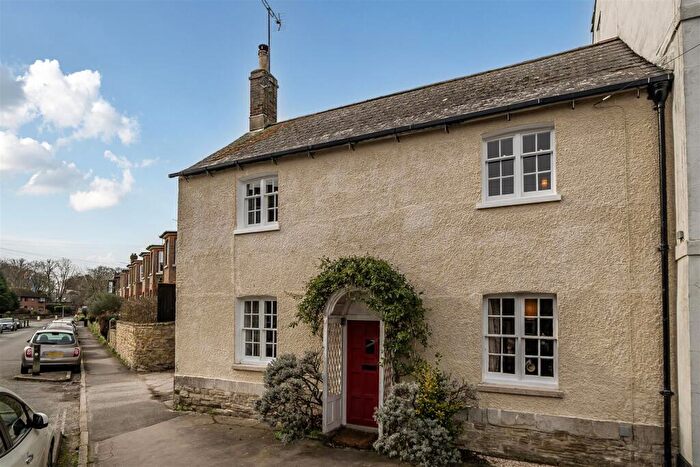
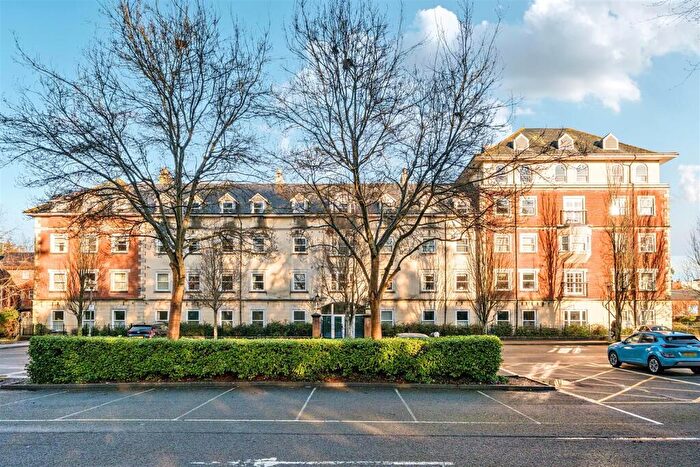
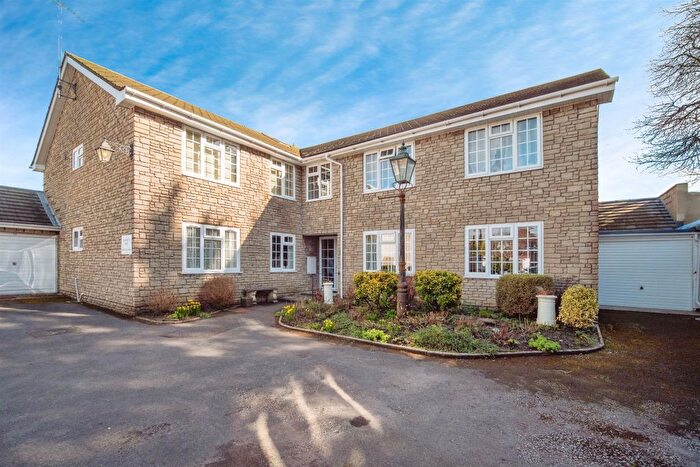
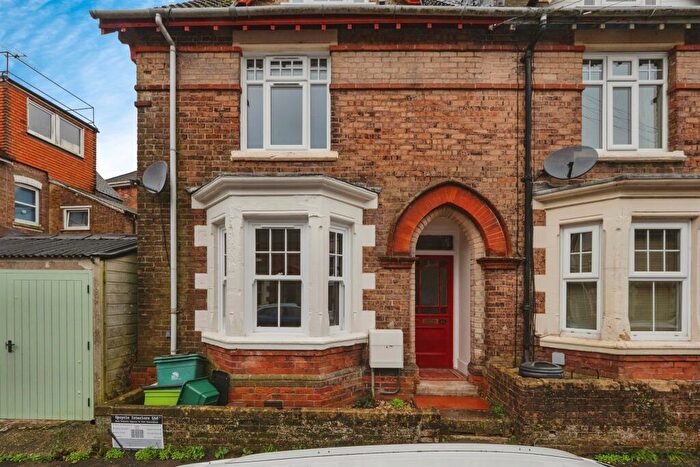
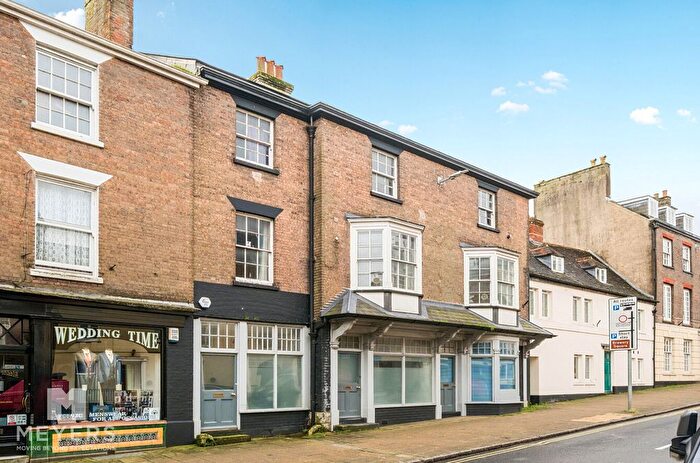
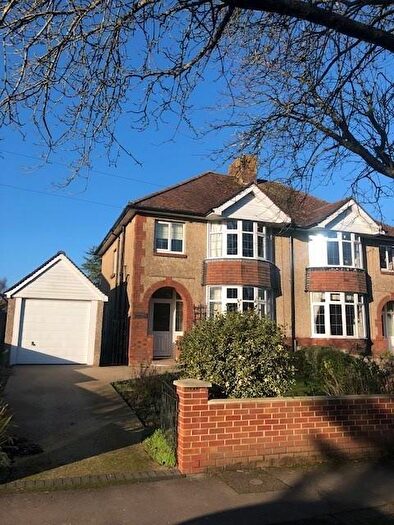
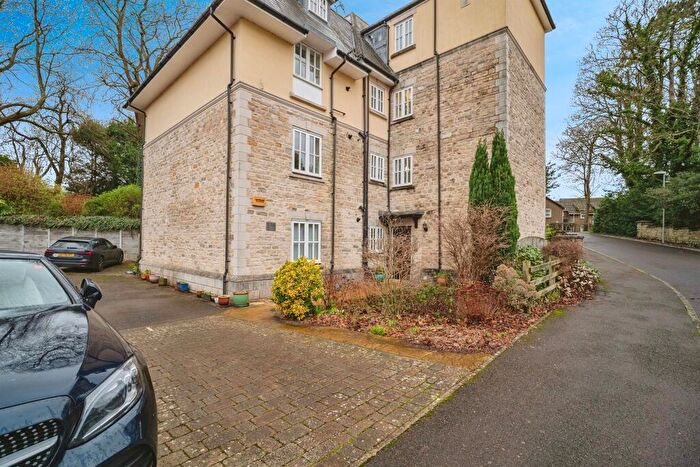
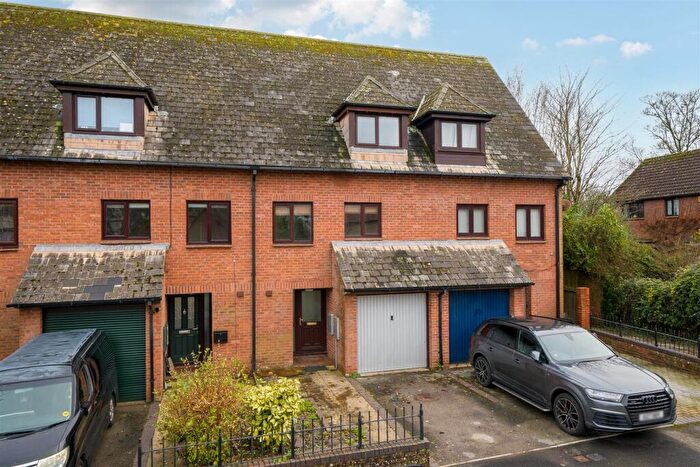
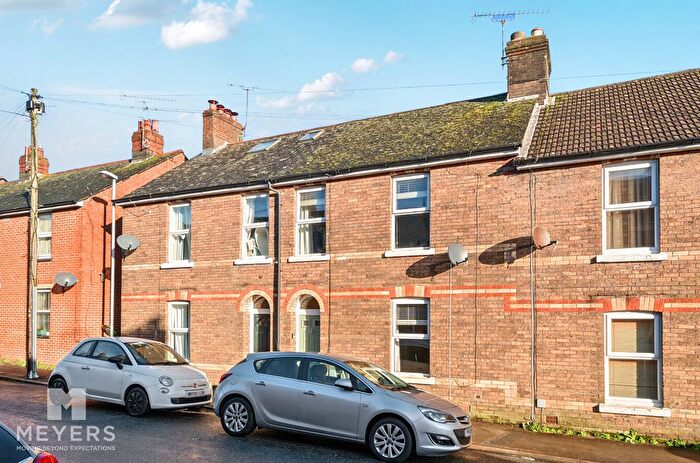
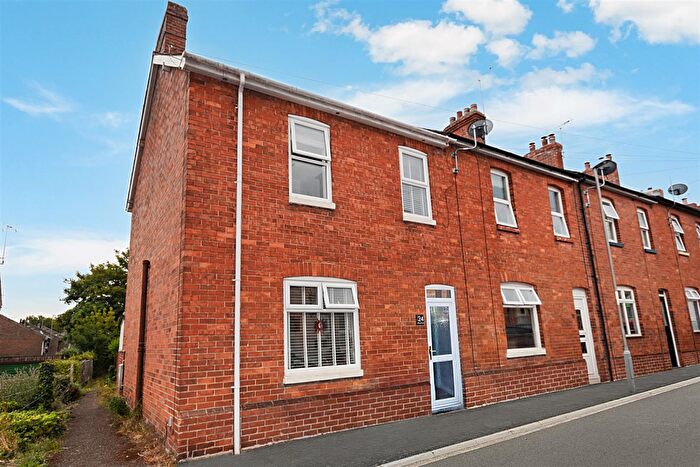
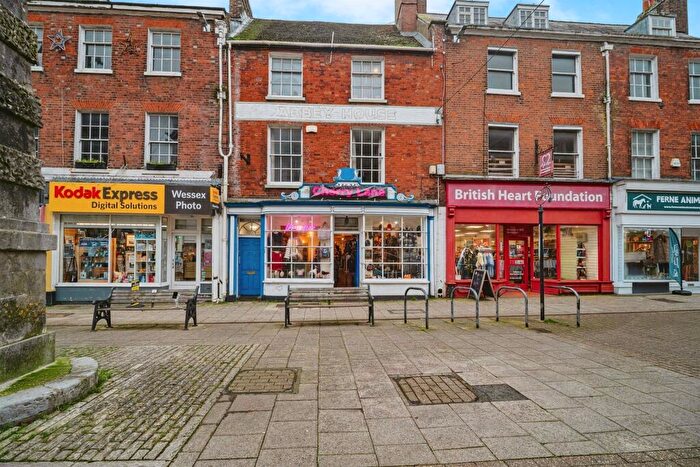
Houses for sale & to rent in Dorchester East, Dorchester
House Prices in Dorchester East
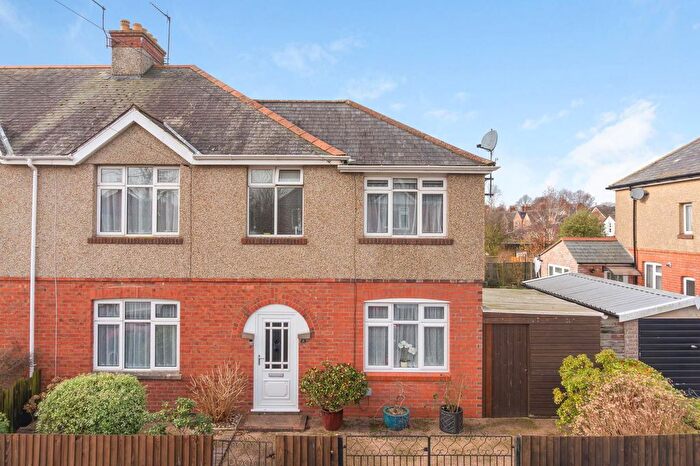
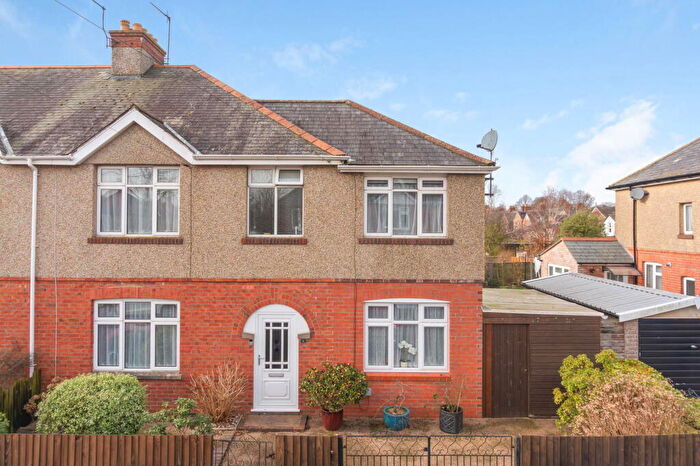
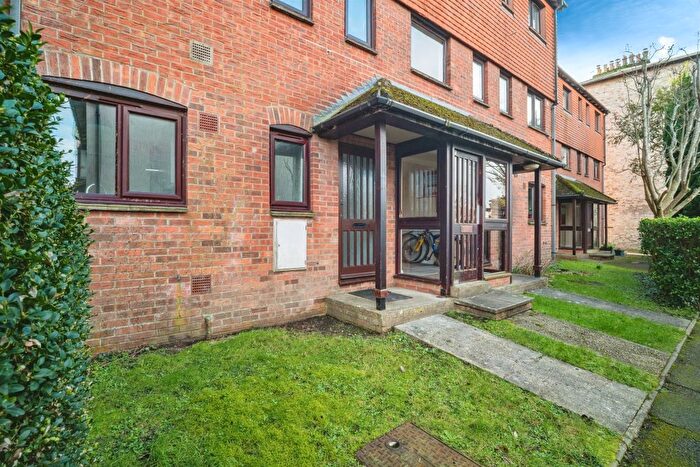
Properties in Dorchester East have an average house price of £312,897.00 and had 233 Property Transactions within the last 3 years¹.
Dorchester East is an area in Dorchester, Dorset with 2,260 households², where the most expensive property was sold for £820,000.00.
Properties for sale in Dorchester East
Roads and Postcodes in Dorchester East
Navigate through our locations to find the location of your next house in Dorchester East, Dorchester for sale or to rent.
| Streets | Postcodes |
|---|---|
| Ackerman Road | DT1 1NZ |
| Alfred Place | DT1 1NW |
| Alington Avenue | DT1 2AB DT1 1EX DT1 2FN |
| Alington Road | DT1 1NS DT1 1NT DT1 1NU DT1 1PN |
| Armada Way | DT1 2TL DT1 2TN |
| Athelstan Road | DT1 1NR |
| Balmoral Crescent | DT1 2BN DT1 2BW |
| Bathsheba Terrace | DT1 2JU |
| Bitter End | DT1 1WJ DT1 1WL DT1 1WP DT1 1WX |
| Braemar Road | DT1 2AR |
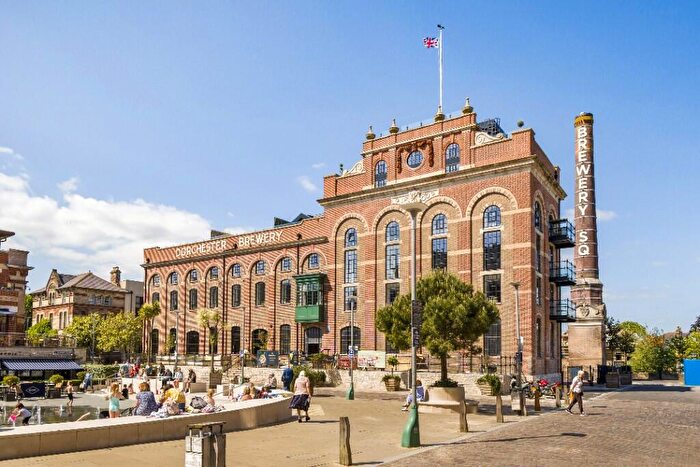
| Brewery Square | DT1 1HX |
| Bridport Road | DT1 1AB |
| Buckbury Mews | DT1 2TX |
| Buckingham Way | DT1 2BP |
| Caernarvon Close | DT1 2EH |
| Came View Close | DT1 2AF |
| Came View Road | DT1 2AE |
| Carrick Close | DT1 2SB |
| Casterbridge Industrial Estate | DT1 1PL |
| Casterbridge Road | DT1 2AG DT1 2AH DT1 2AQ |
| Chester Close | DT1 2SA |
| Church Acre | DT1 1RB |
| Conway Walk | DT1 2EJ |
| Copper Street | DT1 1GH DT1 1GL DT1 1GN |
| Culliford Road North | DT1 1QG DT1 1US DT1 1QQ |
| Cutsome Close | DT1 2SN |
| Diggory Crescent | DT1 2SP |
| Dragons Court | DT1 1WR |
| Dray Horse Yard | DT1 1GS |
| Duchy Close | DT1 2EL |
| Dukes Avenue | DT1 1EN |
| Earl Close | DT1 1DY |
| Eddison Avenue | DT1 1NX DT1 1NY |
| Eldridge Street | DT1 1HE DT1 1HL |
| Everdene Road | DT1 2SQ |
| Farfrae Crescent | DT1 2SR |
| Fenway Close | DT1 1PQ DT1 1PT |
| Fordington Dairy | DT1 1FD |
| Fordington Gardens | DT1 1AN |
| Fordington Green | DT1 1LU |
| Friars Close | DT1 2AD |
| Gabriel Green | DT1 2SS |
| Garland Crescent | DT1 2SX |
| Gatcombe Close | DT1 2AW |
| Hardy Avenue | DT1 1LL |
| Harveys Terrace | DT1 1LE |
| Heathcote Close | DT1 1EY |
| Herringston Road | DT1 2DR DT1 2SL |
| High Street | DT1 1AT DT1 1JZ DT1 1LA DT1 1LB DT1 1LD DT1 1LT DT1 1LX DT1 1LZ |
| Highgrove Close | DT1 2SG |
| Hillside Terrace | DT1 1LY |
| Holbaek Close | DT1 2SH |
| Holloway Road | DT1 1LF DT1 1LG DT1 1LQ |
| Icen Way | DT1 1ER DT1 1ES |
| Ivel Close | DT1 2TP |
| Jonson Trading Park | DT1 1QB |
| Kensington Walk | DT1 2DS |
| Kings Road | DT1 1NH DT1 1NJ DT1 1NL DT1 1NP DT1 1NQ |
| Knapwater Walk | DT1 2TS |
| Knutshaw Grove | DT1 2FF |
| Lancaster Road | DT1 1QH |
| Little Britain | DT1 1AL DT1 1NN |
| London Close | DT1 1SX |
| London Road | DT1 1NE DT1 1NF DT1 1WY |
| Long Bridge Way | DT1 1WS |
| Lornton Walk | DT1 2TU |
| Lubbecke Way | DT1 1QL DT1 1WQ |
| Lucetta Lane | DT1 2ST DT1 2DD |
| Maen Gardens | DT1 1PU |
| Marshwood Road | DT1 2TR |
| Mill Street | DT1 1LJ DT1 1LN |
| Mixen Lane | DT1 2SZ |
| Moynton Road | DT1 2TT |
| Nonesuch Close | DT1 2SW |
| Osborne Close | DT1 2AP |
| Pope Street | DT1 1GU DT1 1GW DT1 1GX |
| Pound Lane | DT1 1LP |
| Prince Of Wales Road | DT1 1PR DT1 1PS DT1 1HD DT1 1QE |
| Red Cow Business Park | DT1 1YD DT1 1YE |
| Red Cow Lane | DT1 1WT |
| Renfrew Close | DT1 2SD |
| River Crescent | DT1 1LW |
| Robins Garth | DT1 1RA |
| Salisbury Mews | DT1 1QP |
| Salisbury Street | DT1 1JU DT1 1JX |
| Salisbury Terrace | DT1 1JT |
| Salisbury Villas | DT1 1JY |
| Sandringham Court | DT1 2BL |
| Sawmills Lane | DT1 2RZ |
| South Walks Road | DT1 1ED DT1 1DT DT1 1DU DT1 1EA DT1 1EB |
| St Andrews Close | DT1 2SF |
| St Davids Close | DT1 2SE |
| St Georges Close | DT1 1PG DT1 1PJ |
| St Georges Road | DT1 1PH DT1 1PA DT1 1PB DT1 1PE |
| Standfast Walk | DT1 2TW |
| Station Approach | DT1 1GA DT1 1QX |
| Stinsford View | DT1 1QU |
| Swanbridge Mobile Home Park | DT1 1ND |
| Sydenham Way | DT1 1DN |
| Syward Close | DT1 2AL DT1 2AN |
| Syward Road | DT1 2AJ |
| Talbothays Road | DT1 2SY |
| Twelvemans Way | DT1 2SU |
| Vicarage Lane | DT1 1LH |
| Victoria Buildings | DT1 1LR |
| Victoria Terrace | DT1 1LS |
| Weymouth Avenue | DT1 1QY DT1 1QZ DT1 2RY |
| Wilson Road | DT1 1PF |
| York Road | DT1 1AS |
Transport near Dorchester East
- FAQ
- Price Paid By Year
- Property Type Price
Frequently asked questions about Dorchester East
What is the average price for a property for sale in Dorchester East?
The average price for a property for sale in Dorchester East is £312,897. This amount is 17% lower than the average price in Dorchester. There are 1,442 property listings for sale in Dorchester East.
What streets have the most expensive properties for sale in Dorchester East?
The streets with the most expensive properties for sale in Dorchester East are Sydenham Way at an average of £565,000, Came View Road at an average of £553,333 and Friars Close at an average of £550,000.
What streets have the most affordable properties for sale in Dorchester East?
The streets with the most affordable properties for sale in Dorchester East are Salisbury Mews at an average of £95,500, Hardy Avenue at an average of £125,000 and Mill Street at an average of £144,750.
Which train stations are available in or near Dorchester East?
Some of the train stations available in or near Dorchester East are Dorchester South, Dorchester West and Upwey.
Property Price Paid in Dorchester East by Year
The average sold property price by year was:
| Year | Average Sold Price | Price Change |
Sold Properties
|
|---|---|---|---|
| 2025 | £320,227 | -3% |
82 Properties |
| 2024 | £331,182 | 15% |
85 Properties |
| 2023 | £280,241 | -10% |
66 Properties |
| 2022 | £307,796 | 2% |
97 Properties |
| 2021 | £302,600 | 11% |
97 Properties |
| 2020 | £270,162 | 6% |
80 Properties |
| 2019 | £253,046 | 0,3% |
105 Properties |
| 2018 | £252,370 | -10% |
107 Properties |
| 2017 | £277,402 | 1% |
139 Properties |
| 2016 | £274,429 | 18% |
182 Properties |
| 2015 | £225,082 | 1% |
114 Properties |
| 2014 | £223,219 | -1% |
120 Properties |
| 2013 | £225,591 | 6% |
93 Properties |
| 2012 | £210,946 | -10% |
72 Properties |
| 2011 | £231,848 | 10% |
61 Properties |
| 2010 | £209,650 | 3% |
87 Properties |
| 2009 | £203,698 | 3% |
87 Properties |
| 2008 | £197,827 | -9% |
69 Properties |
| 2007 | £216,501 | 7% |
165 Properties |
| 2006 | £202,133 | -5% |
125 Properties |
| 2005 | £211,869 | 13% |
117 Properties |
| 2004 | £184,989 | 6% |
116 Properties |
| 2003 | £174,785 | 20% |
146 Properties |
| 2002 | £139,851 | 26% |
198 Properties |
| 2001 | £104,066 | 5% |
181 Properties |
| 2000 | £99,032 | 13% |
157 Properties |
| 1999 | £86,247 | 12% |
174 Properties |
| 1998 | £75,614 | 13% |
139 Properties |
| 1997 | £65,771 | 13% |
128 Properties |
| 1996 | £57,334 | -1% |
131 Properties |
| 1995 | £57,956 | - |
88 Properties |
Property Price per Property Type in Dorchester East
Here you can find historic sold price data in order to help with your property search.
The average Property Paid Price for specific property types in the last three years are:
| Property Type | Average Sold Price | Sold Properties |
|---|---|---|
| Flat | £190,600.00 | 52 Flats |
| Semi Detached House | £335,862.00 | 39 Semi Detached Houses |
| Detached House | £456,330.00 | 50 Detached Houses |
| Terraced House | £294,334.00 | 92 Terraced Houses |

