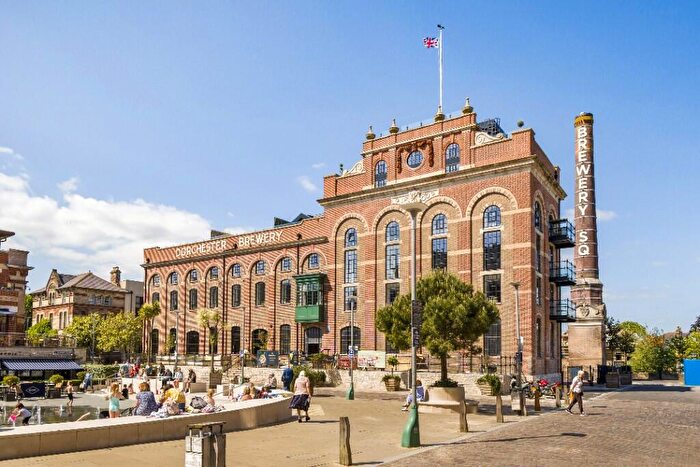
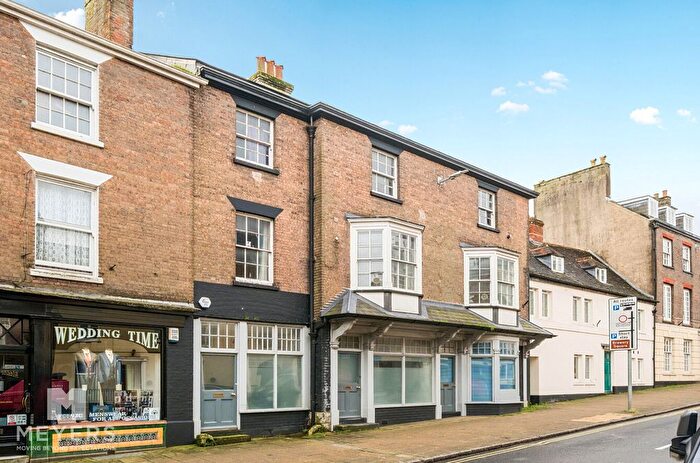
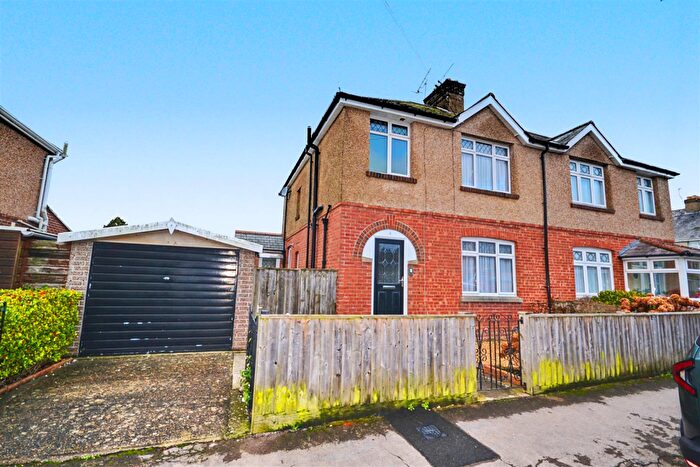
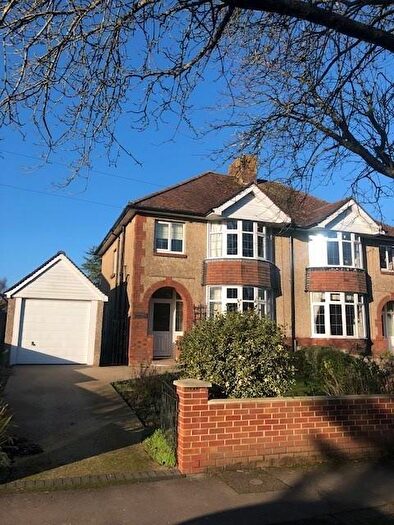
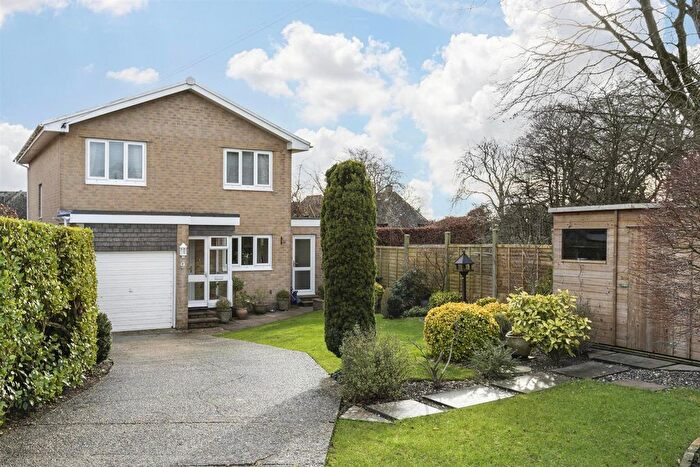
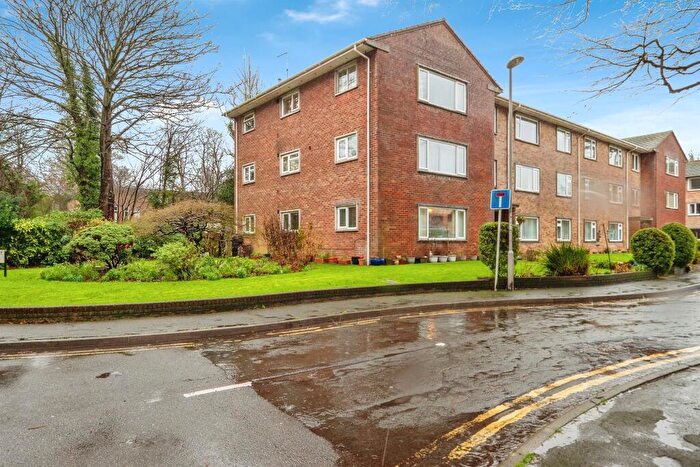
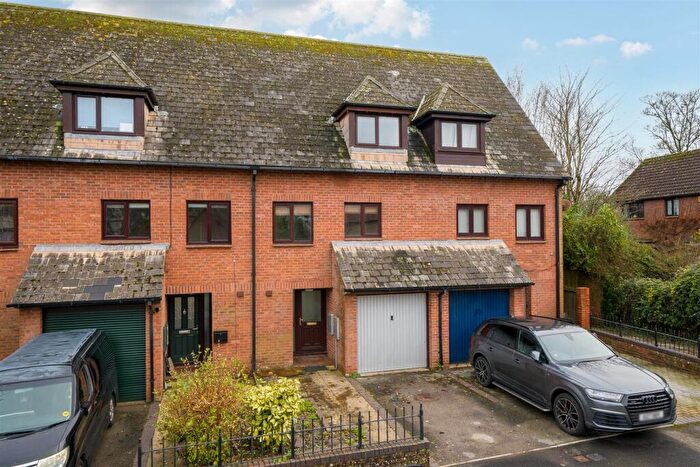
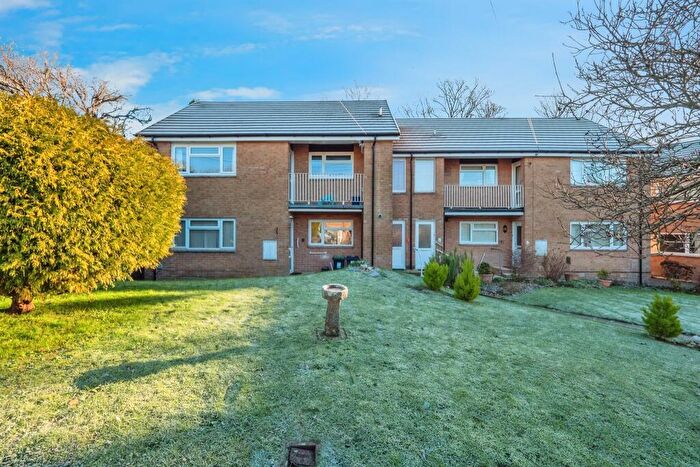
Houses for sale & to rent in Dorchester South, Dorchester
House Prices in Dorchester South
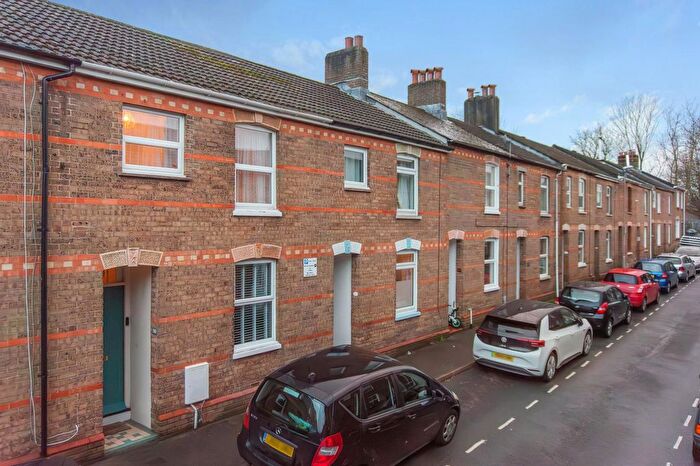
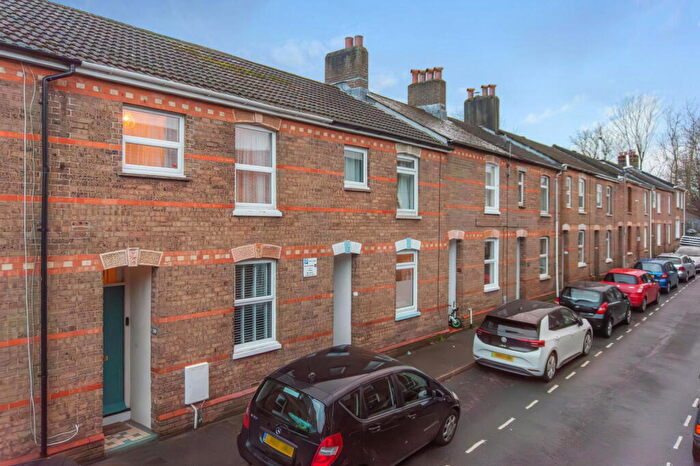
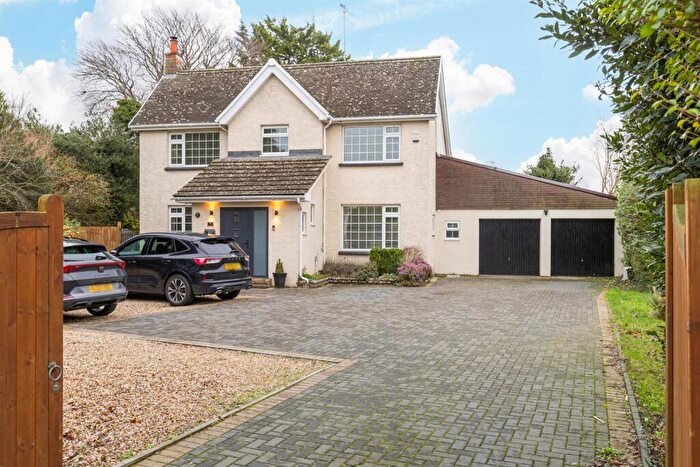
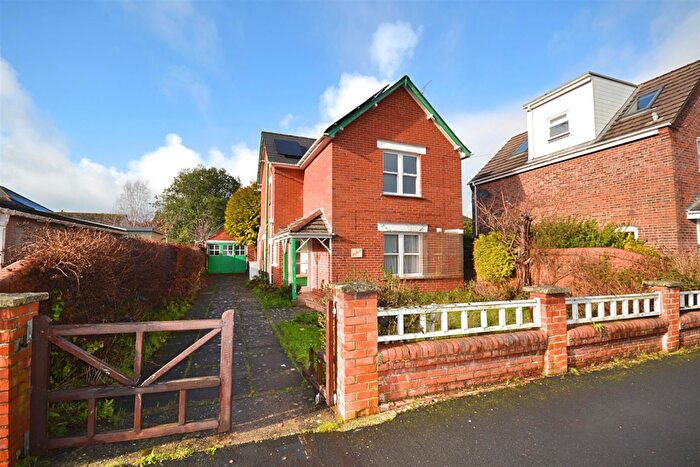
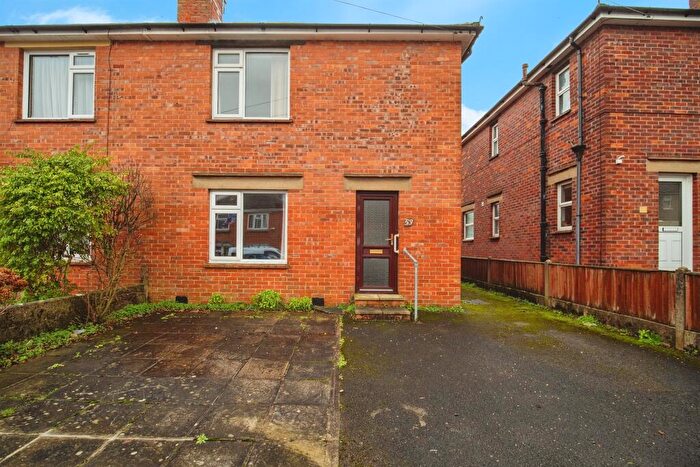
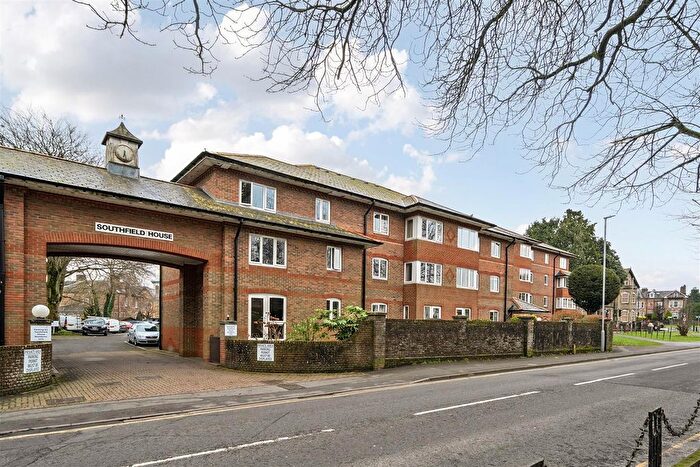
Properties in Dorchester South have an average house price of £390,222.00 and had 146 Property Transactions within the last 3 years¹.
Dorchester South is an area in Dorchester, Dorset with 1,662 households², where the most expensive property was sold for £775,000.00.
Properties for sale in Dorchester South
Roads and Postcodes in Dorchester South
Navigate through our locations to find the location of your next house in Dorchester South, Dorchester for sale or to rent.
| Streets | Postcodes |
|---|---|
| Alfred Road | DT1 2DW |
| Apollo Close | DT1 2QP |
| Ashley Road | DT1 2DJ DT1 2DL |
| Augustan Close | DT1 2QU |
| Barnes Way | DT1 2DB DT1 2DZ |
| Barrow Close | DT1 2HG |
| Britannia Way | DT1 2QR |
| Brutus Close | DT1 2TJ |
| Caesar Green | DT1 2RJ |
| Camden Way | DT1 2RA |
| Capitol Close | DT1 2QS |
| Celtic Crescent | DT1 2QH DT1 2QJ DT1 2TA DT1 2TB DT1 2TD DT1 2TE DT1 2TG |
| Claudius Close | DT1 2RN |
| Cromwell Road | DT1 2DN |
| Culliford Road South | DT1 2AT |
| Cunnington Close | DT1 2RB |
| Diana Close | DT1 2QY |
| Druids Walk | DT1 2QX |
| Durberville Close | DT1 2JT |
| Egdon Road | DT1 2EA |
| Eldridge Close | DT1 2JS |
| Farringdon Close | DT1 2BU |
| Fortress Green | DT1 2TF |
| Forum Green | DT1 2RL |
| Fosse Green | DT1 2RR |
| Gladiator Green | DT1 2RW |
| Grosvenor Crescent | DT1 2BA |
| Grosvenor Road | DT1 2BB DT1 2BD |
| Herringston Road | DT1 2BS DT1 2BT |
| Hillfort Close | DT1 2QT |
| Hillfort Mews | DT1 2QD |
| Hutchins Close | DT1 2RH |
| Kingsbere Crescent | DT1 2DY |
| Legion Close | DT1 2RQ |
| Maiden Castle Road | DT1 2QG DT1 2QQ |
| Manor Road | DT1 2AU DT1 2AX DT1 2AY DT1 2AZ |
| Martyr Close | DT1 2RP |
| Mellstock Avenue | DT1 2BE DT1 2BG DT1 2BH DT1 2BQ |
| Minerva Close | DT1 2QN |
| Mistover Close | DT1 2EQ |
| Mithras Close | DT1 2RF |
| Monmouth Road | DT1 2DE DT1 2DF DT1 2DG DT1 2DH DT1 2DQ |
| Powys Close | DT1 2RG |
| Rampart Walk | DT1 2QZ |
| Remus Close | DT1 2TQ |
| Roman Road | DT1 2QW |
| Romulus Close | DT1 2TH |
| Rothesay Road | DT1 2DT DT1 2DU DT1 2DX |
| Shaston Crescent | DT1 2EB |
| South Court Avenue | DT1 2BX DT1 2BY DT1 2BZ DT1 2DA |
| South Western Cottages | DT1 2AS |
| Temple Close | DT1 2QL |
| Thornhill Close | DT1 2RE |
| Vespasian Way | DT1 2RD |
| Weatherbury Way | DT1 2ED DT1 2EE DT1 2EF DT1 2EG |
| Wellbridge Close | DT1 2BJ |
| York Terrace | DT1 2DP |
Transport near Dorchester South
- FAQ
- Price Paid By Year
- Property Type Price
Frequently asked questions about Dorchester South
What is the average price for a property for sale in Dorchester South?
The average price for a property for sale in Dorchester South is £390,222. This amount is 3% higher than the average price in Dorchester. There are 1,551 property listings for sale in Dorchester South.
What streets have the most expensive properties for sale in Dorchester South?
The streets with the most expensive properties for sale in Dorchester South are Wellbridge Close at an average of £679,375, Manor Road at an average of £590,200 and Herringston Road at an average of £585,000.
What streets have the most affordable properties for sale in Dorchester South?
The streets with the most affordable properties for sale in Dorchester South are York Terrace at an average of £200,000, Camden Way at an average of £235,000 and Alfred Road at an average of £248,775.
Which train stations are available in or near Dorchester South?
Some of the train stations available in or near Dorchester South are Dorchester South, Dorchester West and Upwey.
Property Price Paid in Dorchester South by Year
The average sold property price by year was:
| Year | Average Sold Price | Price Change |
Sold Properties
|
|---|---|---|---|
| 2025 | £405,251 | 5% |
41 Properties |
| 2024 | £384,095 | -0,1% |
55 Properties |
| 2023 | £384,639 | -14% |
50 Properties |
| 2022 | £440,267 | 13% |
48 Properties |
| 2021 | £381,156 | 3% |
71 Properties |
| 2020 | £369,914 | 1% |
38 Properties |
| 2019 | £365,718 | 10% |
55 Properties |
| 2018 | £327,741 | -8% |
65 Properties |
| 2017 | £353,491 | 15% |
65 Properties |
| 2016 | £301,123 | 1% |
62 Properties |
| 2015 | £297,854 | 4% |
54 Properties |
| 2014 | £286,798 | 16% |
59 Properties |
| 2013 | £239,863 | -16% |
87 Properties |
| 2012 | £278,900 | 3% |
63 Properties |
| 2011 | £269,204 | 2% |
55 Properties |
| 2010 | £262,553 | 13% |
68 Properties |
| 2009 | £229,189 | -1% |
55 Properties |
| 2008 | £230,624 | -10% |
47 Properties |
| 2007 | £254,795 | 11% |
74 Properties |
| 2006 | £227,177 | -2% |
70 Properties |
| 2005 | £231,685 | 4% |
89 Properties |
| 2004 | £222,569 | 14% |
61 Properties |
| 2003 | £190,599 | 19% |
74 Properties |
| 2002 | £153,877 | 12% |
87 Properties |
| 2001 | £135,032 | 16% |
97 Properties |
| 2000 | £112,819 | 18% |
78 Properties |
| 1999 | £92,111 | 6% |
110 Properties |
| 1998 | £86,405 | 10% |
85 Properties |
| 1997 | £77,627 | 8% |
97 Properties |
| 1996 | £71,634 | 8% |
95 Properties |
| 1995 | £65,603 | - |
60 Properties |
Property Price per Property Type in Dorchester South
Here you can find historic sold price data in order to help with your property search.
The average Property Paid Price for specific property types in the last three years are:
| Property Type | Average Sold Price | Sold Properties |
|---|---|---|
| Semi Detached House | £390,504.00 | 51 Semi Detached Houses |
| Detached House | £494,939.00 | 48 Detached Houses |
| Terraced House | £285,210.00 | 46 Terraced Houses |
| Flat | £180,000.00 | 1 Flat |

