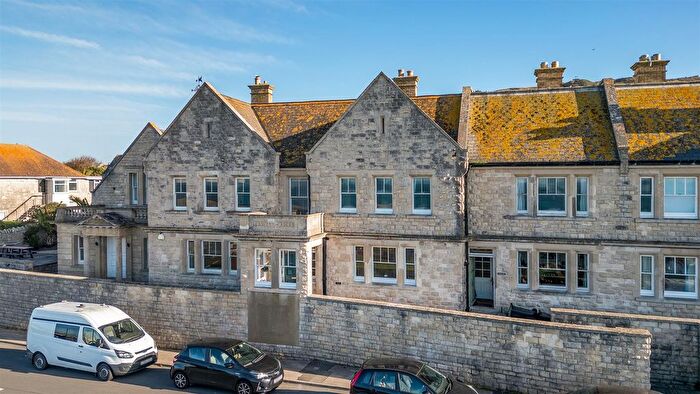
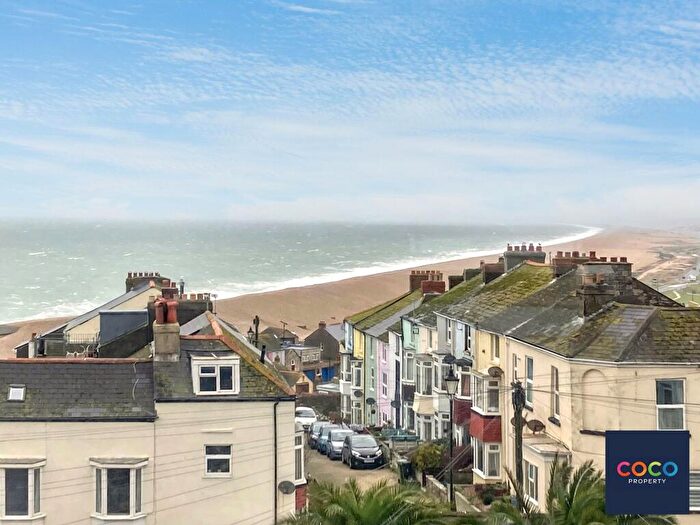
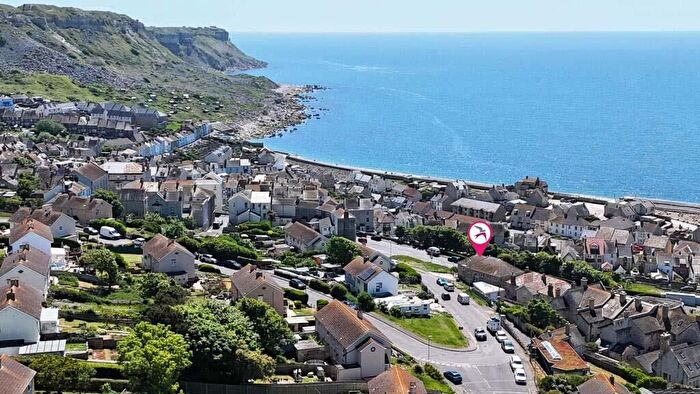
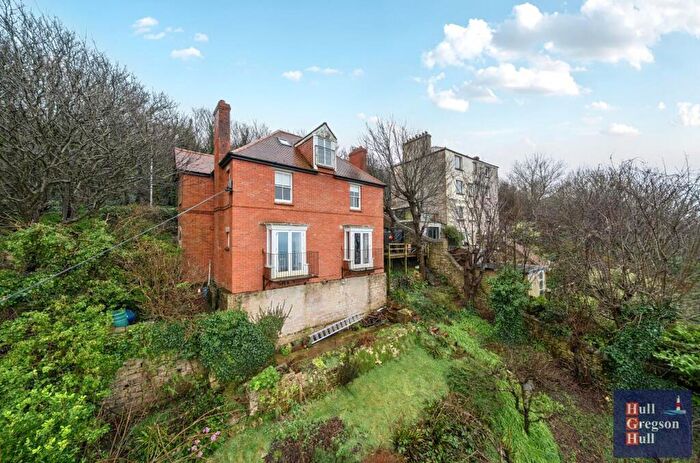
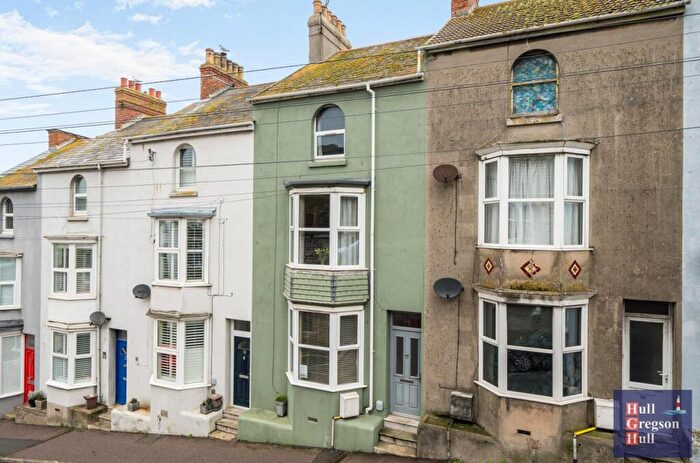
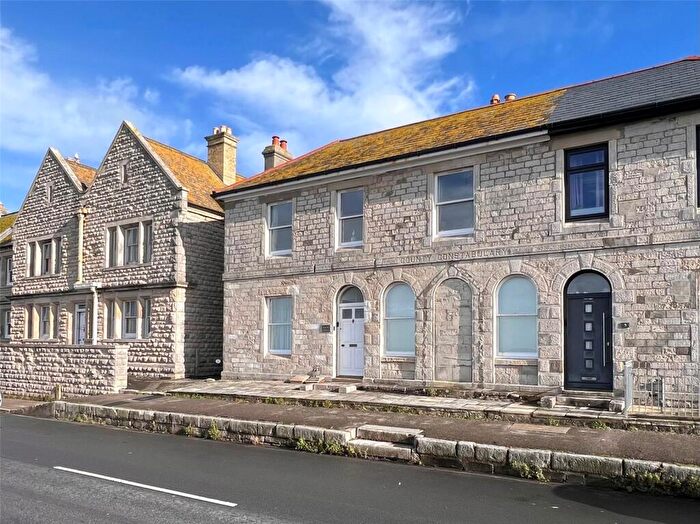
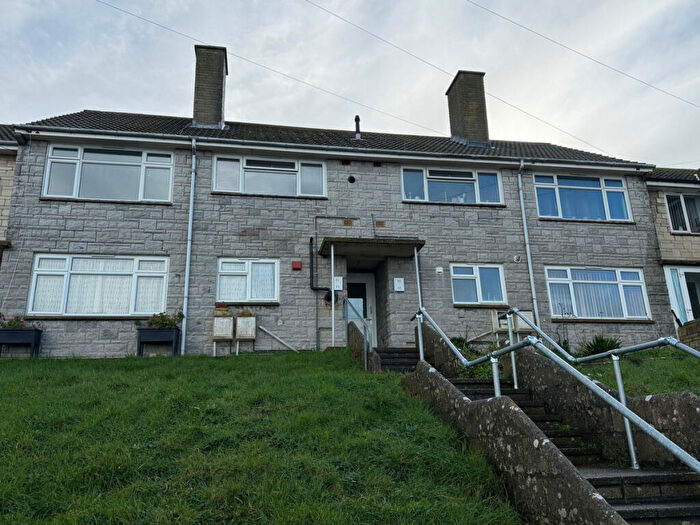
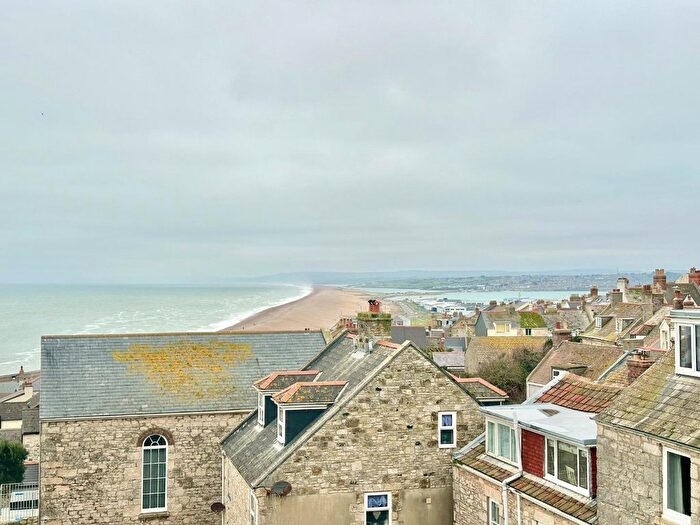
Houses for sale & to rent in Underhill, Portland
House Prices in Underhill
Properties in Underhill have an average house price of £213,993.00 and had 167 Property Transactions within the last 3 years¹.
Underhill is an area in Portland, Dorset with 1,523 households², where the most expensive property was sold for £580,000.00.
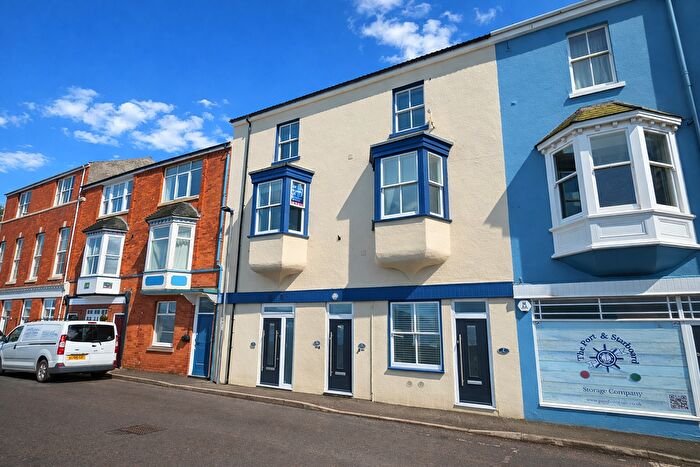
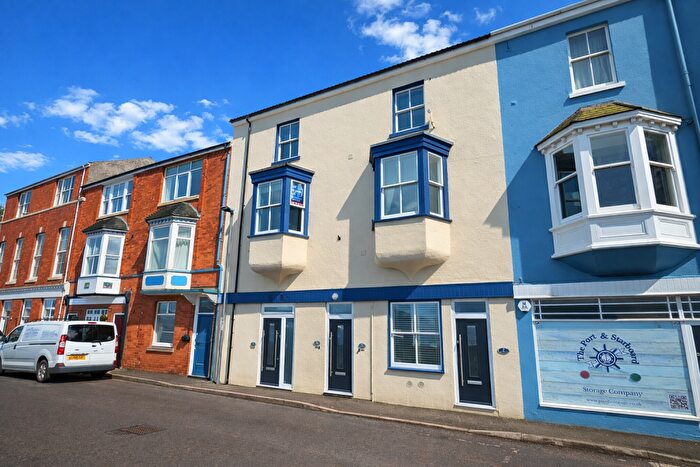
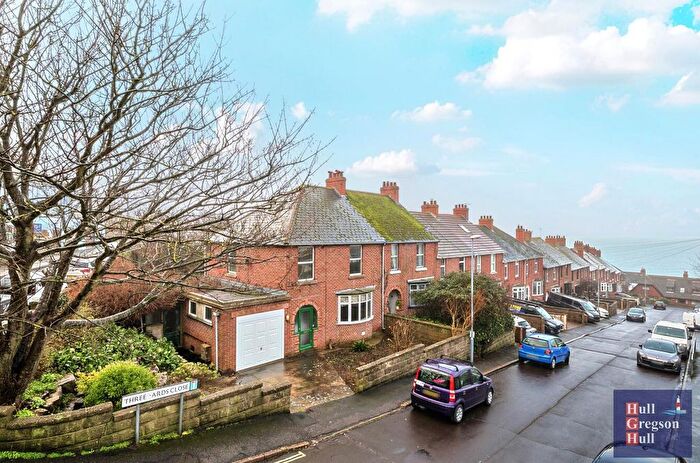
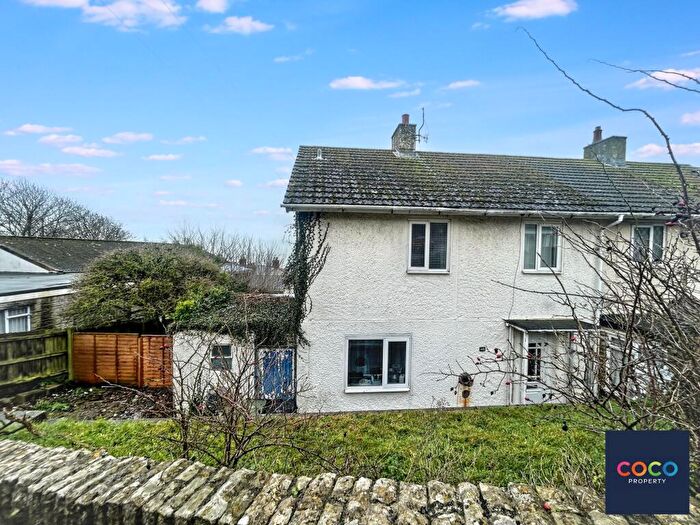
Properties for sale in Underhill
Roads and Postcodes in Underhill
Navigate through our locations to find the location of your next house in Underhill, Portland for sale or to rent.
| Streets | Postcodes |
|---|---|
| Albert Terrace | DT5 1AF |
| Albert Villas | DT5 1AB |
| Albion Crescent | DT5 1AQ |
| Amelia Close | DT5 1HE |
| Artist Row | DT5 1NQ |
| Ayton Drive | DT5 1DT DT5 1EF DT5 1FB |
| Beach Cottages | DT5 1AR |
| Beel Close | DT5 1HD |
| Belgrave Place | DT5 1NN |
| Belle Vue Cottages | DT5 1LB |
| Belle Vue Terrace | DT5 1LD |
| Brandy Lane | DT5 1AP |
| Brymers Avenue | DT5 1JS |
| Castletown | DT5 1BD DT5 1BE |
| Chiswell | DT5 1AN DT5 1AW |
| Clements Lane | DT5 1AS |
| Clovens Road | DT5 1JL |
| Coastguard Road | DT5 1AD |
| Coronation Road | DT5 1EY DT5 1EZ |
| Cove Cottages | DT5 1JJ |
| East Street | DT5 1NF |
| East Weare Road | DT5 1ES DT5 1ET DT5 1EU DT5 1EX |
| Fortuneswell | DT5 1AE DT5 1LP DT5 1LR DT5 1LT DT5 1LU DT5 1LX DT5 1LY DT5 1LZ DT5 1NE |
| Foylebank Way | DT5 1BA |
| Greenhill Terrace | DT5 1NW |
| Guernsey Street | DT5 1JR |
| Hambro Road | DT5 1JU |
| Harbour View Road | DT5 1AU DT5 1EN DT5 1EP DT5 1EW |
| High Street | DT5 1JH DT5 1JQ |
| Higher Lane | DT5 1AT |
| Killicks Hill | DT5 1JW |
| King Street | DT5 1NH |
| Land Associated With | DT5 1HA |
| Leet Close | DT5 1HB |
| Mallams | DT5 1NJ |
| Manor Place | DT5 1NL |
| Merton Terrace | DT5 1LA |
| New Road | DT5 1LE |
| Officers Field | DT5 1FH |
| Old Police Houses | DT5 1JF |
| Osborne Terrace | DT5 1AG |
| Pauls Mead | DT5 1JZ |
| Queens Road | DT5 1AH |
| Sea View | DT5 1AA |
| Sidon Mews | DT5 1FG |
| Spring Gardens | DT5 1JG |
| St Johns Close | DT5 1NG |
| St Martins Road | DT5 1JY |
| St Pauls Road | DT5 1JX |
| The Verne | DT5 1EG |
| Three Yards Close | DT5 1JN |
| Tillycombe Road | DT5 1LF DT5 1LG DT5 1LL |
| Ventnor Road | DT5 1JE |
| Verne Common Road | DT5 1EH DT5 1EJ |
| Victoria Square | DT5 1AL |
| Victory Road | DT5 1FE |
| Weare Close | DT5 1JP |
Transport near Underhill
-
Weymouth Station
-
Upwey Station
-
Dorchester South Station
-
Dorchester West Station
-
Moreton (Dorset) Station
-
Wool Station
- FAQ
- Price Paid By Year
- Property Type Price
Frequently asked questions about Underhill
What is the average price for a property for sale in Underhill?
The average price for a property for sale in Underhill is £213,993. This amount is 10% lower than the average price in Portland. There are 399 property listings for sale in Underhill.
What streets have the most expensive properties for sale in Underhill?
The streets with the most expensive properties for sale in Underhill are Sidon Mews at an average of £423,000, Officers Field at an average of £378,333 and Ventnor Road at an average of £372,250.
What streets have the most affordable properties for sale in Underhill?
The streets with the most affordable properties for sale in Underhill are East Weare Road at an average of £115,937, Beel Close at an average of £117,500 and Verne Common Road at an average of £147,600.
Which train stations are available in or near Underhill?
Some of the train stations available in or near Underhill are Weymouth, Upwey and Dorchester South.
Property Price Paid in Underhill by Year
The average sold property price by year was:
| Year | Average Sold Price | Price Change |
Sold Properties
|
|---|---|---|---|
| 2025 | £224,240 | 10% |
60 Properties |
| 2024 | £202,488 | -5% |
46 Properties |
| 2023 | £212,590 | -3% |
61 Properties |
| 2022 | £218,000 | -5% |
94 Properties |
| 2021 | £228,354 | 14% |
103 Properties |
| 2020 | £195,934 | 13% |
64 Properties |
| 2019 | £170,764 | -15% |
51 Properties |
| 2018 | £195,730 | 11% |
80 Properties |
| 2017 | £173,550 | 2% |
76 Properties |
| 2016 | £169,320 | -1% |
64 Properties |
| 2015 | £171,618 | -5% |
66 Properties |
| 2014 | £180,387 | 3% |
82 Properties |
| 2013 | £175,392 | 4% |
84 Properties |
| 2012 | £168,881 | 14% |
57 Properties |
| 2011 | £145,122 | -7% |
44 Properties |
| 2010 | £155,611 | -6% |
26 Properties |
| 2009 | £165,140 | -29% |
49 Properties |
| 2008 | £213,443 | 15% |
62 Properties |
| 2007 | £180,915 | 10% |
68 Properties |
| 2006 | £163,252 | 2% |
96 Properties |
| 2005 | £159,402 | 19% |
85 Properties |
| 2004 | £129,615 | 7% |
91 Properties |
| 2003 | £120,341 | 20% |
74 Properties |
| 2002 | £96,244 | 26% |
93 Properties |
| 2001 | £70,812 | 3% |
99 Properties |
| 2000 | £68,631 | 23% |
78 Properties |
| 1999 | £52,575 | 15% |
97 Properties |
| 1998 | £44,603 | -2% |
94 Properties |
| 1997 | £45,546 | 14% |
95 Properties |
| 1996 | £39,173 | 15% |
83 Properties |
| 1995 | £33,213 | - |
64 Properties |
Property Price per Property Type in Underhill
Here you can find historic sold price data in order to help with your property search.
The average Property Paid Price for specific property types in the last three years are:
| Property Type | Average Sold Price | Sold Properties |
|---|---|---|
| Semi Detached House | £225,052.00 | 19 Semi Detached Houses |
| Detached House | £277,458.00 | 12 Detached Houses |
| Terraced House | £239,375.00 | 97 Terraced Houses |
| Flat | £125,948.00 | 39 Flats |

