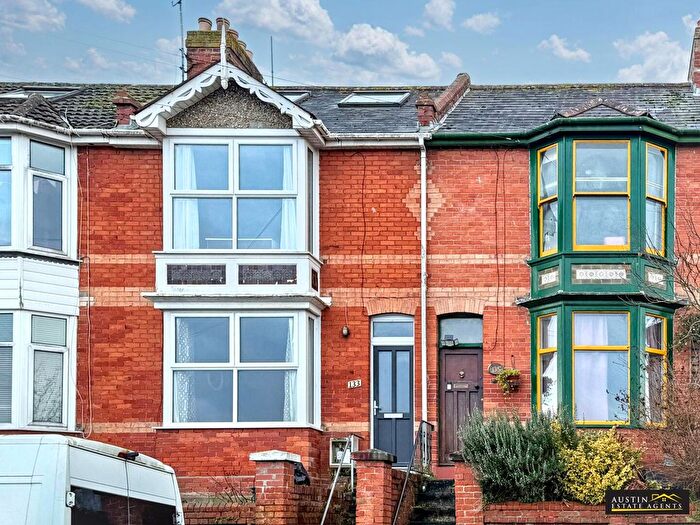
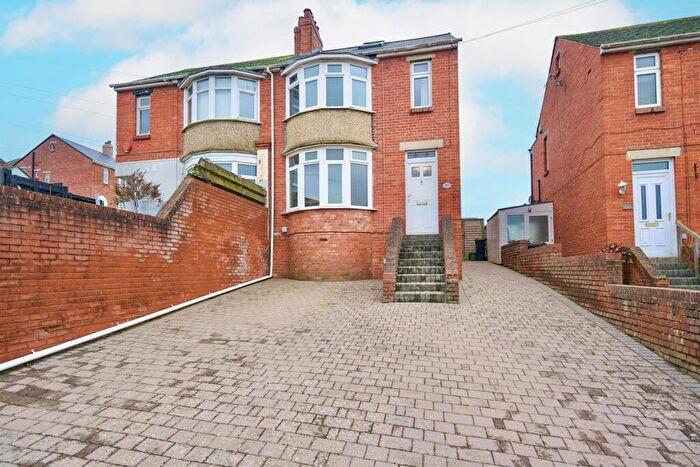
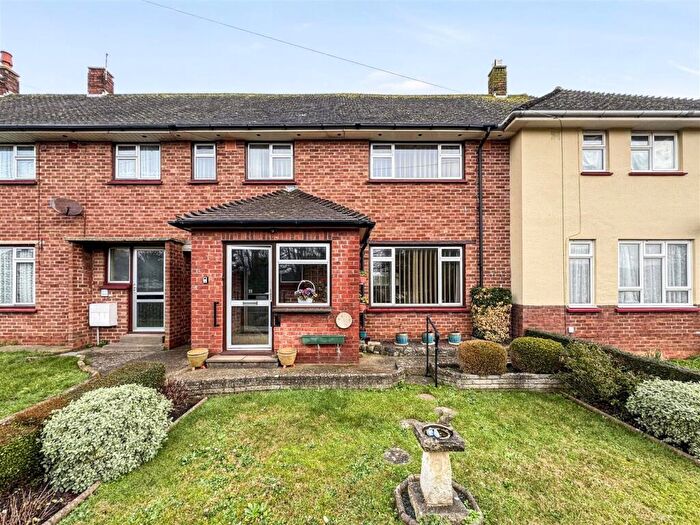
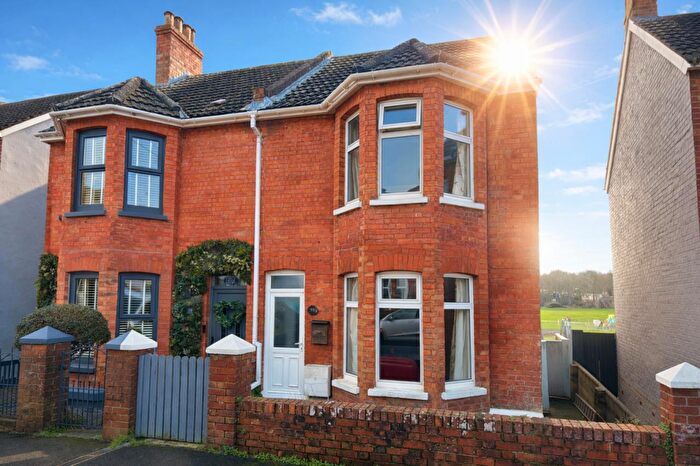
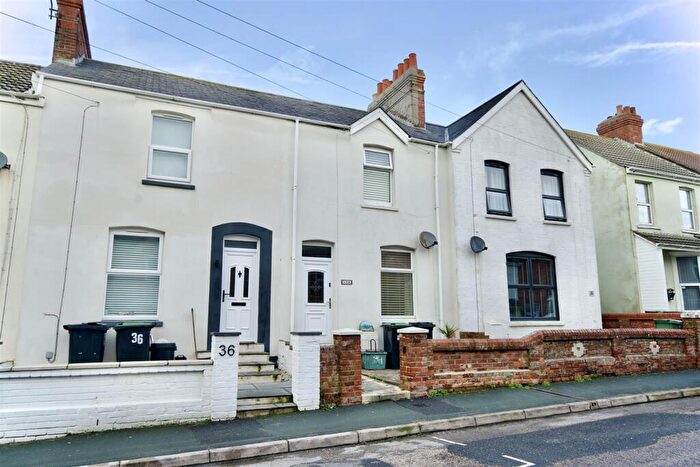
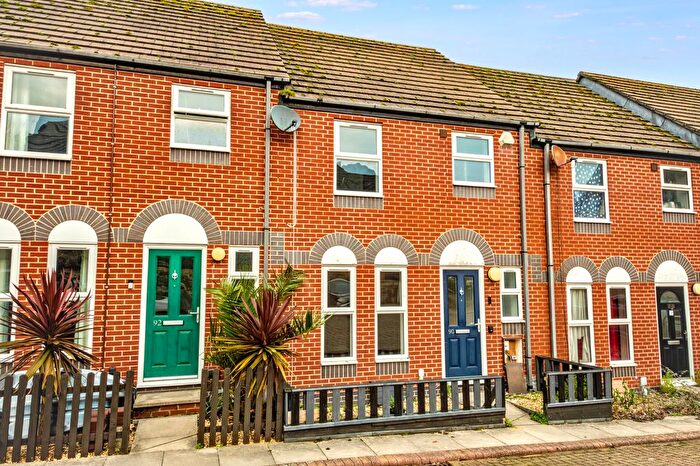
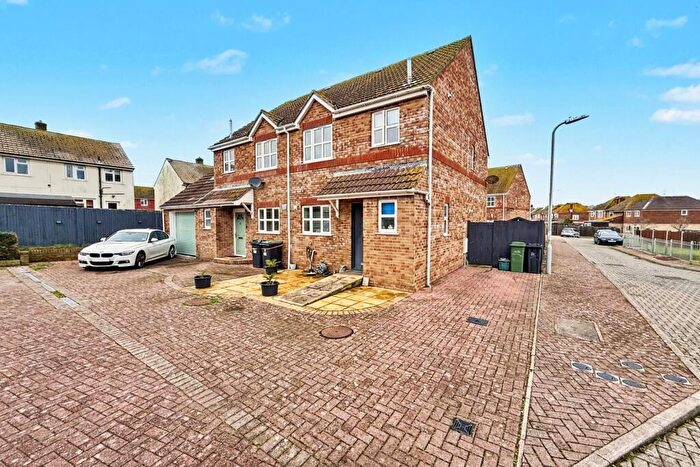
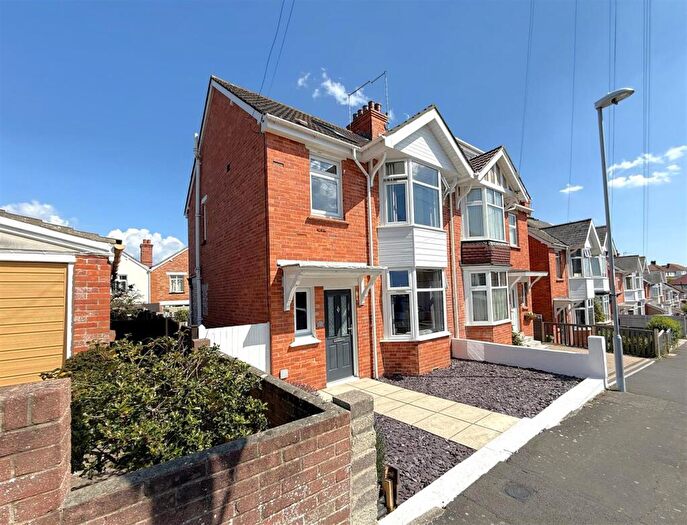
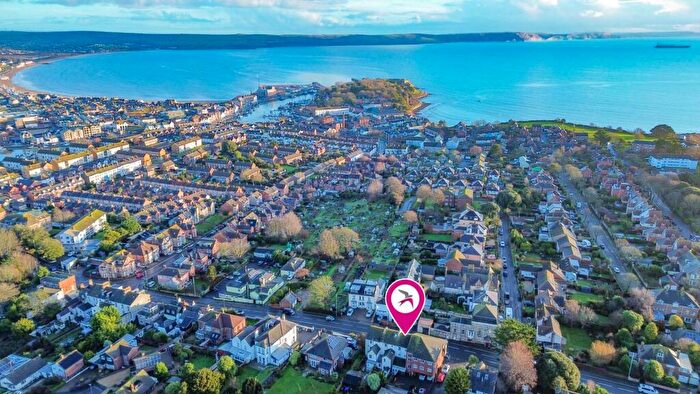
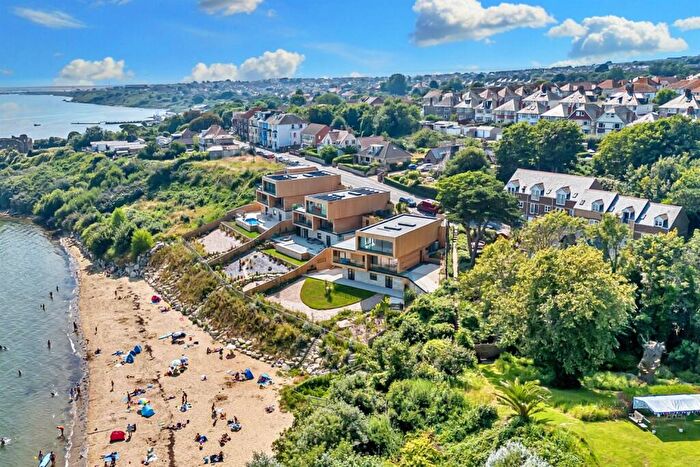
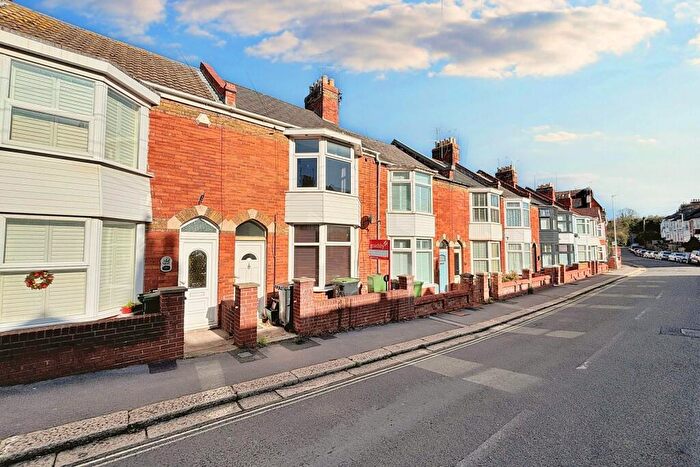
Houses for sale & to rent in Weymouth West, Weymouth
House Prices in Weymouth West
Properties in Weymouth West have an average house price of £310,618.00 and had 196 Property Transactions within the last 3 years¹.
Weymouth West is an area in Weymouth, Dorset with 2,089 households², where the most expensive property was sold for £1,100,000.00.
Properties for sale in Weymouth West
Roads and Postcodes in Weymouth West
Navigate through our locations to find the location of your next house in Weymouth West, Weymouth for sale or to rent.
| Streets | Postcodes |
|---|---|
| Aragon Close | DT4 9JY |
| Ashton Road | DT4 0BX |
| Barnhaven Close | DT4 9QJ |
| Baycliffe Road | DT4 0DR |
| Belfield Close | DT4 9RQ |
| Belfield Park Avenue | DT4 9RD DT4 9RE DT4 9RF |
| Belfield Park Drive | DT4 9RB |
| Ben Nevis Road | DT4 0DB |
| Boleyn Crescent | DT4 9JX |
| Bradford Road | DT4 0DN DT4 0DW |
| Buxton Close | DT4 9RG |
| Buxton Road | DT4 9PG DT4 9PH DT4 9PJ DT4 9PL DT4 9PN DT4 9PP DT4 9PQ DT4 9PW |
| Carrington Close | DT4 9QD |
| Chickerell Road | DT4 0BN DT4 0BP DT4 0BS DT4 0BT DT4 0BU DT4 0BW |
| Clearmount Road | DT4 9LD DT4 9LE DT4 9LF |
| Cleves Close | DT4 9JU |
| Connaught Gardens | DT4 9PB DT4 9PD |
| Connaught Road | DT4 0SA |
| Cross Road | DT4 9QX |
| Dawlish Crescent | DT4 9JN DT4 9JW |
| Doncaster Road | DT4 9JH DT4 9JJ DT4 9JQ |
| Douglas Road | DT4 9XU DT4 9XW |
| Down Road | DT4 0SB |
| Downclose | DT4 9JL |
| Emerson Road | DT4 0DP |
| Everest Road | DT4 0DG DT4 0DQ |
| Fair Close | DT4 0DF |
| Faircross Avenue | DT4 0DD |
| Glebe Close | DT4 9RL |
| Glen Avenue | DT4 0DA |
| Gypsy Lane | DT4 0BZ |
| Henry Close | DT4 9TX |
| Hillbourne Road | DT4 9JD DT4 9JE |
| Hillcrest Road | DT4 9JP DT4 9JR |
| Howard Close | DT4 9JT |
| Khartoum Road | DT4 9LG |
| Lansdowne Square | DT4 9QT |
| Lomond Drive | DT4 0DH |
| Lydwell Close | DT4 9PX |
| Marina Gardens | DT4 9QZ |
| Pretoria Terrace | DT4 0DJ |
| Prince Of Wales Road | DT4 0BY |
| Purbeck Close | DT4 9QU |
| Rectory Way | DT4 9RJ |
| Russell Avenue | DT4 9RA |
| Rylands Lane | DT4 9PY DT4 9PZ DT4 9QA |
| Southdown Road | DT4 9LJ DT4 9LL |
| Southlands Road | DT4 9LH DT4 9LQ |
| St Annes Road | DT4 9LW |
| St Davids Road | DT4 9LP DT4 9LR |
| St Martins Road | DT4 9LN |
| St Michaels Court | DT4 0DS |
| Stoke Road | DT4 9JF |
| Sudan Road | DT4 9LB |
| Tennyson Road | DT4 0DL |
| Thornlow Close | DT4 9GJ |
| Verne Close | DT4 0RZ |
| Verne Road | DT4 0RX |
| Verne Way | DT4 0RY |
| Whitecross Drive | DT4 9PA |
| Wilton Drive | DT4 0DE |
| Winterbourne Copse | DT4 9XY |
| Wyke Road | DT4 9QE DT4 9QF DT4 9QN DT4 9QP DT4 9QQ |
Transport near Weymouth West
-
Weymouth Station
-
Upwey Station
-
Dorchester South Station
-
Dorchester West Station
-
Moreton (Dorset) Station
- FAQ
- Price Paid By Year
- Property Type Price
Frequently asked questions about Weymouth West
What is the average price for a property for sale in Weymouth West?
The average price for a property for sale in Weymouth West is £310,618. This amount is 1% higher than the average price in Weymouth. There are 1,882 property listings for sale in Weymouth West.
What streets have the most expensive properties for sale in Weymouth West?
The streets with the most expensive properties for sale in Weymouth West are Lomond Drive at an average of £750,000, Whitecross Drive at an average of £607,600 and Wyke Road at an average of £604,400.
What streets have the most affordable properties for sale in Weymouth West?
The streets with the most affordable properties for sale in Weymouth West are Howard Close at an average of £142,500, Prince Of Wales Road at an average of £173,750 and Hillcrest Road at an average of £190,000.
Which train stations are available in or near Weymouth West?
Some of the train stations available in or near Weymouth West are Weymouth, Upwey and Dorchester South.
Property Price Paid in Weymouth West by Year
The average sold property price by year was:
| Year | Average Sold Price | Price Change |
Sold Properties
|
|---|---|---|---|
| 2025 | £290,434 | -14% |
54 Properties |
| 2024 | £329,786 | 6% |
62 Properties |
| 2023 | £309,387 | -12% |
80 Properties |
| 2022 | £346,186 | 18% |
77 Properties |
| 2021 | £285,510 | 7% |
99 Properties |
| 2020 | £266,486 | 3% |
59 Properties |
| 2019 | £257,543 | -3% |
76 Properties |
| 2018 | £264,801 | 0,4% |
78 Properties |
| 2017 | £263,663 | 1% |
93 Properties |
| 2016 | £261,182 | 11% |
79 Properties |
| 2015 | £232,979 | 7% |
83 Properties |
| 2014 | £216,285 | -15% |
108 Properties |
| 2013 | £249,745 | 12% |
74 Properties |
| 2012 | £220,899 | -2% |
66 Properties |
| 2011 | £225,590 | 1% |
65 Properties |
| 2010 | £222,555 | 9% |
49 Properties |
| 2009 | £203,097 | -8% |
65 Properties |
| 2008 | £220,132 | -12% |
45 Properties |
| 2007 | £247,495 | 11% |
81 Properties |
| 2006 | £219,047 | 6% |
147 Properties |
| 2005 | £206,912 | 12% |
106 Properties |
| 2004 | £181,571 | -3% |
95 Properties |
| 2003 | £186,941 | 21% |
91 Properties |
| 2002 | £148,035 | 27% |
114 Properties |
| 2001 | £107,570 | 1% |
133 Properties |
| 2000 | £106,287 | 13% |
130 Properties |
| 1999 | £92,345 | 24% |
120 Properties |
| 1998 | £70,159 | 8% |
105 Properties |
| 1997 | £64,377 | -5% |
70 Properties |
| 1996 | £67,444 | 4% |
99 Properties |
| 1995 | £65,014 | - |
71 Properties |
Property Price per Property Type in Weymouth West
Here you can find historic sold price data in order to help with your property search.
The average Property Paid Price for specific property types in the last three years are:
| Property Type | Average Sold Price | Sold Properties |
|---|---|---|
| Semi Detached House | £301,489.00 | 48 Semi Detached Houses |
| Detached House | £492,367.00 | 49 Detached Houses |
| Terraced House | £238,744.00 | 56 Terraced Houses |
| Flat | £207,302.00 | 43 Flats |

