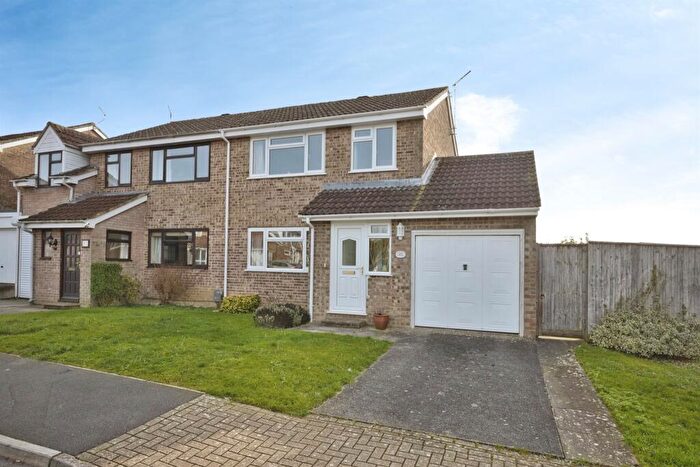
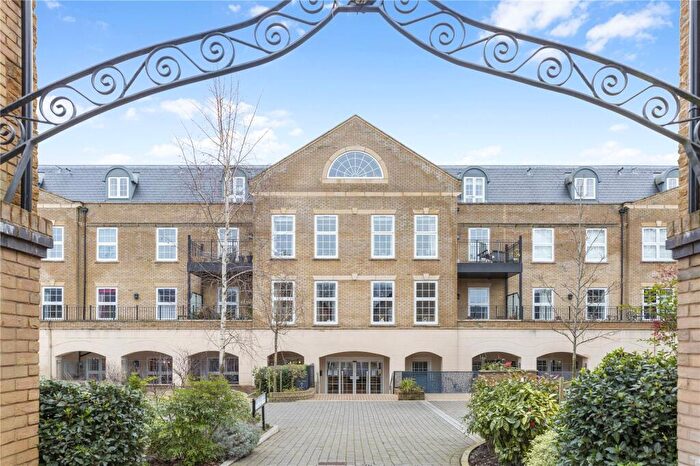
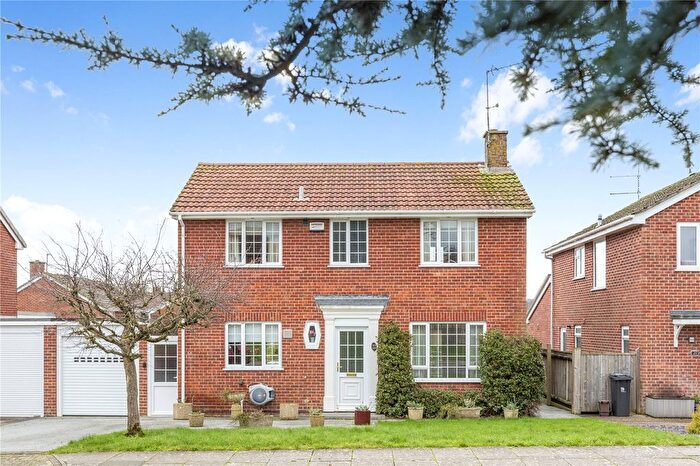
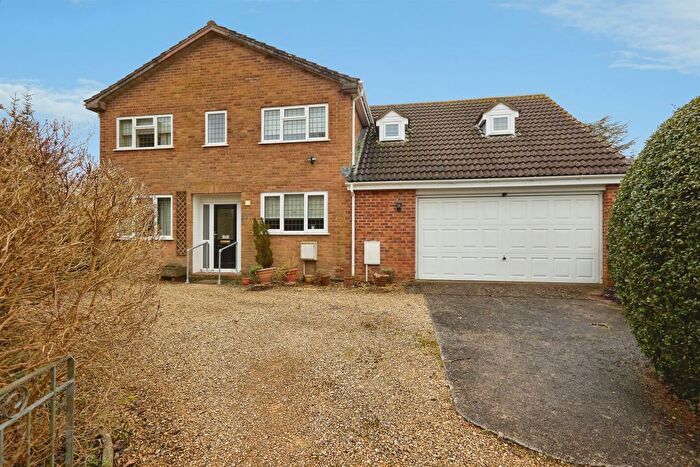
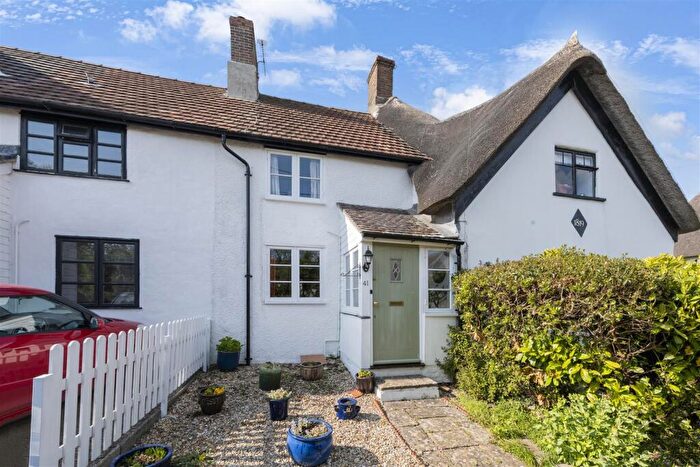
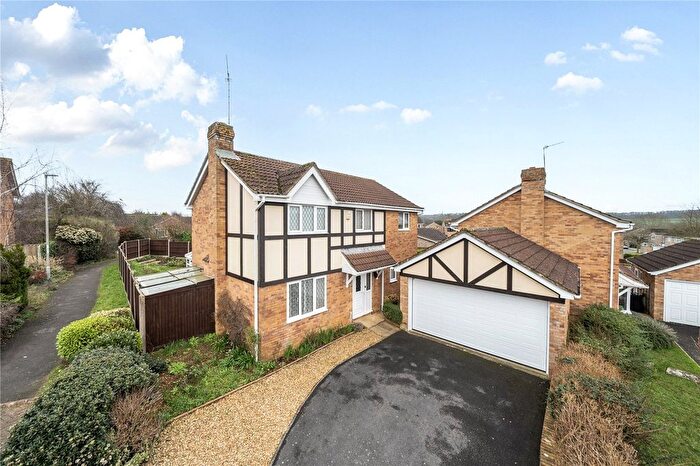
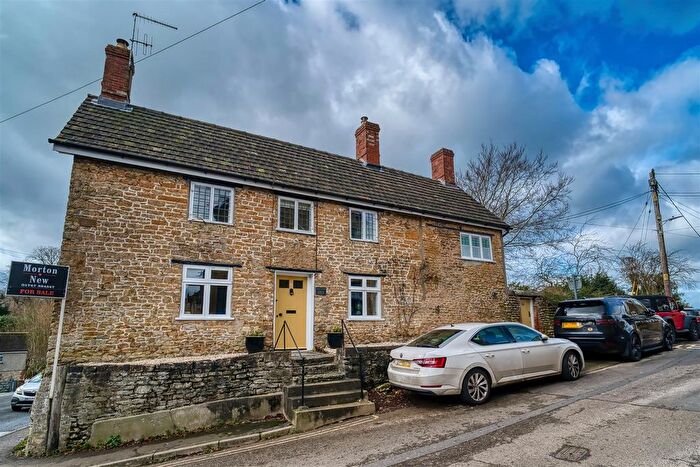
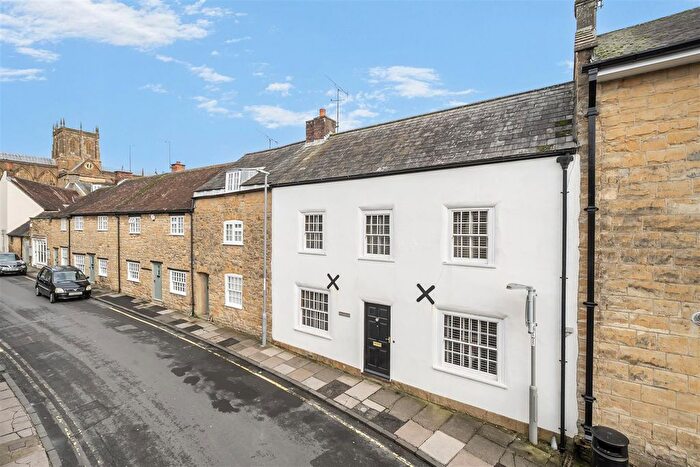
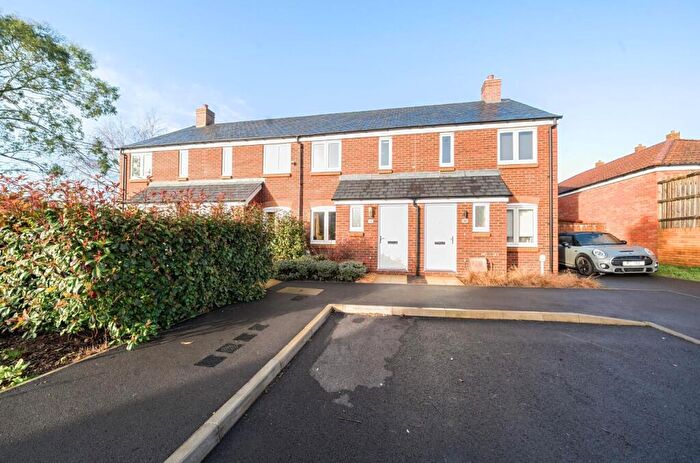
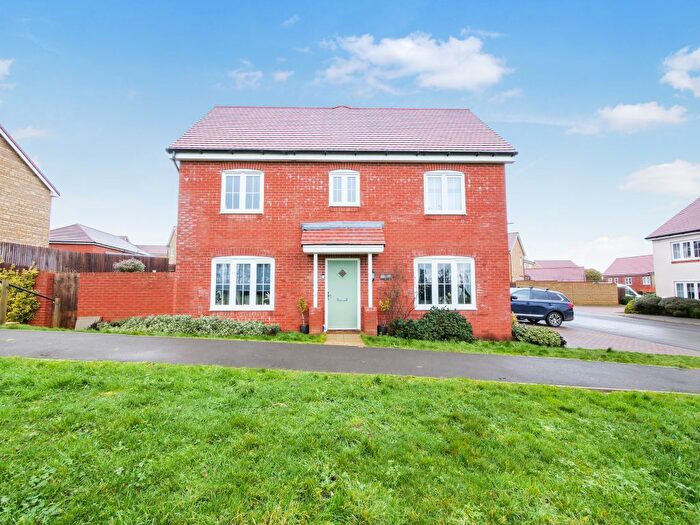
Houses for sale & to rent in Cam Vale, Sherborne
House Prices in Cam Vale
Properties in Cam Vale have an average house price of £499,267.00 and had 59 Property Transactions within the last 3 years¹.
Cam Vale is an area in Sherborne, Dorset with 733 households², where the most expensive property was sold for £950,000.00.
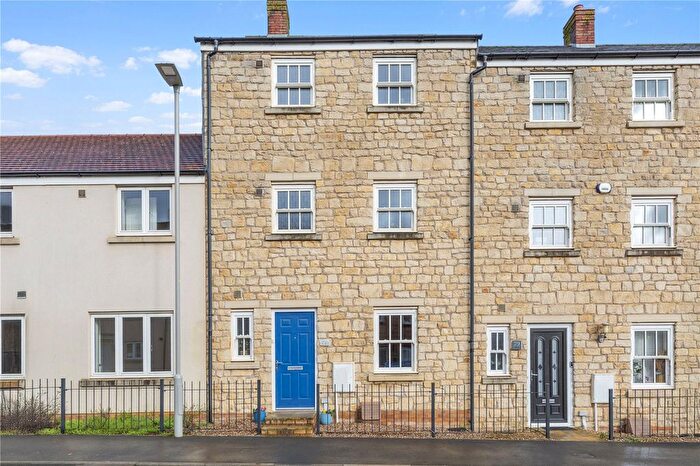
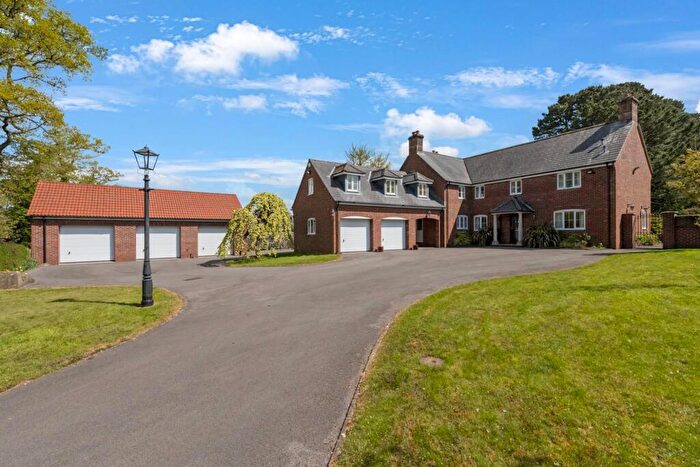
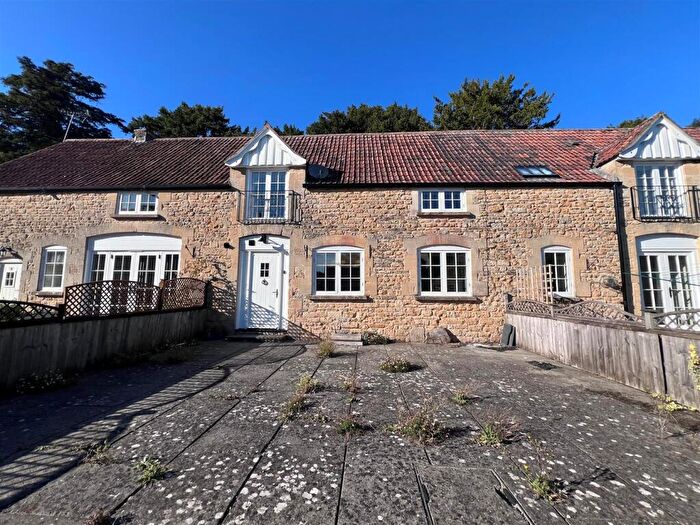
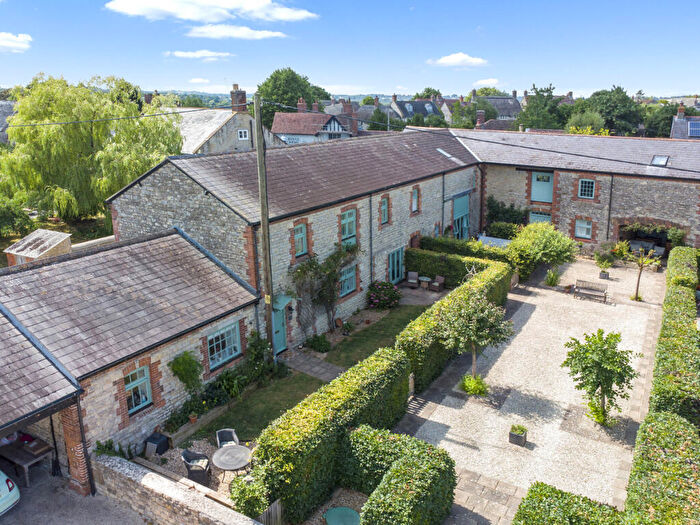
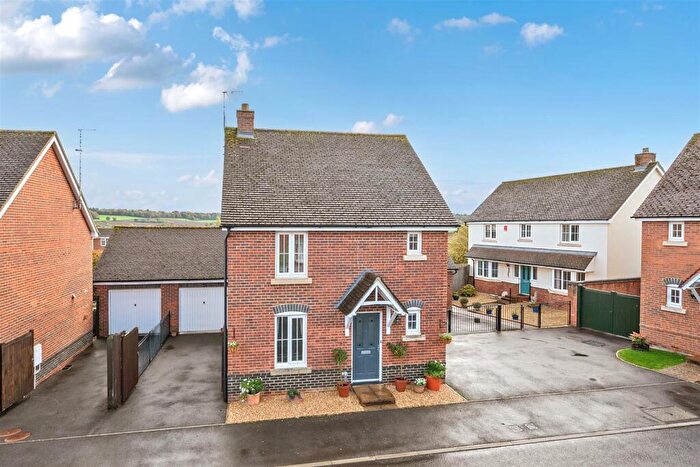
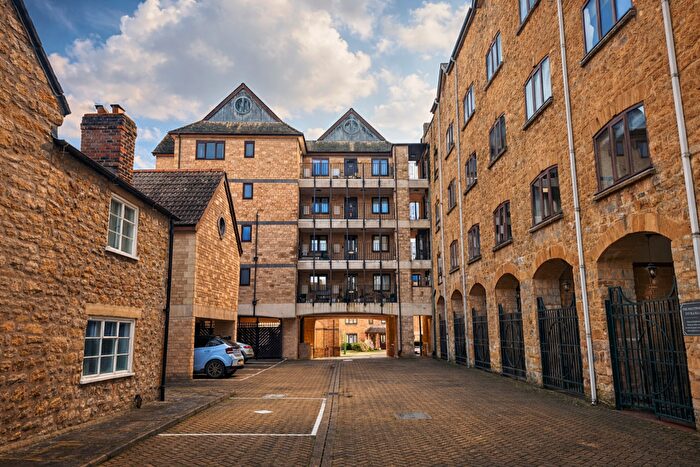
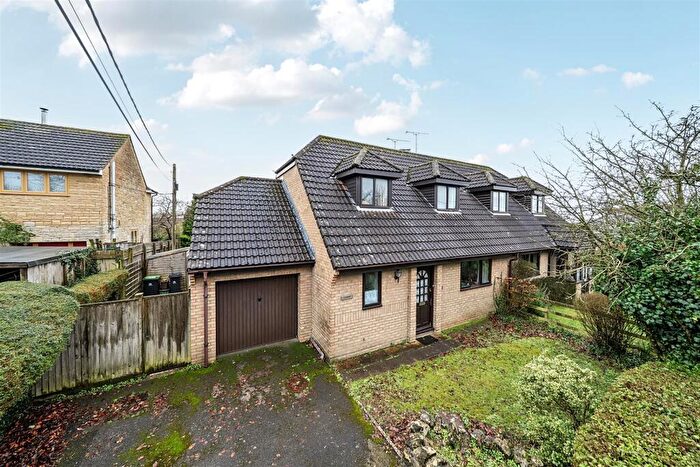
Properties for sale in Cam Vale
Roads and Postcodes in Cam Vale
Navigate through our locations to find the location of your next house in Cam Vale, Sherborne for sale or to rent.
| Streets | Postcodes |
|---|---|
| Back Drove | DT9 6JD |
| Batcombe Road | DT9 6JA |
| Boys Hill | DT9 5PJ |
| Bradford Lane | DT9 6ES |
| Caundle Marsh | DT9 5JS |
| Chetnole Road | DT9 6HJ |
| Church Lane | DT9 6HS |
| Club Corner Cottages | DT9 6JL |
| Crouch Lane | DT9 5LP |
| Dene Close | DT9 5LU |
| Fosters Hill | DT9 5LQ |
| Foxs Close | DT9 5LH |
| Holmbushes | DT9 6HU |
| Iles Cottages | DT9 6HW |
| Kings Close | DT9 5PW |
| Leweston Road | DT9 6EL |
| Miz Maze | DT9 6JJ |
| Mundens Lane | DT9 5HU |
| New Cross | DT9 6EJ |
| New Cross Cottages | DT9 6ER |
| Old School Close | DT9 5HT |
| Orchard Close | DT9 5PP |
| Packers Hill | DT9 5LN |
| Quarry Lane | DT9 5NY |
| Roselyn Crescent | DT9 5HX |
| Sandhills Cottages | DT9 5LE |
| South Street | DT9 6JF DT9 6JG |
| Spring Lane | DT9 5PB |
| St Andrews Close | DT9 6HN |
| Stony Lane | DT9 5LJ |
| The Bannells | DT9 5PQ |
| The Plot | DT9 5LG |
| Totnell | DT9 6HT |
| Vincents Close | DT9 5JH |
| West Lane | DT9 5JP |
| Whistle Water | DT9 5FG |
| DT9 5HP DT9 5HR DT9 5JW DT9 5LD DT9 5LF DT9 5LL DT9 5NT DT9 5NZ DT9 5PA DT9 5PD DT9 5PF DT9 5PG DT9 5PH DT9 5PN DT9 5PX DT9 6EW DT9 6HA DT9 6HL DT9 6HP DT9 6QX |
Transport near Cam Vale
- FAQ
- Price Paid By Year
- Property Type Price
Frequently asked questions about Cam Vale
What is the average price for a property for sale in Cam Vale?
The average price for a property for sale in Cam Vale is £499,267. This amount is 25% higher than the average price in Sherborne. There are 1,362 property listings for sale in Cam Vale.
What streets have the most expensive properties for sale in Cam Vale?
The streets with the most expensive properties for sale in Cam Vale are Back Drove at an average of £705,000, Orchard Close at an average of £647,500 and Packers Hill at an average of £627,500.
What streets have the most affordable properties for sale in Cam Vale?
The streets with the most affordable properties for sale in Cam Vale are South Street at an average of £172,500, Mundens Lane at an average of £278,500 and Roselyn Crescent at an average of £285,000.
Which train stations are available in or near Cam Vale?
Some of the train stations available in or near Cam Vale are Sherborne, Yetminster and Thornford.
Property Price Paid in Cam Vale by Year
The average sold property price by year was:
| Year | Average Sold Price | Price Change |
Sold Properties
|
|---|---|---|---|
| 2025 | £502,866 | 10% |
24 Properties |
| 2024 | £450,117 | -20% |
17 Properties |
| 2023 | £540,888 | -2% |
18 Properties |
| 2022 | £550,125 | 16% |
22 Properties |
| 2021 | £463,638 | 21% |
38 Properties |
| 2020 | £367,770 | -6% |
24 Properties |
| 2019 | £389,797 | -4% |
21 Properties |
| 2018 | £405,907 | 6% |
26 Properties |
| 2017 | £381,861 | 25% |
27 Properties |
| 2016 | £286,523 | -20% |
21 Properties |
| 2015 | £345,000 | 8% |
30 Properties |
| 2014 | £318,819 | -6% |
36 Properties |
| 2013 | £339,292 | 18% |
19 Properties |
| 2012 | £278,718 | -36% |
16 Properties |
| 2011 | £378,502 | 9% |
21 Properties |
| 2010 | £346,125 | 7% |
20 Properties |
| 2009 | £321,572 | -8% |
27 Properties |
| 2008 | £346,136 | 6% |
18 Properties |
| 2007 | £324,760 | 11% |
34 Properties |
| 2006 | £288,382 | 1% |
28 Properties |
| 2005 | £285,541 | -5% |
30 Properties |
| 2004 | £300,474 | 17% |
31 Properties |
| 2003 | £249,569 | 28% |
18 Properties |
| 2002 | £179,988 | -11% |
27 Properties |
| 2001 | £199,347 | 29% |
32 Properties |
| 2000 | £140,598 | -8% |
25 Properties |
| 1999 | £151,262 | 15% |
33 Properties |
| 1998 | £129,032 | 6% |
26 Properties |
| 1997 | £121,193 | 15% |
36 Properties |
| 1996 | £102,768 | 4% |
41 Properties |
| 1995 | £99,120 | - |
20 Properties |
Property Price per Property Type in Cam Vale
Here you can find historic sold price data in order to help with your property search.
The average Property Paid Price for specific property types in the last three years are:
| Property Type | Average Sold Price | Sold Properties |
|---|---|---|
| Semi Detached House | £338,200.00 | 5 Semi Detached Houses |
| Detached House | £543,408.00 | 49 Detached Houses |
| Terraced House | £227,760.00 | 5 Terraced Houses |

