
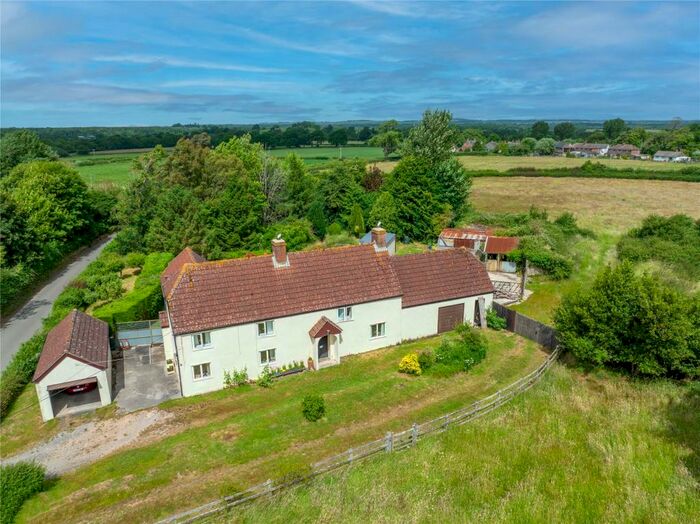
Houses for sale in Lydden Vale, Sherborne
House Prices in Lydden Vale
Properties in Lydden Vale have an average house price of £472k and had 2 Property Transactions within the last 3 years¹.
Lydden Vale is an area in Sherborne, Dorset with 91 households², where the most expensive property was sold for £595k.
Properties for sale in Lydden Vale

Previously listed properties in Lydden Vale

![]()
If you are looking to sell your house, let it out, or receive a property valuation, an expert can help you.
Click the button below to get started.


Roads and Postcodes in Lydden Vale
Navigate through our locations to find the location of your next house in Lydden Vale, Sherborne for sale or to rent.
| Streets | Postcodes |
|---|---|
| Crossways | DT9 5QD |
| Locks Lane | DT9 5QE |
| Newlands Lane | DT9 5QG |
| Old Rectory Drive | DT9 5QR |
| Old Rectory Lane | DT9 5QB |
| DT9 5PY DT9 5PZ DT9 5QA DT9 5QF DT9 5QJ DT9 5QQ |
Property price trends in Lydden Vale
According to the latest Land Registry data, the average home in Lydden Vale sold for £472,475 in 2023. That figure comes from 81 sales logged over the past 28 years.
Prices have continued to climb over the last three years. Compared with 2019, when the typical sale came in around £445,000, that's a rise of roughly 6.2%.
Looking back five years, average prices are up about 91.3% since 2018, a gain of around £225,475 in cash terms.
Zoom out to the past decade for the fuller picture. Back in 2013, homes here averaged £314,600, so the typical sold price has climbed about 50.2% since then, roughly 4.2% a year. Stretch the view to fifteen years and that annual pace edges up closer to 5.9%.
Frequently asked questions about Lydden Vale
What is the average price for a property for sale in Lydden Vale?
The average price for a property for sale in Lydden Vale is £472,475. This amount is 19% higher than the average price in Sherborne. There are 15 property listings for sale in Lydden Vale.
Which train stations are available in or near Lydden Vale?
Some of the train stations available in or near Lydden Vale are Chetnole, Yetminster and Sherborne.
Property Price Paid in Lydden Vale by Year
The average sold property price by year was:
| Year | Average Sold Price | Price Change |
Sold Properties
|
|---|---|---|---|
| 2023 | £472,475 | 8% |
2 Properties |
| 2022 | £432,500 | -39% |
4 Properties |
| 2021 | £600,000 | 26% |
1 Property |
| 2019 | £445,000 | 44% |
1 Property |
| 2018 | £247,000 | -415% |
3 Properties |
| 2017 | £1,271,333 | 55% |
3 Properties |
| 2016 | £575,875 | 24% |
2 Properties |
| 2015 | £435,500 | 46% |
4 Properties |
| 2014 | £235,416 | -34% |
6 Properties |
| 2013 | £314,600 | -8% |
5 Properties |
Property Price per Property Type in Lydden Vale
Here you can find historic sold price data in order to help with your property search.
The average Property Paid Price for specific property types in the last three years are:
| Property Type | Average Sold Price | Sold Properties |
|---|---|---|
| Semi Detached House | £350,000.00 | 1 Semi Detached House |
| Detached House | £594,950.00 | 1 Detached House |
