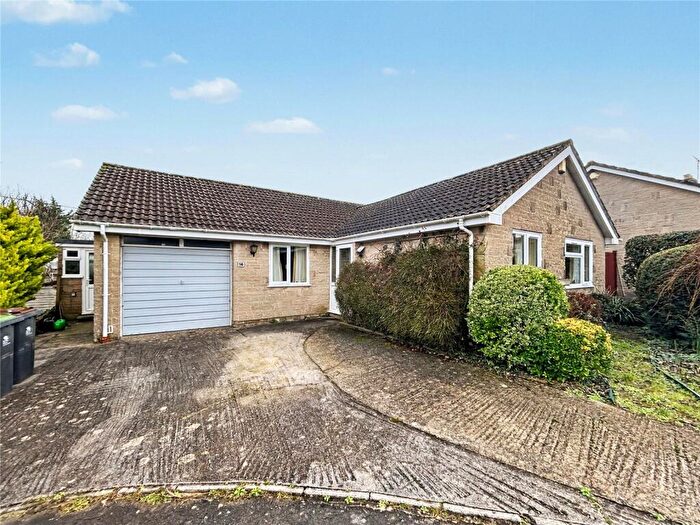
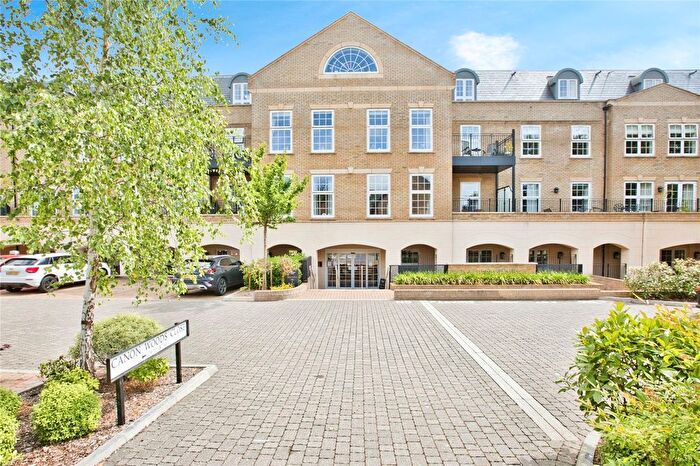
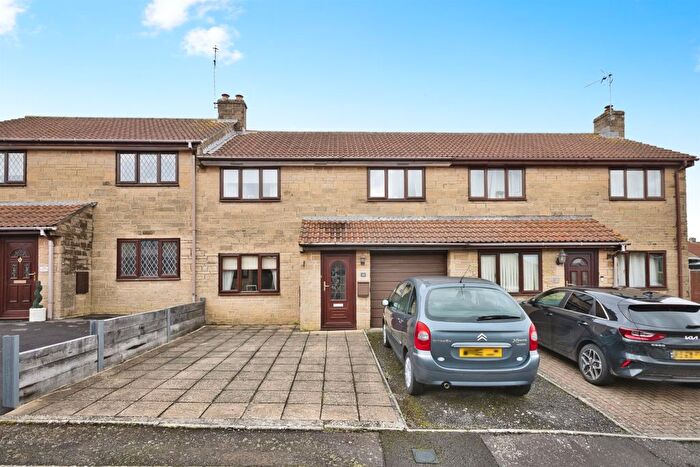
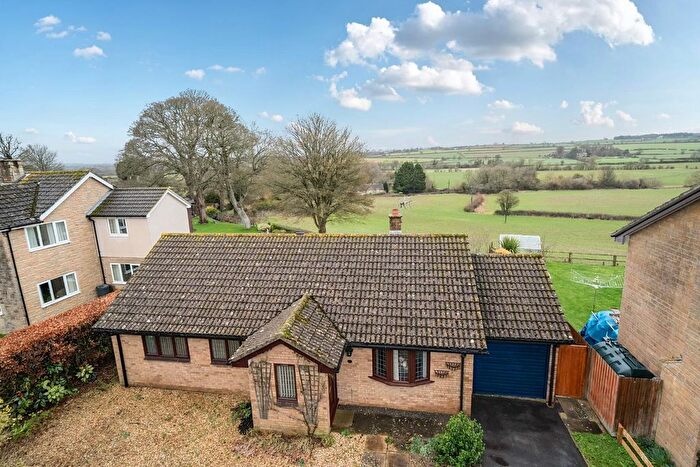
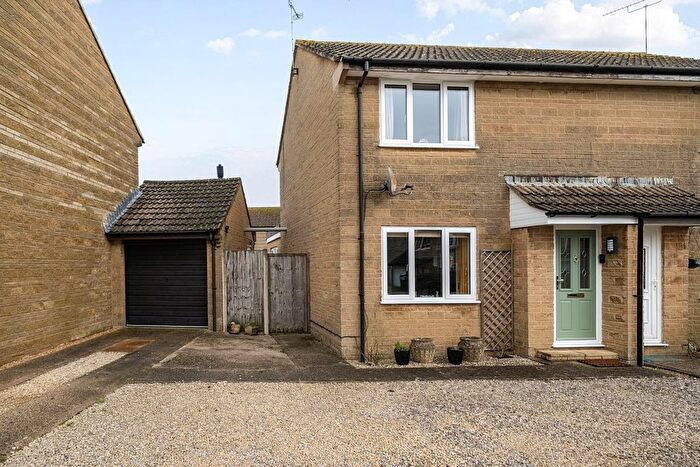
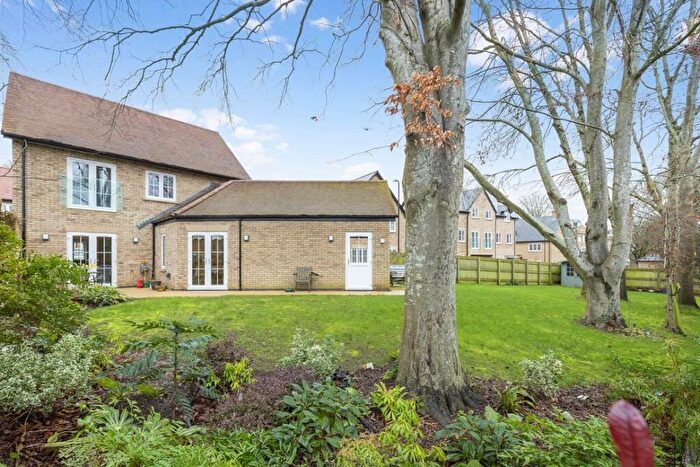
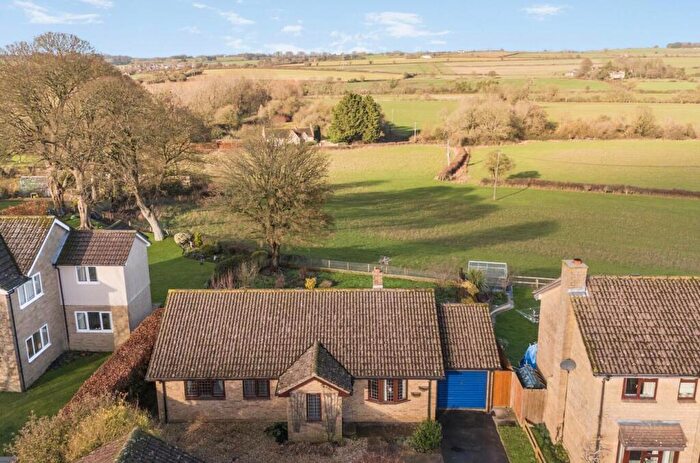
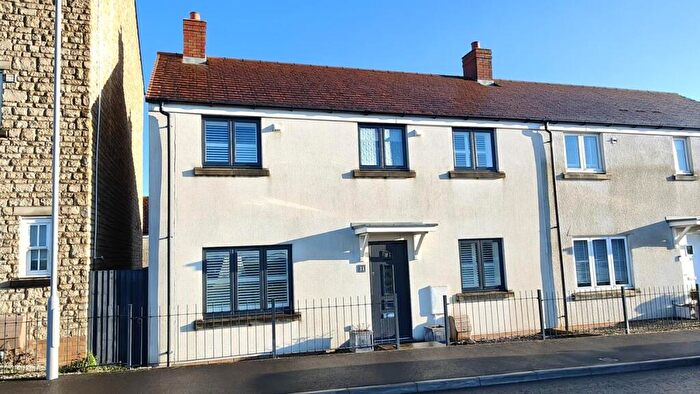
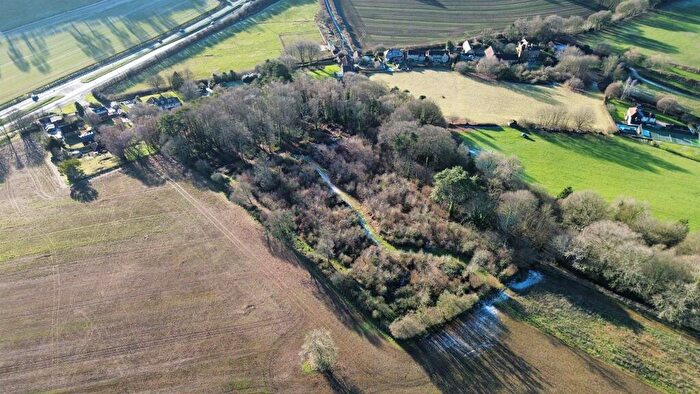
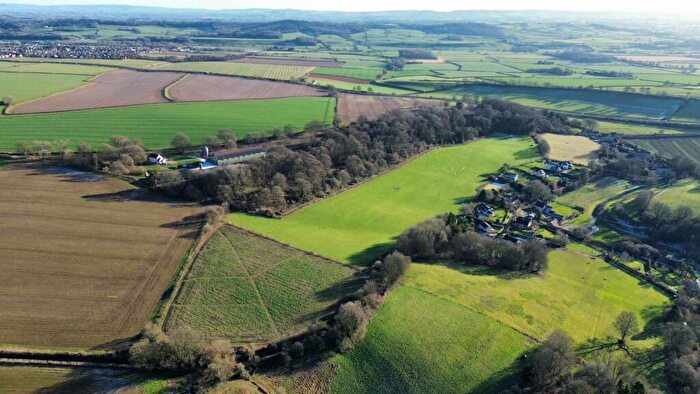
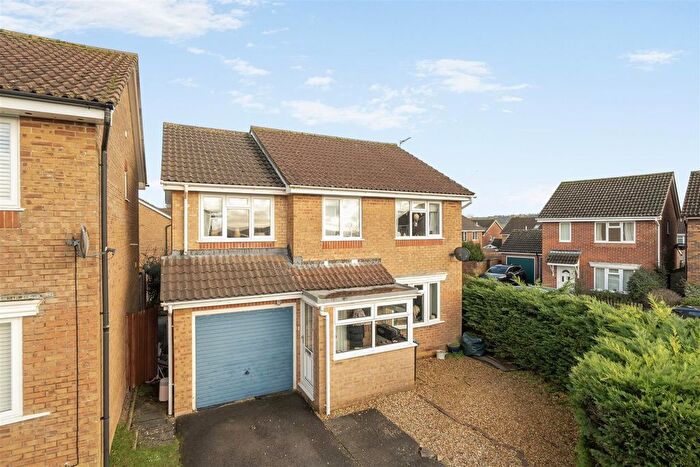
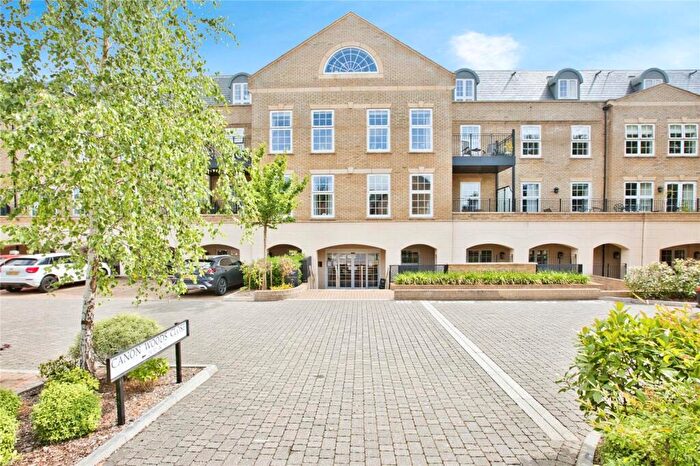
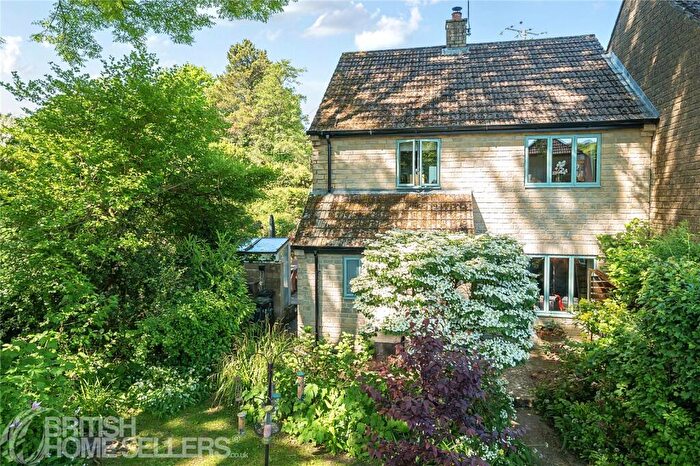
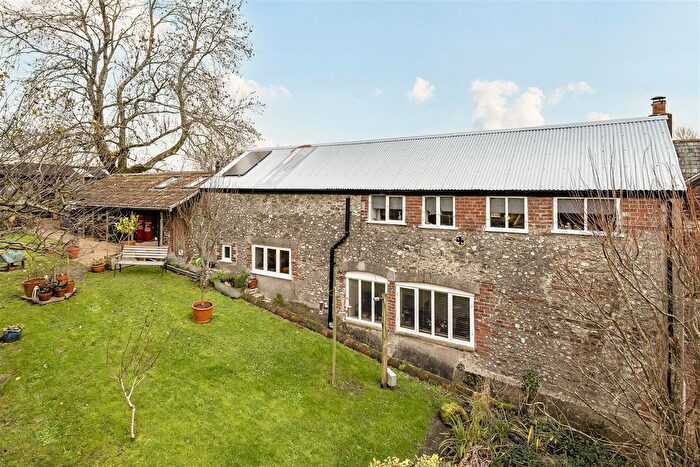
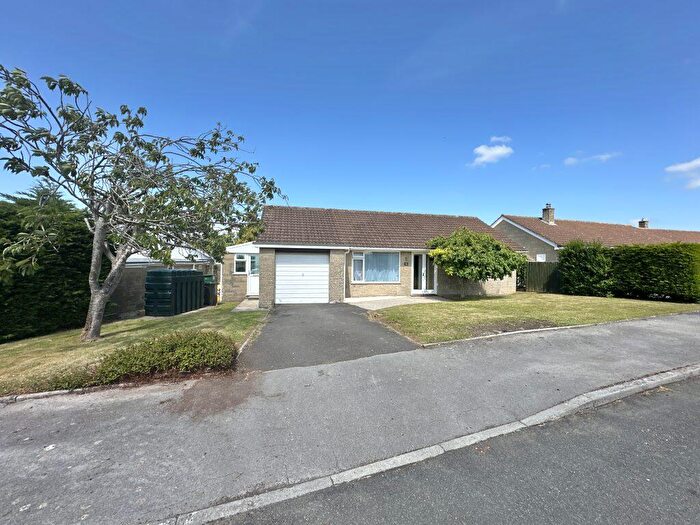
Houses for sale & to rent in Yetminster, Sherborne
House Prices in Yetminster
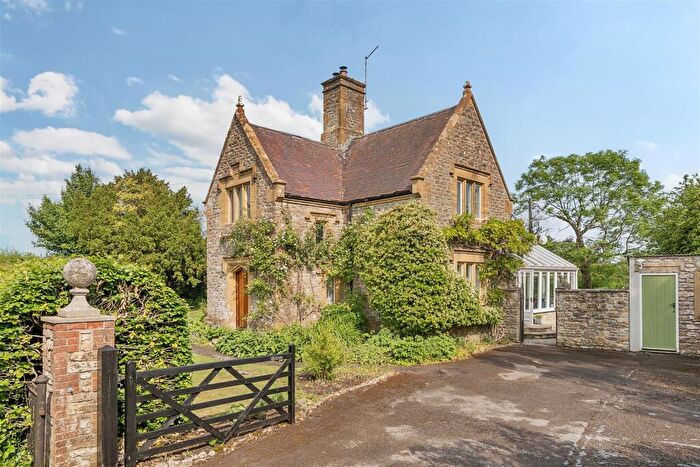
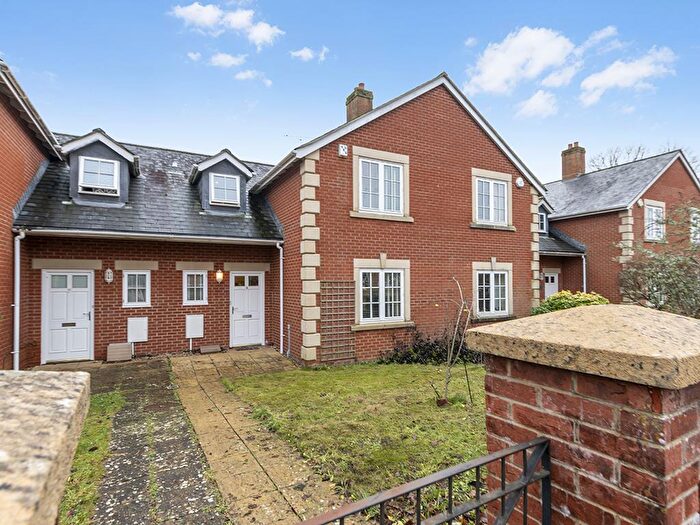
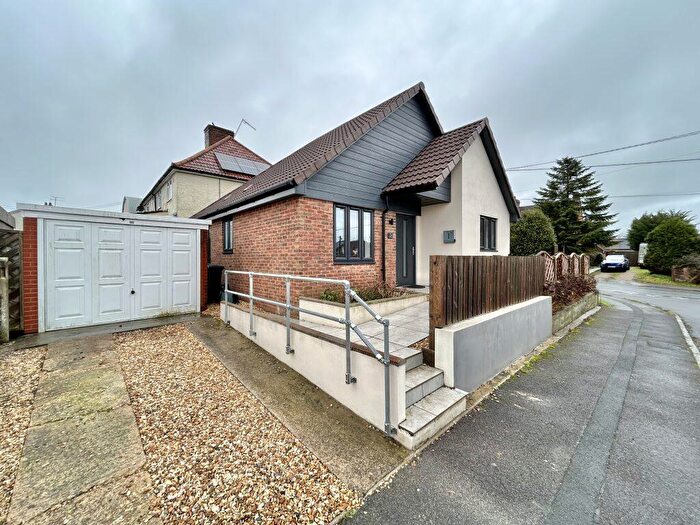
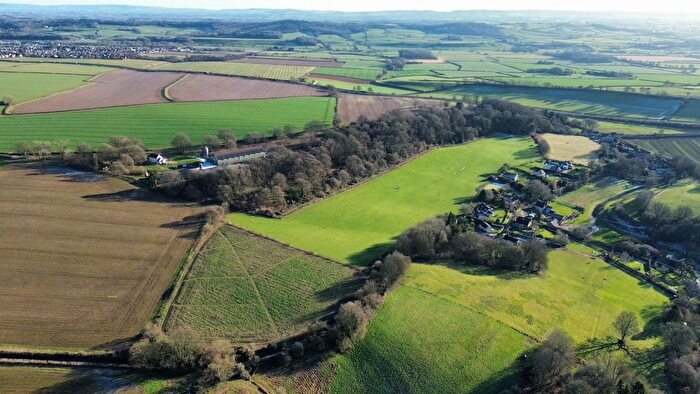
Properties in Yetminster have an average house price of £470,991.00 and had 56 Property Transactions within the last 3 years¹.
Yetminster is an area in Sherborne, Dorset with 766 households², where the most expensive property was sold for £2,150,000.00.
Properties for sale in Yetminster
Roads and Postcodes in Yetminster
Navigate through our locations to find the location of your next house in Yetminster, Sherborne for sale or to rent.
| Streets | Postcodes |
|---|---|
| Alton Mead Lane | DT9 6FJ DT9 6BN |
| Back Lane | DT9 6PL |
| Bazils | DT9 6LZ |
| Birch Lane | DT9 6NB |
| Bound Lane | DT9 6BJ |
| Bower Court | DT9 6NS |
| Brierley Hay | DT9 6NR |
| Brister End | DT9 6NG DT9 6NH DT9 6NL DT9 6NN |
| Bucklers Mead | DT9 6LA |
| Chapel Lane | DT9 6LJ |
| Chapel Meadow | DT9 6NT |
| Chetnole Road | DT9 6HQ |
| Church Close | DT9 6PN |
| Church Street | DT9 6LG DT9 6LQ |
| Cloverhay | DT9 6LB |
| Clovermead | DT9 6LR |
| Coles Lane | DT9 6LP |
| Croft Corner | DT9 6JU |
| Cuckoo Hill | DT9 6JP |
| Downfield | DT9 6JS |
| Downs Lane | DT9 6NJ |
| Eastlands | DT9 6NQ DT9 6NF |
| Elsford Cottages | DT9 6JT |
| Frylake Meadow | DT9 6EF |
| Grove Cottages | DT9 6PB |
| High Street | DT9 6LF |
| Higher Totnell | DT9 6HZ |
| Lakegate Lane | DT9 6EY |
| Lamb Plot | DT9 6PQ |
| Melbury Road | DT9 6LX DT9 6LY DT9 6NA |
| Mill Lane | DT9 6ND |
| Neals Lane | DT9 6PF |
| New Buildings | DT9 6JR |
| North End | DT9 6HR |
| North Grove | DT9 6PG |
| Queen Street | DT9 6LL DT9 6LN |
| Ryme Road | DT9 6JY |
| School Lane | DT9 6PA |
| Seven Ash Common | DT9 6ET DT9 6HY |
| Shearstones | DT9 6NW |
| St Osmund Close | DT9 6LU |
| Station Road | DT9 6LH |
| Stockwood Road | DT9 6PJ |
| Stonyacres | DT9 6LS DT9 6LT |
| Sunnyside Court | DT9 6NP |
| Sussex Farm Way | DT9 6SZ |
| The Marsh | DT9 6JE |
| The Pound | DT9 5PT |
| Thornford Road | DT9 6LW DT9 6HG |
| Townsend | DT9 5NX |
| Uplands | DT9 6JZ |
| White House Lane | DT9 6HX |
| Wildewood Rise | DT9 5FZ |
| DT9 6JX DT9 6NE DT9 6NU DT9 6NX DT9 6NY DT9 6NZ DT9 6PD DT9 6PE DT9 5NU DT9 5PR DT9 5PS DT9 5PU DT9 6EN DT9 6EP DT9 6HH DT9 6JB DT9 6JH DT9 6JW DT9 6EZ DT9 6FA DT9 6FB |
Transport near Yetminster
- FAQ
- Price Paid By Year
- Property Type Price
Frequently asked questions about Yetminster
What is the average price for a property for sale in Yetminster?
The average price for a property for sale in Yetminster is £470,991. This amount is 18% higher than the average price in Sherborne. There are 904 property listings for sale in Yetminster.
What streets have the most expensive properties for sale in Yetminster?
The streets with the most expensive properties for sale in Yetminster are Church Street at an average of £1,158,333, Church Close at an average of £785,000 and Chapel Meadow at an average of £722,483.
What streets have the most affordable properties for sale in Yetminster?
The streets with the most affordable properties for sale in Yetminster are Sunnyside Court at an average of £205,000, Clovermead at an average of £225,000 and Bower Court at an average of £233,000.
Which train stations are available in or near Yetminster?
Some of the train stations available in or near Yetminster are Yetminster, Chetnole and Thornford.
Property Price Paid in Yetminster by Year
The average sold property price by year was:
| Year | Average Sold Price | Price Change |
Sold Properties
|
|---|---|---|---|
| 2025 | £446,614 | 19% |
14 Properties |
| 2024 | £362,727 | -67% |
22 Properties |
| 2023 | £607,147 | 28% |
20 Properties |
| 2022 | £438,173 | -4% |
26 Properties |
| 2021 | £457,006 | 21% |
32 Properties |
| 2020 | £360,961 | -0,5% |
26 Properties |
| 2019 | £362,636 | -22% |
33 Properties |
| 2018 | £441,683 | 19% |
27 Properties |
| 2017 | £358,096 | 15% |
26 Properties |
| 2016 | £305,480 | 11% |
27 Properties |
| 2015 | £271,730 | 2% |
29 Properties |
| 2014 | £266,944 | 5% |
18 Properties |
| 2013 | £253,107 | 6% |
21 Properties |
| 2012 | £238,190 | -22% |
21 Properties |
| 2011 | £289,576 | 14% |
13 Properties |
| 2010 | £248,437 | -19% |
16 Properties |
| 2009 | £295,178 | 8% |
19 Properties |
| 2008 | £270,850 | -4% |
15 Properties |
| 2007 | £281,190 | -5% |
26 Properties |
| 2006 | £296,315 | 11% |
30 Properties |
| 2005 | £264,170 | -1% |
26 Properties |
| 2004 | £267,297 | 19% |
32 Properties |
| 2003 | £217,289 | 8% |
26 Properties |
| 2002 | £200,459 | 26% |
31 Properties |
| 2001 | £148,616 | -2% |
39 Properties |
| 2000 | £151,269 | 19% |
28 Properties |
| 1999 | £122,725 | -1% |
31 Properties |
| 1998 | £124,445 | -6% |
34 Properties |
| 1997 | £131,337 | 32% |
36 Properties |
| 1996 | £89,759 | 15% |
49 Properties |
| 1995 | £76,372 | - |
36 Properties |
Property Price per Property Type in Yetminster
Here you can find historic sold price data in order to help with your property search.
The average Property Paid Price for specific property types in the last three years are:
| Property Type | Average Sold Price | Sold Properties |
|---|---|---|
| Semi Detached House | £323,940.00 | 15 Semi Detached Houses |
| Detached House | £611,272.00 | 31 Detached Houses |
| Terraced House | £256,700.00 | 10 Terraced Houses |

