
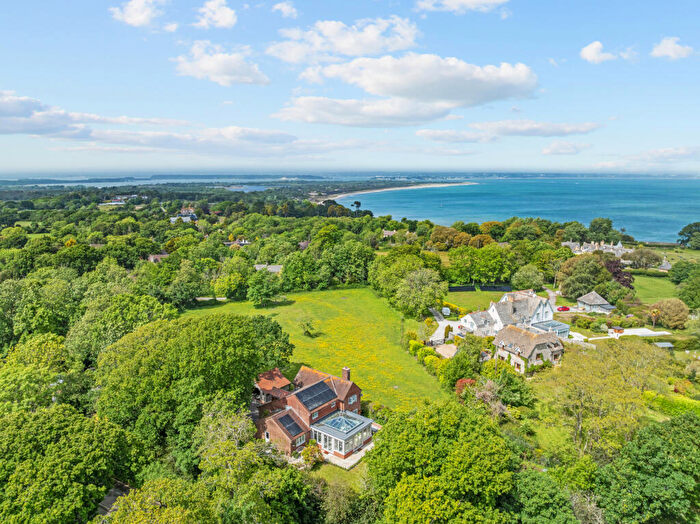
Houses for sale in Castle, Swanage
House Prices in Castle
Properties in Castle have an average house price of £1.53M and had 14 Property Transactions within the last 3 years¹.
Castle is an area in Swanage, Dorset with 139 households², where the most expensive property was sold for £4.5M.
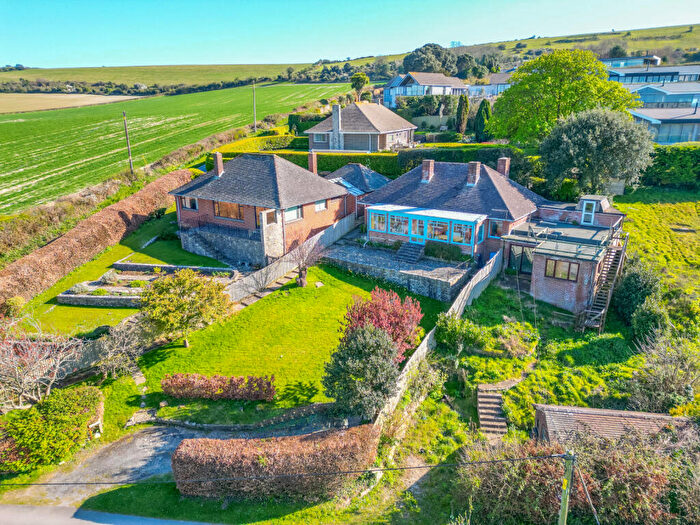
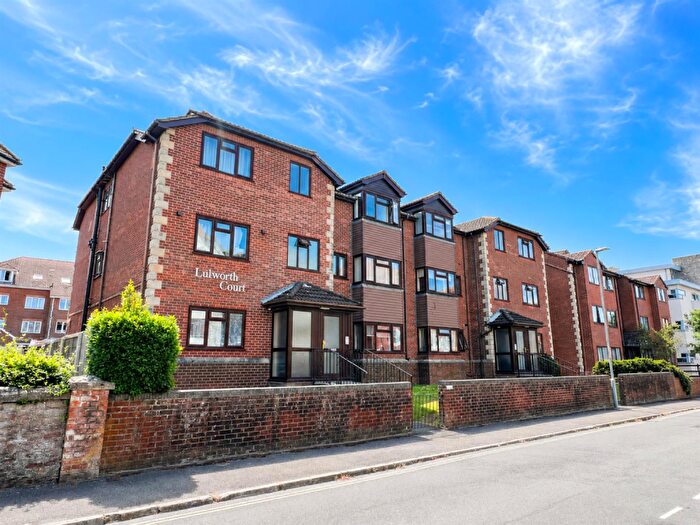
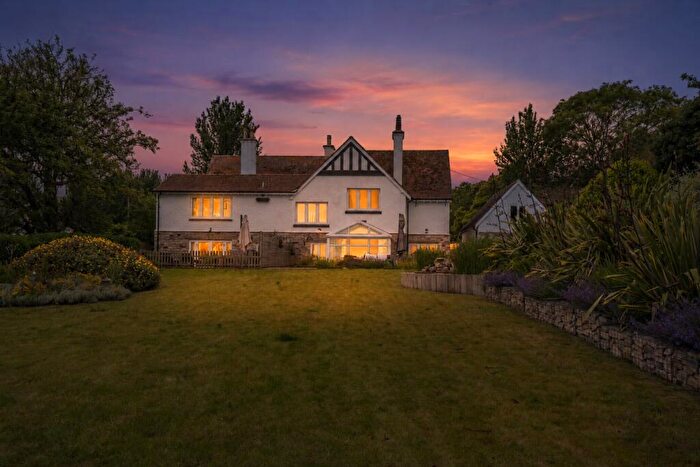
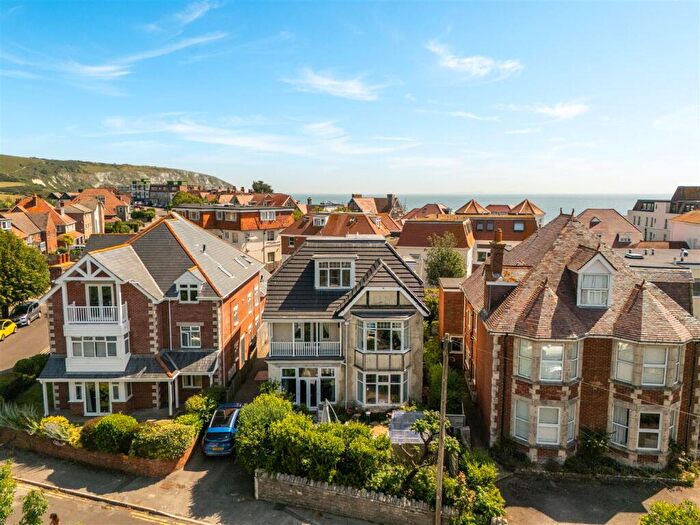
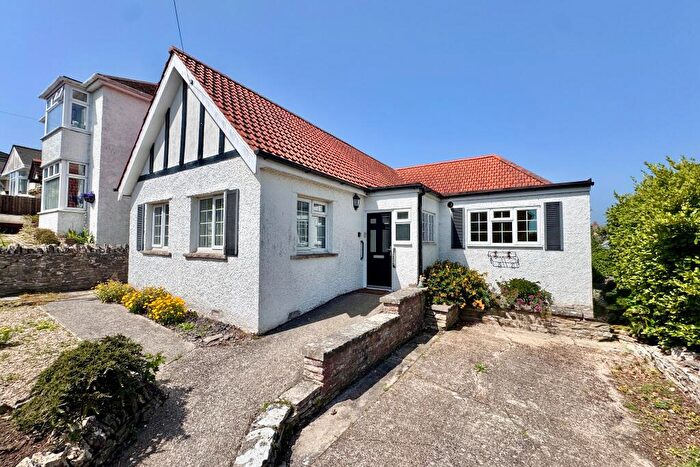
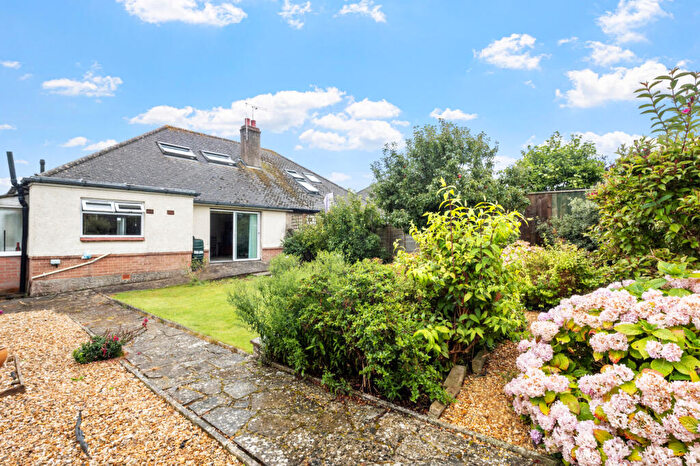
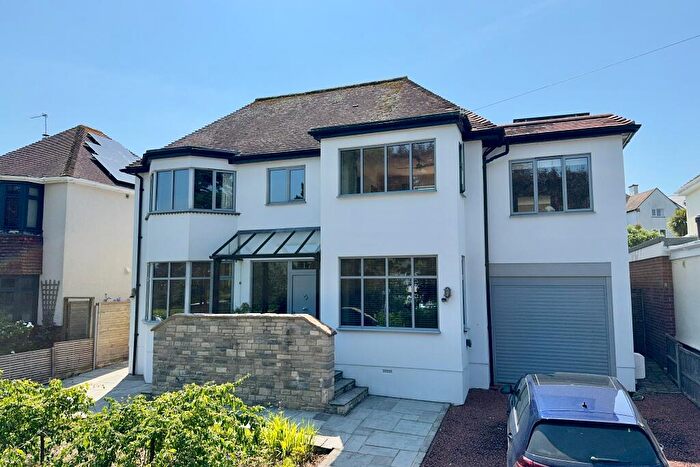
Properties for sale in Castle
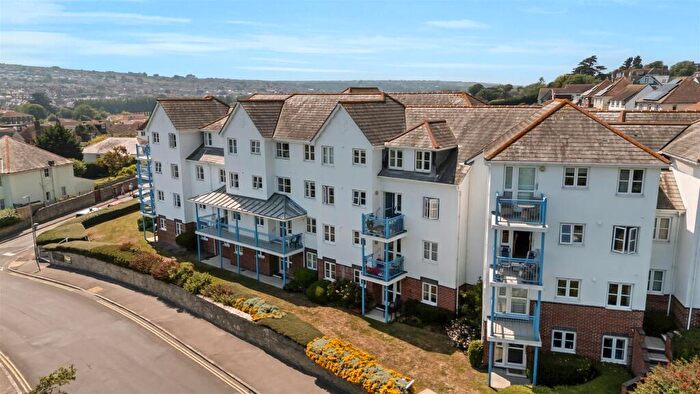
![]()
If you are looking to sell your house, let it out, or receive a property valuation, an expert can help you.
Click the button below to get started.
Roads and Postcodes in Castle
Navigate through our locations to find the location of your next house in Castle, Swanage for sale or to rent.
| Streets | Postcodes |
|---|---|
| Agglestone Road | BH19 3BZ |
| Beach Road | BH19 3AP |
| Corfe Road | BH19 3AB |
| Ferry Road | BH19 3AQ |
| Glebe Estate | BH19 3AS |
| Harmony Terrace | BH19 3AG |
| Heatherside | BH19 3DA |
| Heathgreen Road | BH19 3BU BH19 3BX BH19 3BY |
| Hillbottom | BH19 3LT |
| Manor Road | BH19 3AU |
| School Lane | BH19 3AJ |
| Swanage Road | BH19 3AD BH19 3AE |
| The Green | BH19 3BT |
| The Mount | BH19 3AF |
| Wadmore | BH19 3AY |
Property price trends in Castle
According to the latest Land Registry data, the average home in Castle sold for £4,500,000 in 2026. That figure comes from 207 sales logged over the past 31 years.
Prices have continued to climb over the last three years. Compared with 2023, when the typical sale came in around £1,387,083, that's a rise of roughly 224.4%.
Looking back five years, average prices are up about 183.9% since 2021, a gain of around £2,915,000 in cash terms.
Zoom out to the past decade for the fuller picture. Back in 2016, homes here averaged £1,088,428, so the typical sold price has climbed about 313.4% since then, roughly 15.3% a year. Stretch the view to fifteen years and that annual pace eases back to about 14.8%.
Frequently asked questions about Castle
What is the average price for a property for sale in Castle?
The average price for a property for sale in Castle is £1,530,000. This amount is 220% higher than the average price in Swanage. There are 3,091 property listings for sale in Castle.
What streets have the most expensive properties for sale in Castle?
The streets with the most expensive properties for sale in Castle are Manor Road at an average of £3,675,000, Swanage Road at an average of £1,457,500 and Beach Road at an average of £987,500.
What streets have the most affordable properties for sale in Castle?
The streets with the most affordable properties for sale in Castle are Heathgreen Road at an average of £452,500, Heatherside at an average of £607,500 and Harmony Terrace at an average of £865,000.
Which train stations are available in or near Castle?
Some of the train stations available in or near Castle are Poole, Parkstone and Branksome.
Property Price Paid in Castle by Year
The average sold property price by year was:
| Year | Average Sold Price | Price Change |
Sold Properties
|
|---|---|---|---|
| 2026 | £4,500,000 | 79% |
1 Property |
| 2025 | £926,875 | -76% |
4 Properties |
| 2024 | £1,630,000 | 15% |
3 Properties |
| 2023 | £1,387,083 | 32% |
6 Properties |
| 2022 | £944,566 | -68% |
3 Properties |
| 2021 | £1,585,000 | 47% |
6 Properties |
| 2020 | £835,000 | 63% |
2 Properties |
| 2019 | £307,725 | -193% |
2 Properties |
| 2018 | £902,857 | 2% |
7 Properties |
| 2017 | £888,750 | -22% |
8 Properties |
Property Price per Property Type in Castle
Here you can find historic sold price data in order to help with your property search.
The average Property Paid Price for specific property types in the last three years are:
| Property Type | Average Sold Price | Sold Properties |
|---|---|---|
| Semi Detached House | £2,115,000.00 | 2 Semi Detached Houses |
| Terraced House | £710,625.00 | 4 Terraced Houses |
| Detached House | £1,793,437.00 | 8 Detached Houses |
