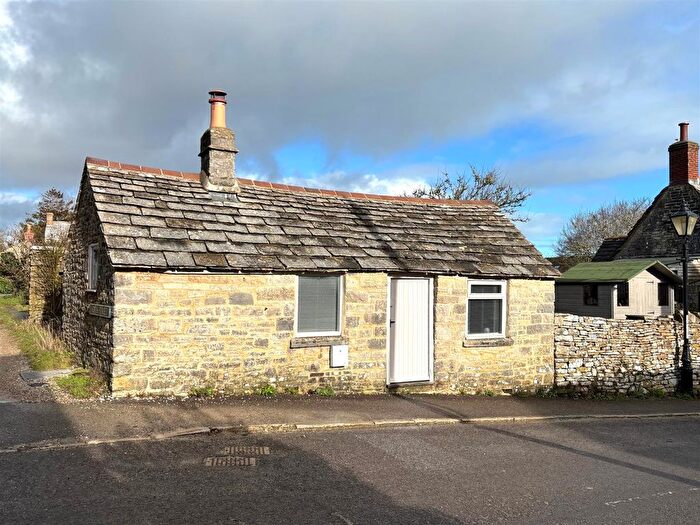
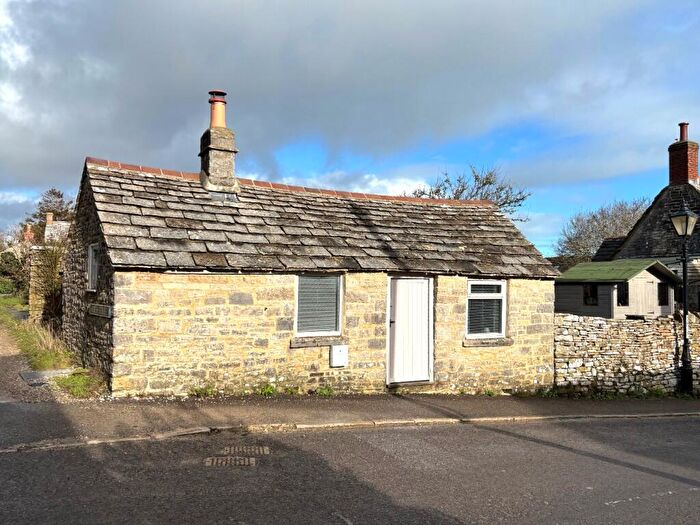
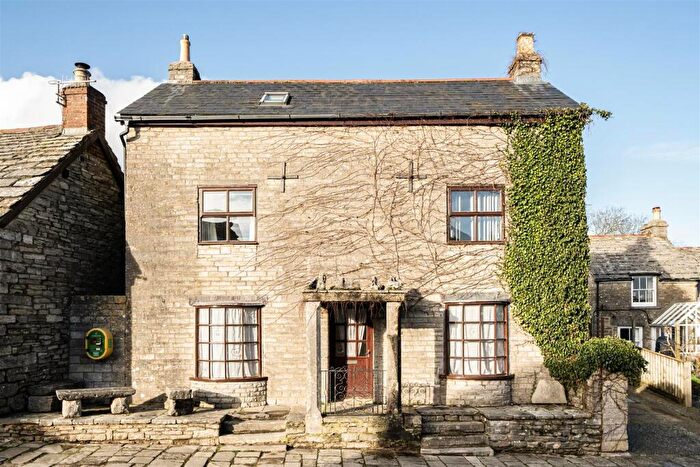
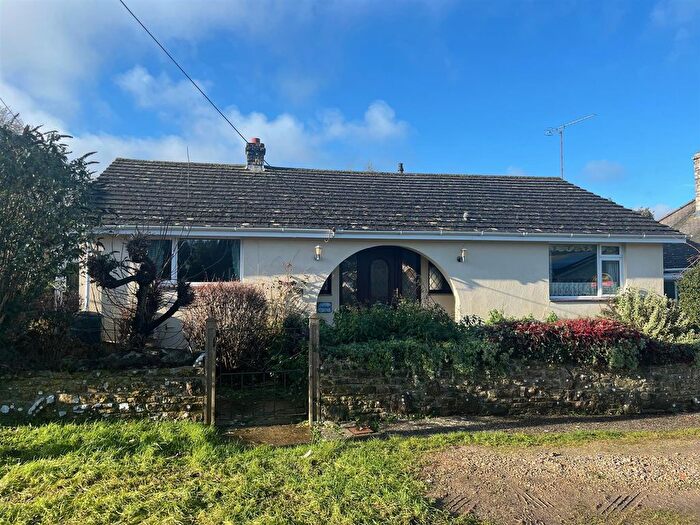
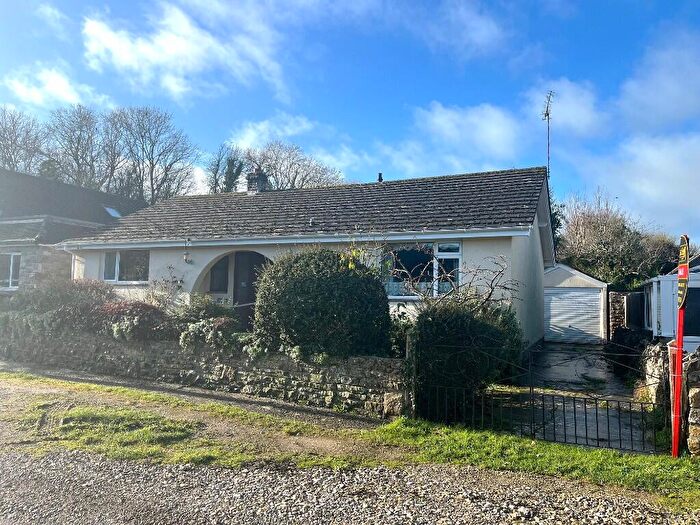
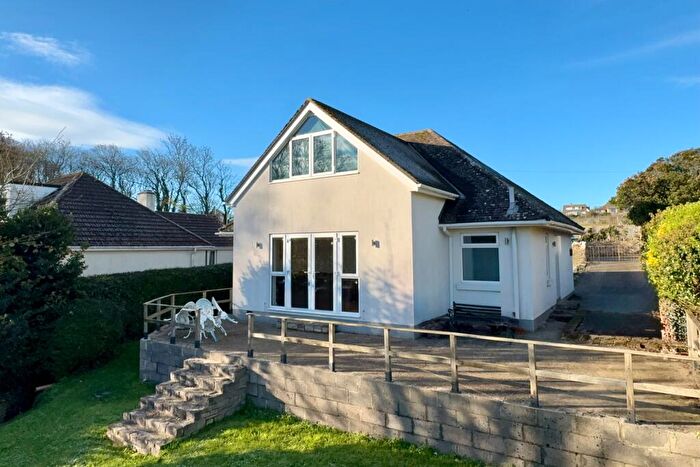
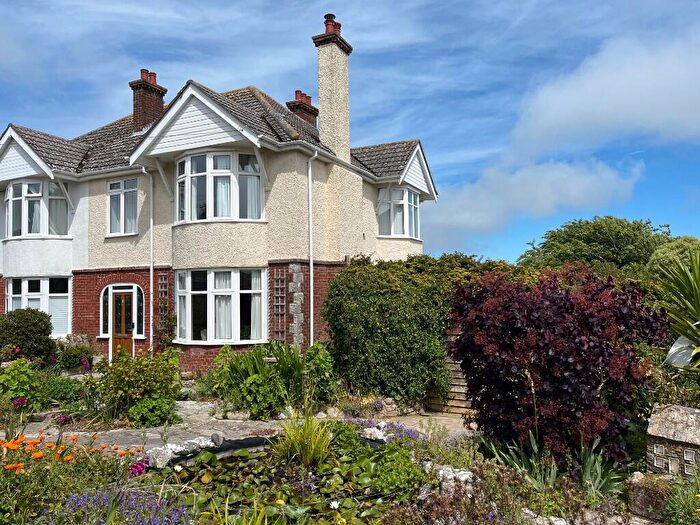
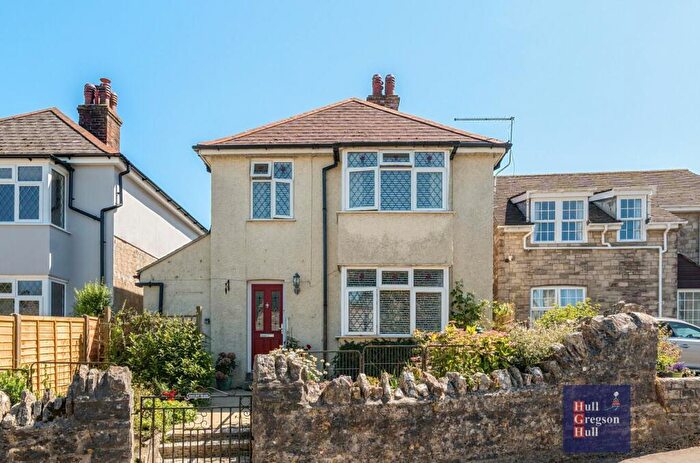
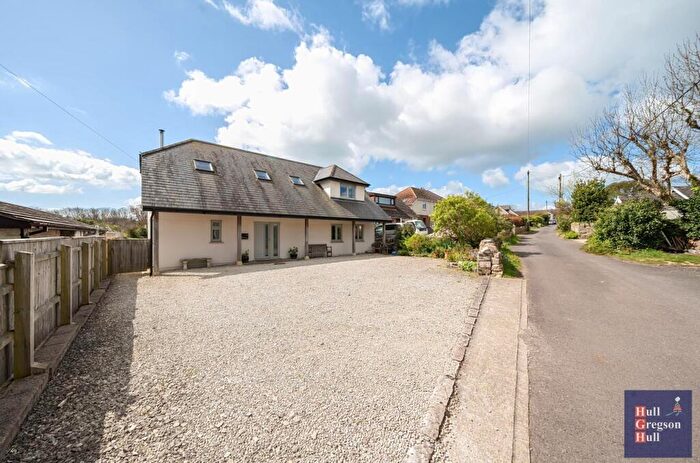
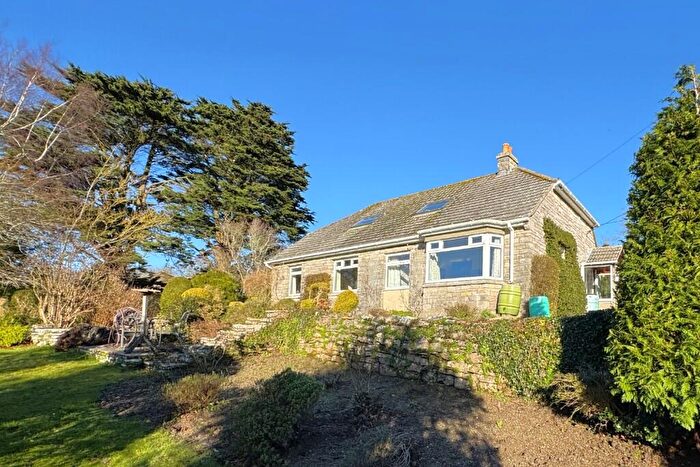
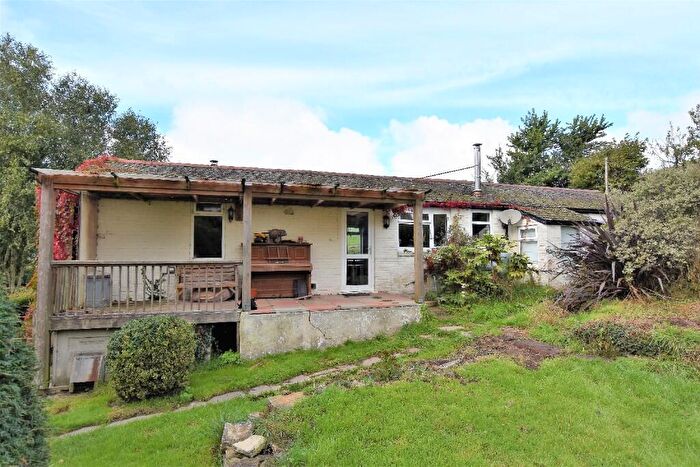
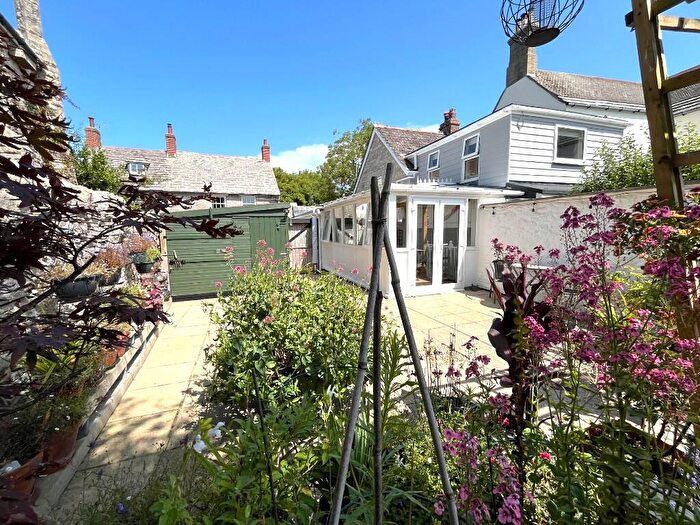
Houses for sale & to rent in Langton, Swanage
House Prices in Langton
Properties in Langton have an average house price of £701,311.00 and had 45 Property Transactions within the last 3 years¹.
Langton is an area in Swanage, Dorset with 582 households², where the most expensive property was sold for £2,680,000.00.
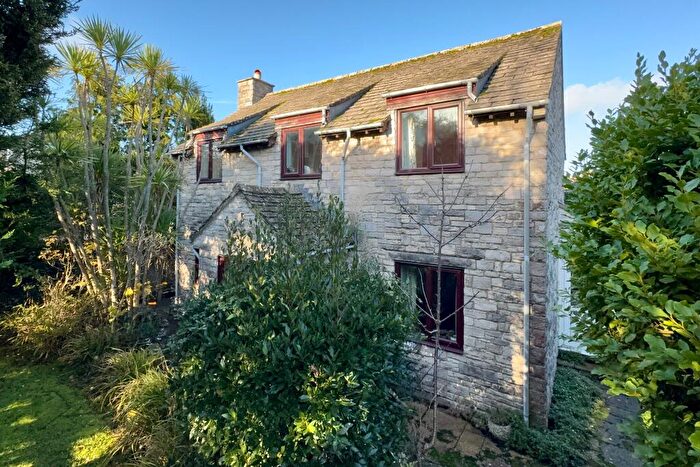
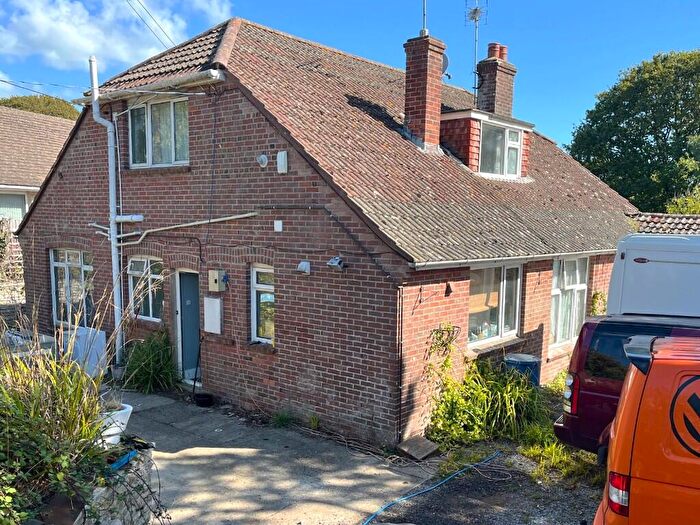
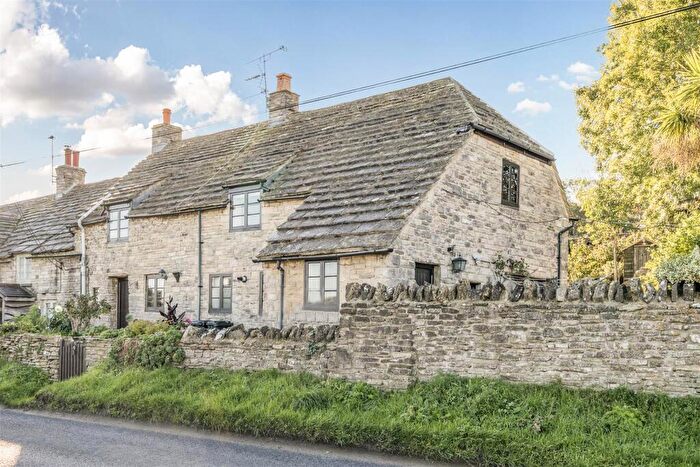
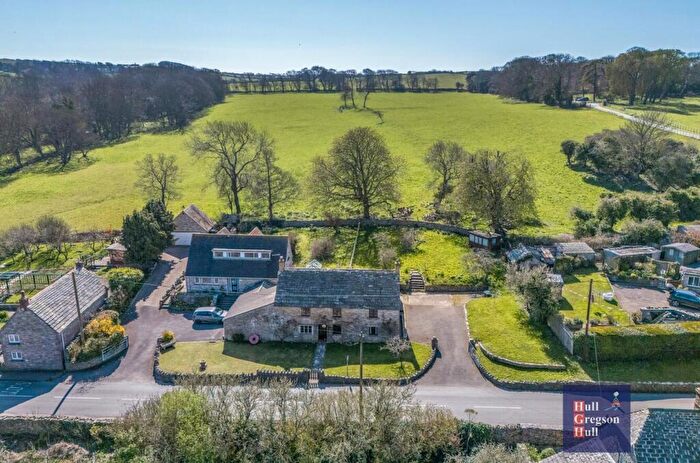
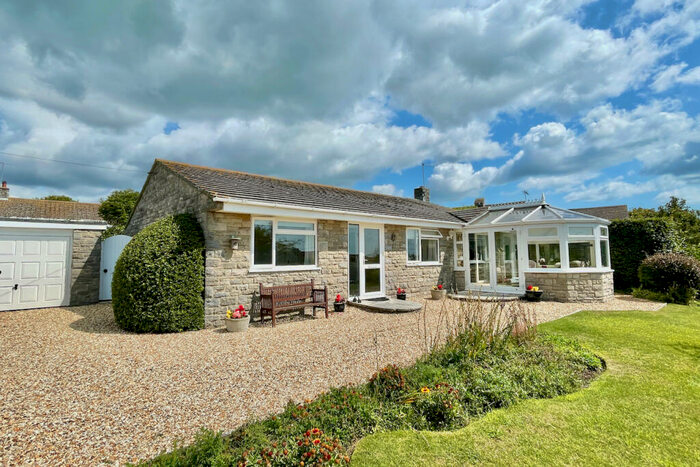
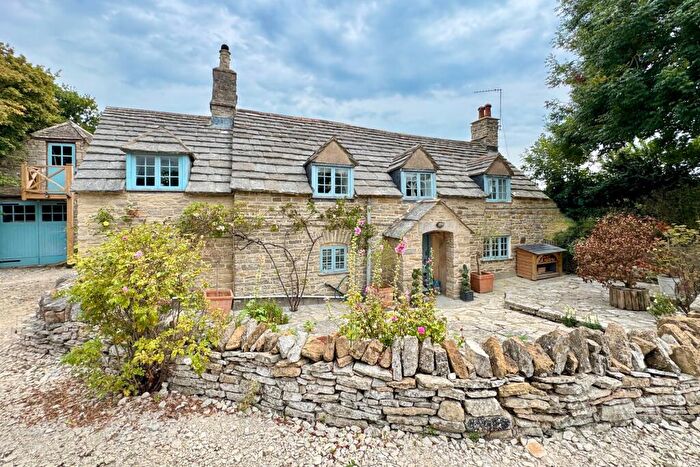
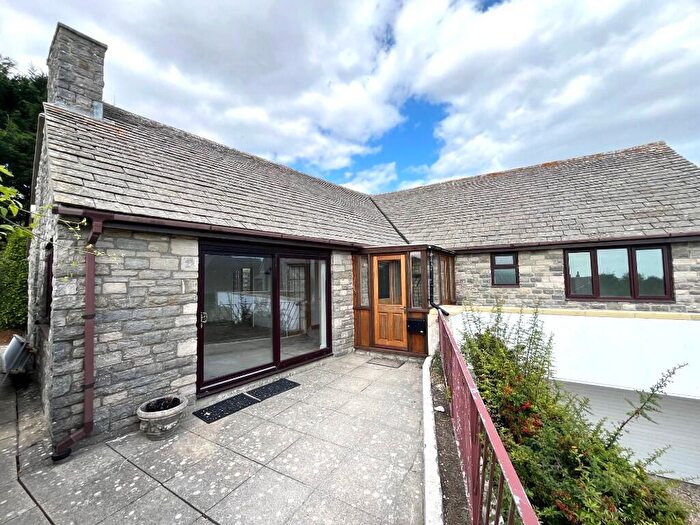
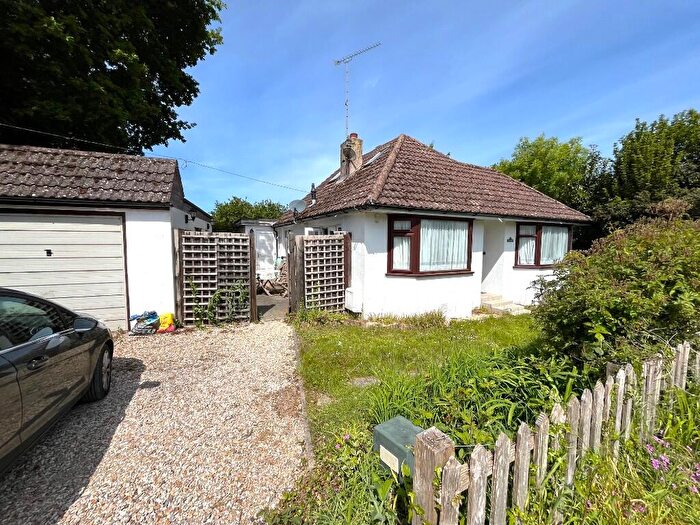
Properties for sale in Langton
Roads and Postcodes in Langton
Navigate through our locations to find the location of your next house in Langton, Swanage for sale or to rent.
| Streets | Postcodes |
|---|---|
| Abbascombe | BH19 3LG |
| Acton | BH19 3JS BH19 3LA |
| Alma Cottages | BH19 3LB |
| Arundel Terrace | BH19 3HW |
| Blacklands | BH19 3LD |
| Bonvils Road | BH19 3LR |
| Bower Close | BH19 3BD |
| Capston Field | BH19 3HP |
| Castle View | BH19 3HT |
| Coastguard Cottages | BH19 3LS |
| Coombe | BH19 3DL BH19 3DP BH19 3DW |
| Durnford Drove | BH19 3HG |
| East Acton Field | BH19 3HR |
| East Drove | BH19 3HF |
| Flower Meadow Lane | BH19 3BG |
| Garfield Lane | BH19 3HJ |
| Gully | BH19 3DN |
| Gypshayes | BH19 3HQ |
| Haycrafts Lane | BH19 3EB BH19 3EE |
| High Street | BH19 3HA BH19 3HB BH19 3HD |
| Jubilee Cottages | BH19 3JY |
| Kingston Road | BH19 3JN BH19 3JP BH19 3JR BH19 3JW |
| London Row | BH19 3LH |
| Lower Steppes | BH19 3EZ |
| Mount Pleasant | BH19 3HH |
| Newfoundland Close | BH19 3LX |
| North Instow | BH19 3DT |
| North Street | BH19 3HL |
| Old Malthouse Lane | BH19 3JA |
| Renscombe Road Bungalows | BH19 3LL |
| Serrells Barn Cottages | BH19 3HX |
| Serrells Mead | BH19 3JB |
| South Instow | BH19 3DS |
| St Albans Head Cottages | BH19 3LN |
| St Georges Close | BH19 3HZ |
| Steppes | BH19 3EY |
| Steppes Hill | BH19 3ET |
| The Hyde | BH19 3HE |
| The Lane | BH19 3JX |
| Three Acre Lane | BH19 3DR |
| Toms Field Road | BH19 3HN |
| Valley Road | BH19 3DX BH19 3DZ |
| West Acton Field | BH19 3HS |
| Winspit Road | BH19 3LW |
| BH19 3EU BH19 3EX BH19 3HU BH19 3LE BH19 3LF BH19 3LJ BH19 3LQ BH19 3LY |
Transport near Langton
-
Wareham Station
-
Holton Heath Station
-
Poole Station
-
Hamworthy Station
-
Parkstone Station
-
Branksome Station
- FAQ
- Price Paid By Year
- Property Type Price
Frequently asked questions about Langton
What is the average price for a property for sale in Langton?
The average price for a property for sale in Langton is £701,311. This amount is 48% higher than the average price in Swanage. There are 216 property listings for sale in Langton.
What streets have the most expensive properties for sale in Langton?
The streets with the most expensive properties for sale in Langton are Valley Road at an average of £1,531,666, Winspit Road at an average of £976,250 and Haycrafts Lane at an average of £787,000.
What streets have the most affordable properties for sale in Langton?
The streets with the most affordable properties for sale in Langton are Lower Steppes at an average of £255,000, Steppes at an average of £325,000 and Arundel Terrace at an average of £370,000.
Which train stations are available in or near Langton?
Some of the train stations available in or near Langton are Wareham, Holton Heath and Poole.
Property Price Paid in Langton by Year
The average sold property price by year was:
| Year | Average Sold Price | Price Change |
Sold Properties
|
|---|---|---|---|
| 2025 | £428,800 | -50% |
10 Properties |
| 2024 | £643,055 | -44% |
18 Properties |
| 2023 | £923,294 | 31% |
17 Properties |
| 2022 | £636,031 | 14% |
24 Properties |
| 2021 | £548,282 | -8% |
24 Properties |
| 2020 | £593,113 | 4% |
22 Properties |
| 2019 | £570,852 | -10% |
17 Properties |
| 2018 | £625,948 | 27% |
29 Properties |
| 2017 | £458,991 | -1% |
22 Properties |
| 2016 | £461,979 | 14% |
24 Properties |
| 2015 | £397,557 | 9% |
26 Properties |
| 2014 | £361,270 | -15% |
27 Properties |
| 2013 | £416,400 | 3% |
15 Properties |
| 2012 | £402,985 | -5% |
22 Properties |
| 2011 | £421,559 | 13% |
33 Properties |
| 2010 | £366,323 | -15% |
23 Properties |
| 2009 | £419,950 | 2% |
20 Properties |
| 2008 | £410,281 | 9% |
16 Properties |
| 2007 | £375,356 | -9% |
24 Properties |
| 2006 | £408,162 | 17% |
38 Properties |
| 2005 | £337,470 | 8% |
26 Properties |
| 2004 | £310,959 | 17% |
27 Properties |
| 2003 | £257,202 | 4% |
22 Properties |
| 2002 | £247,282 | 16% |
23 Properties |
| 2001 | £207,792 | -4% |
35 Properties |
| 2000 | £215,912 | 31% |
30 Properties |
| 1999 | £148,970 | -7% |
46 Properties |
| 1998 | £159,190 | 21% |
31 Properties |
| 1997 | £125,837 | 22% |
41 Properties |
| 1996 | £98,556 | 4% |
28 Properties |
| 1995 | £94,796 | - |
32 Properties |
Property Price per Property Type in Langton
Here you can find historic sold price data in order to help with your property search.
The average Property Paid Price for specific property types in the last three years are:
| Property Type | Average Sold Price | Sold Properties |
|---|---|---|
| Semi Detached House | £475,000.00 | 7 Semi Detached Houses |
| Detached House | £870,928.00 | 28 Detached Houses |
| Terraced House | £384,800.00 | 10 Terraced Houses |

