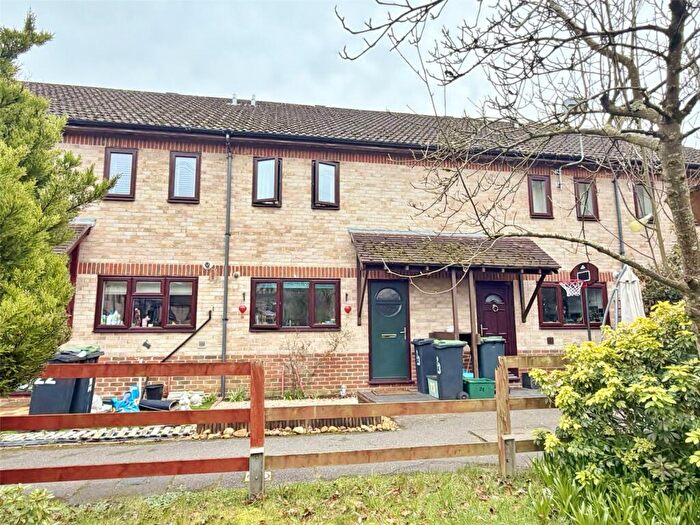
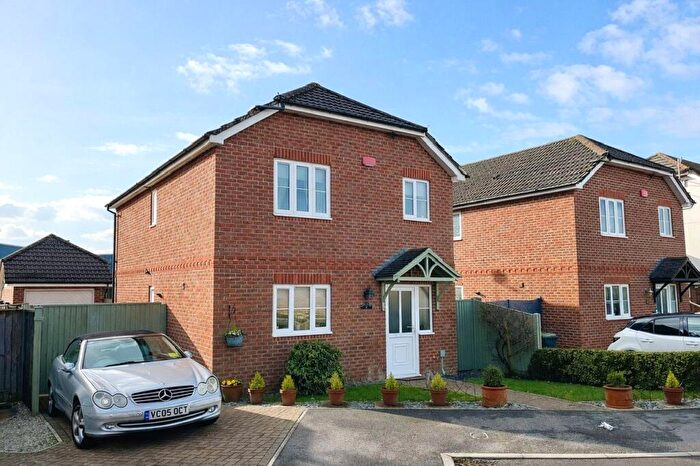
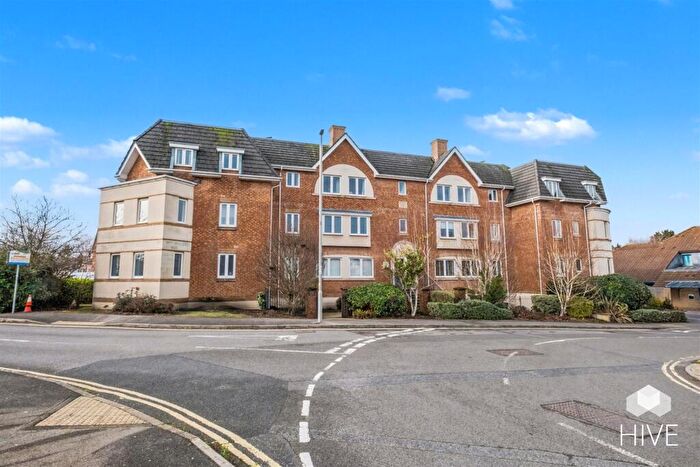
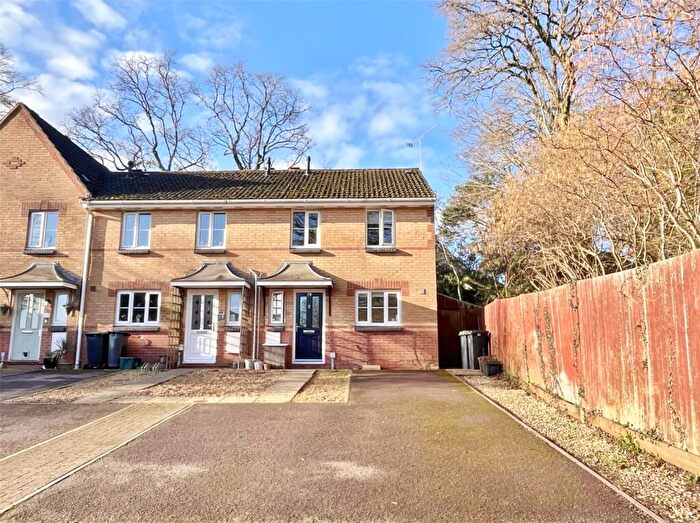
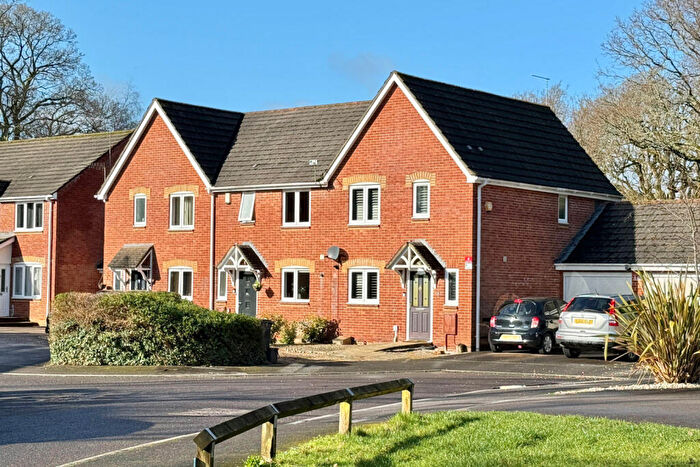
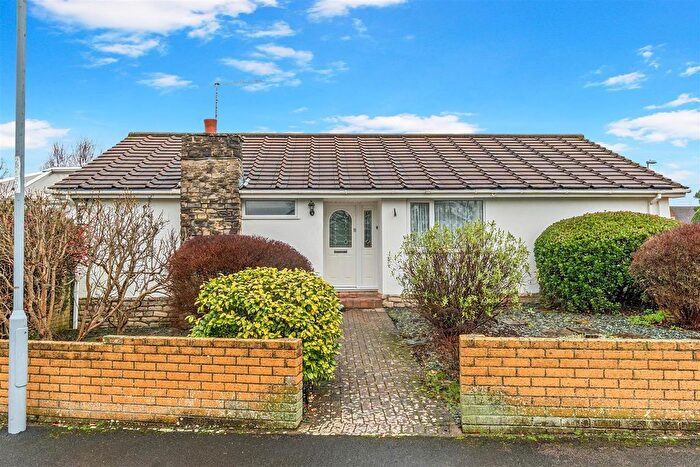
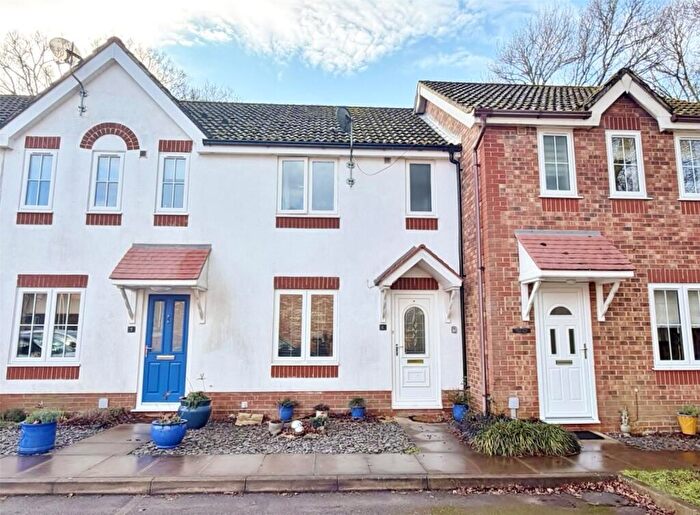
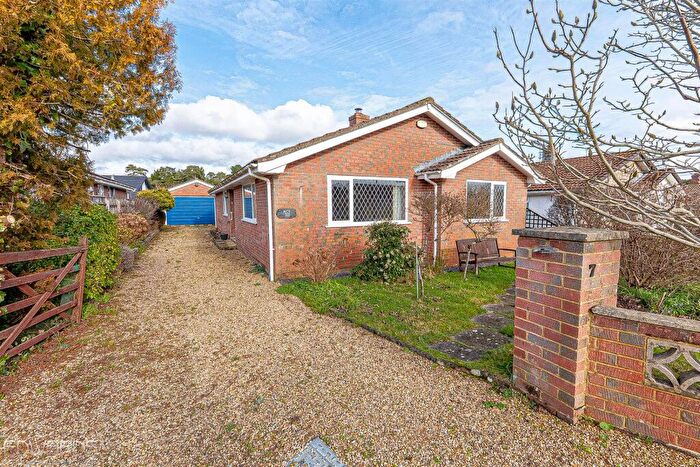
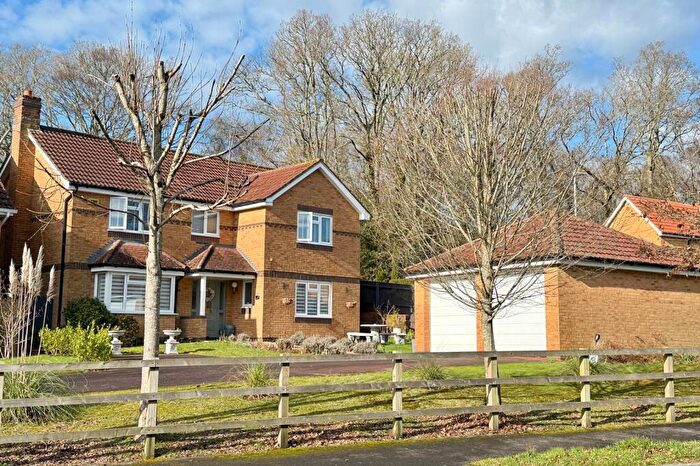
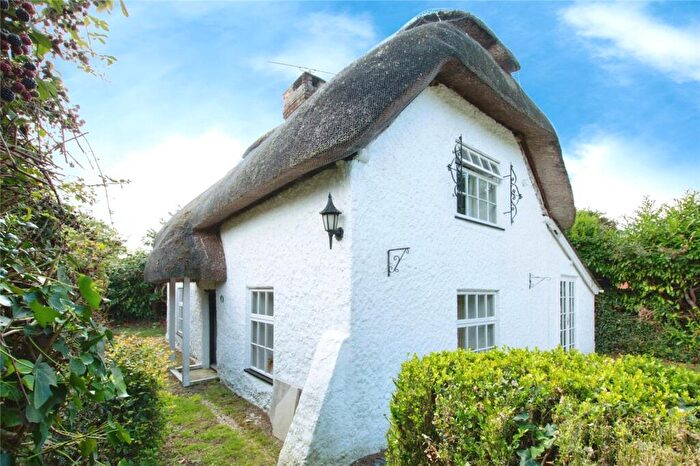
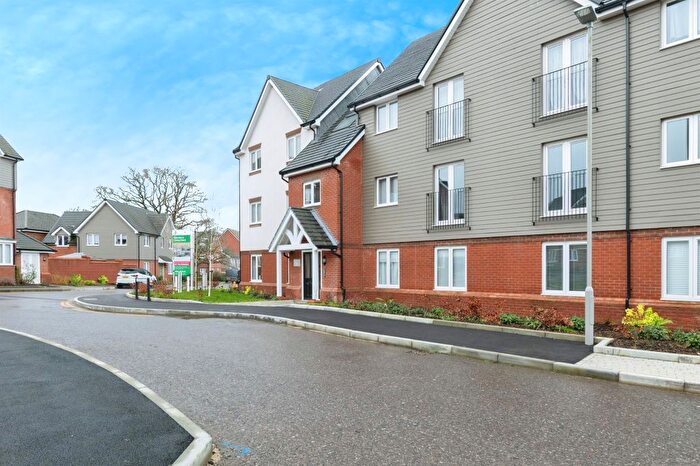
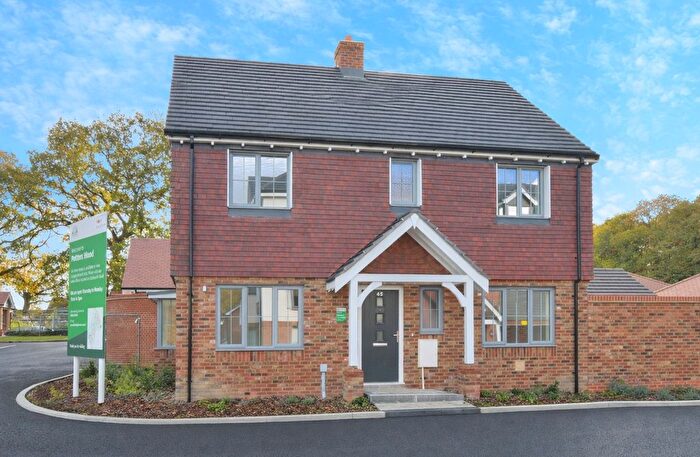
Houses for sale & to rent in Verwood, Dorset
House Prices in Verwood
Properties in Verwood have an average house price of £419,127.00 and had 586 Property Transactions within the last 3 years.¹
Verwood is an area in Dorset with 5,479 households², where the most expensive property was sold for £1,275,000.00.
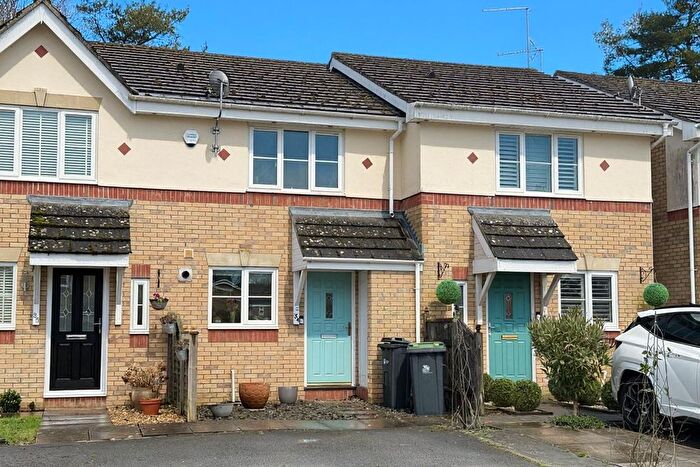
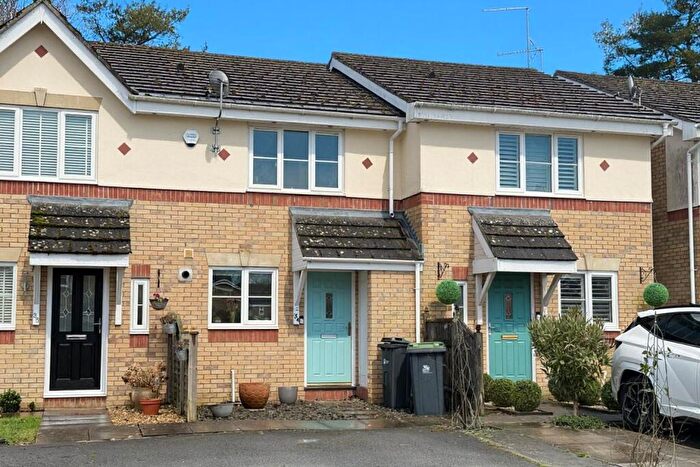
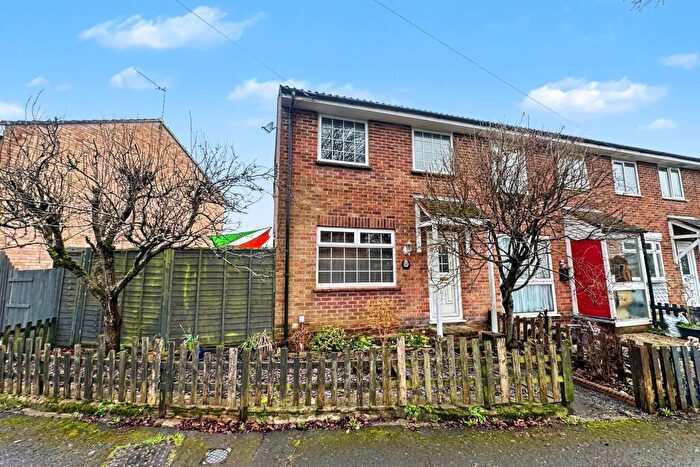
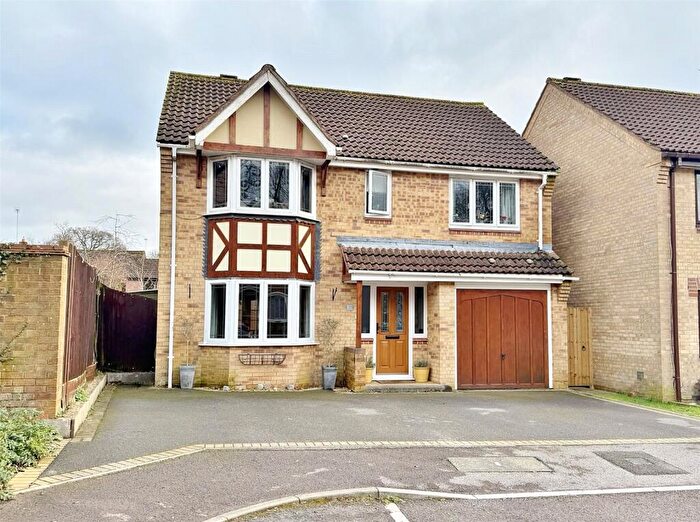
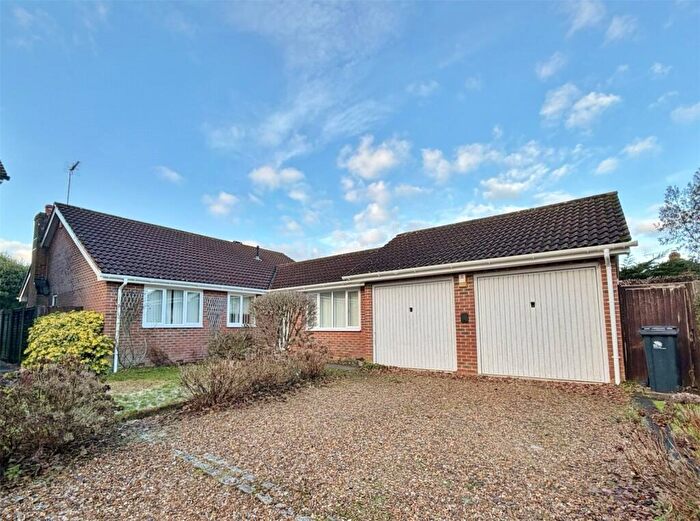
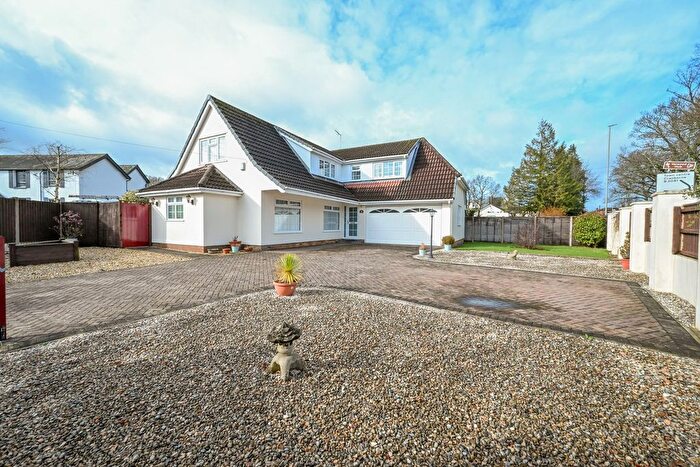
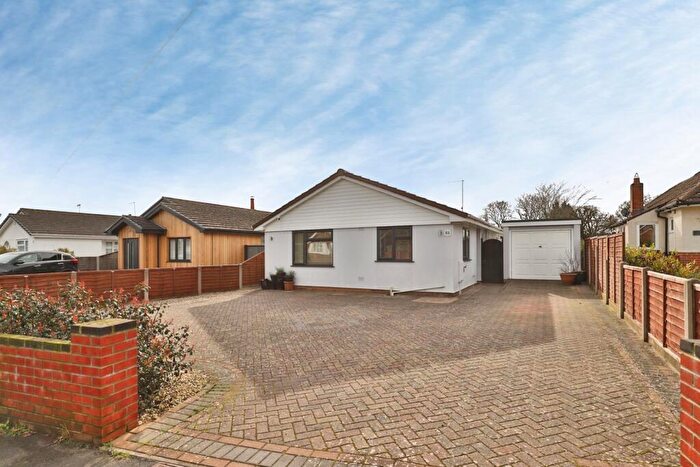
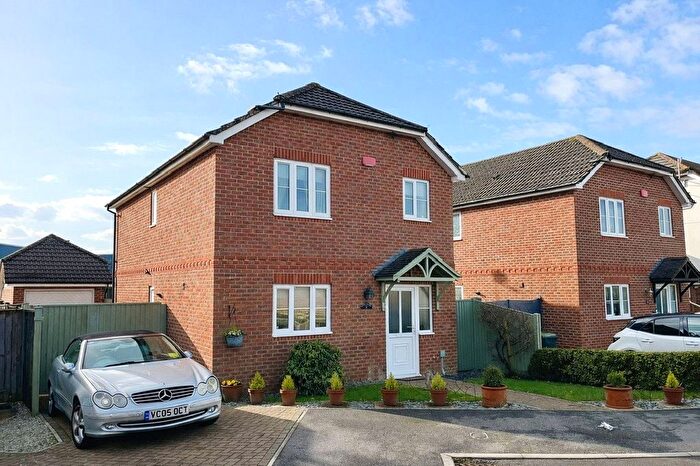
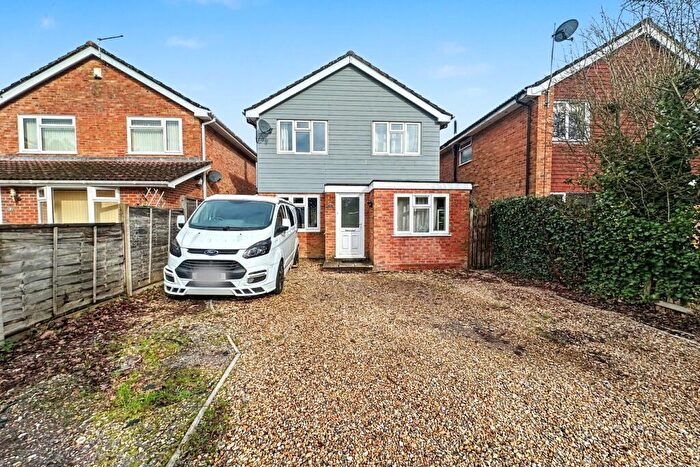
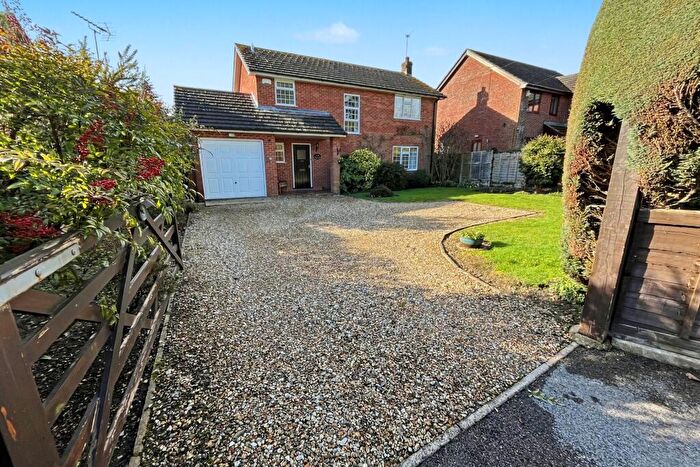
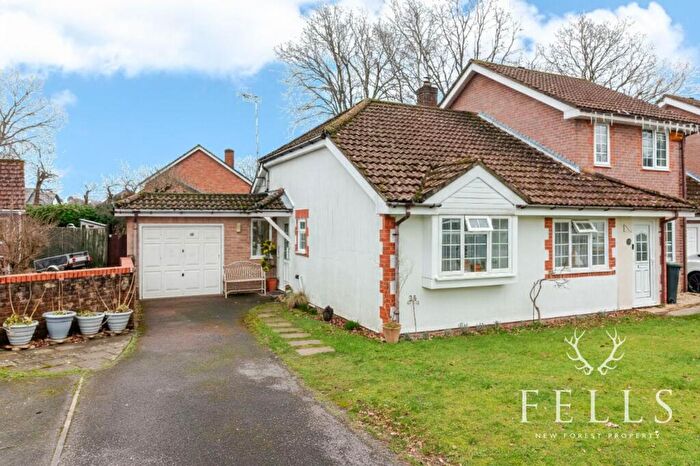
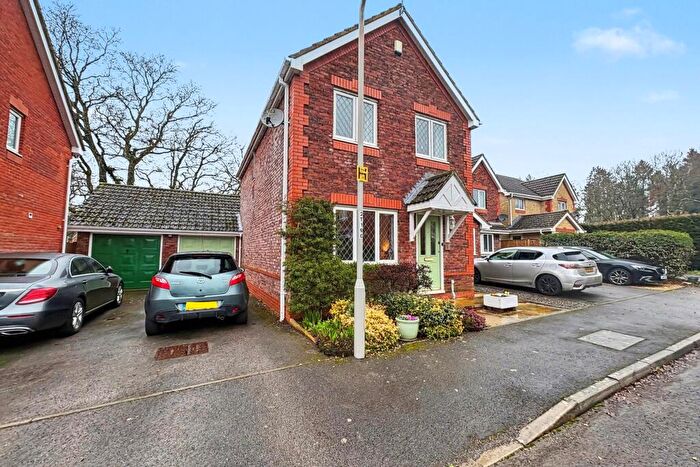
Properties for sale in Verwood
Neighbourhoods in Verwood
Navigate through our locations to find the location of your next house in Verwood, Dorset for sale or to rent.
Transport in Verwood
Please see below transportation links in this area:
-
Pokesdown Station
-
Christchurch Station
-
Bournemouth Station
-
Branksome Station
-
Hinton Admiral Station
-
Parkstone Station
-
Poole Station
-
Hamworthy Station
-
New Milton Station
-
Sway Station
- FAQ
- Price Paid By Year
- Property Type Price
Frequently asked questions about Verwood
What is the average price for a property for sale in Verwood?
The average price for a property for sale in Verwood is £419,127. This amount is 6% higher than the average price in Dorset. There are 1,368 property listings for sale in Verwood.
What locations have the most expensive properties for sale in Verwood?
The locations with the most expensive properties for sale in Verwood are Verwood Dewlands at an average of £463,963, Verwood Stephens Castle at an average of £439,376 and Verwood at an average of £376,800.
What locations have the most affordable properties for sale in Verwood?
The locations with the most affordable properties for sale in Verwood are Three Cross And Potterne at an average of £338,512 and Verwood Newtown at an average of £348,734.
Which train stations are available in or near Verwood?
Some of the train stations available in or near Verwood are Pokesdown, Christchurch and Bournemouth.
Property Price Paid in Verwood by Year
The average sold property price by year was:
| Year | Average Sold Price | Price Change |
Sold Properties
|
|---|---|---|---|
| 2025 | £412,056 | -3% |
187 Properties |
| 2024 | £425,291 | 1% |
204 Properties |
| 2023 | £419,458 | -2% |
195 Properties |
| 2022 | £427,615 | 6% |
229 Properties |
| 2021 | £400,741 | 10% |
323 Properties |
| 2020 | £360,873 | 3% |
253 Properties |
| 2019 | £350,384 | -1% |
278 Properties |
| 2018 | £352,667 | 4% |
262 Properties |
| 2017 | £338,692 | 4% |
298 Properties |
| 2016 | £326,098 | 8% |
305 Properties |
| 2015 | £300,353 | 5% |
320 Properties |
| 2014 | £285,645 | 9% |
324 Properties |
| 2013 | £258,846 | -4% |
309 Properties |
| 2012 | £269,608 | 7% |
265 Properties |
| 2011 | £250,057 | -7% |
256 Properties |
| 2010 | £266,861 | 8% |
233 Properties |
| 2009 | £245,044 | -6% |
256 Properties |
| 2008 | £260,027 | 0,4% |
162 Properties |
| 2007 | £258,932 | 3% |
443 Properties |
| 2006 | £250,420 | 8% |
456 Properties |
| 2005 | £230,433 | 2% |
334 Properties |
| 2004 | £225,643 | 3% |
468 Properties |
| 2003 | £218,186 | 17% |
410 Properties |
| 2002 | £181,133 | 10% |
576 Properties |
| 2001 | £162,333 | 5% |
533 Properties |
| 2000 | £153,414 | 18% |
508 Properties |
| 1999 | £125,707 | 14% |
564 Properties |
| 1998 | £107,701 | 12% |
484 Properties |
| 1997 | £94,390 | 7% |
549 Properties |
| 1996 | £87,458 | 10% |
416 Properties |
| 1995 | £78,871 | - |
286 Properties |
Property Price per Property Type in Verwood
Here you can find historic sold price data in order to help with your property search.
The average Property Paid Price for specific property types in the last three years are:
| Property Type | Average Sold Price | Sold Properties |
|---|---|---|
| Flat | £204,918.00 | 41 Flats |
| Semi Detached House | £332,242.00 | 76 Semi Detached Houses |
| Detached House | £497,730.00 | 369 Detached Houses |
| Terraced House | £282,937.00 | 100 Terraced Houses |

