
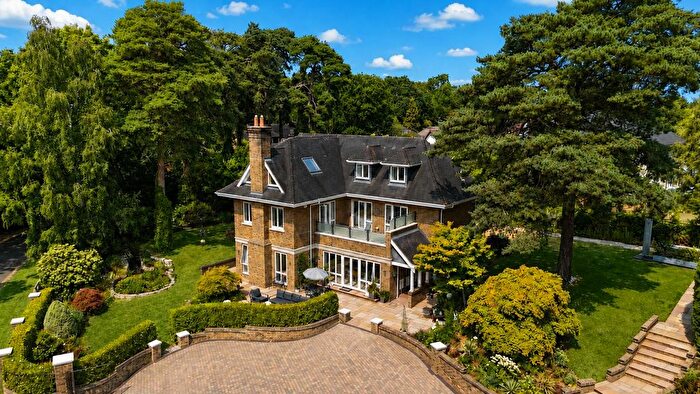
Houses for sale in Wimborne, Dorset
House Prices in Wimborne
Properties in Wimborne have an average house price of £448k and had 1,410 Property Transactions within the last 3 years.¹
Wimborne is an area in Dorset with 15,544 households², where the most expensive property was sold for £2.55M.
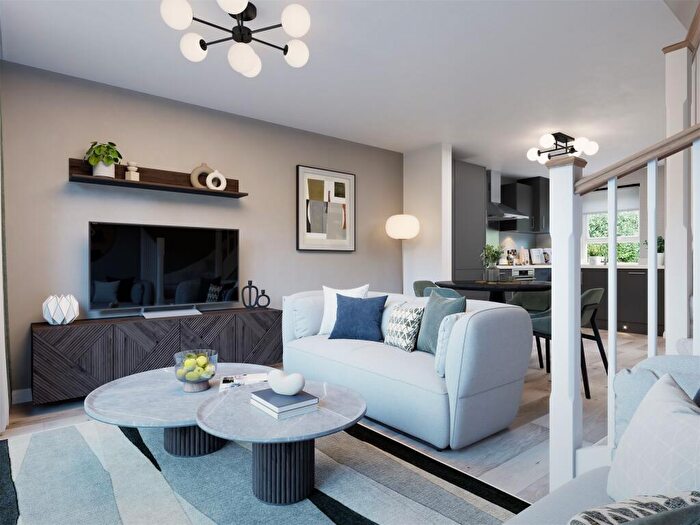
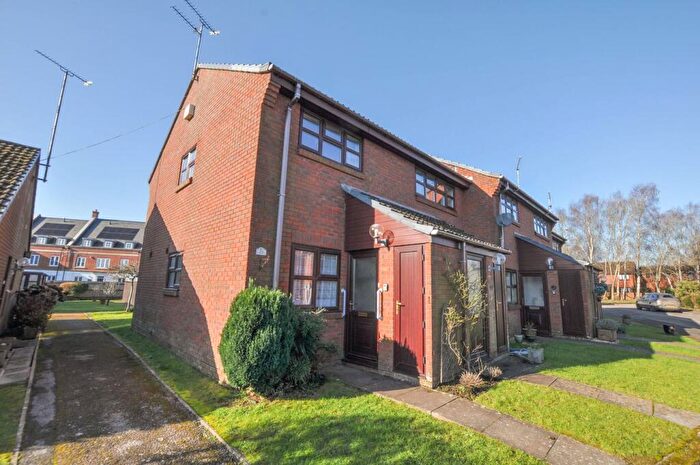
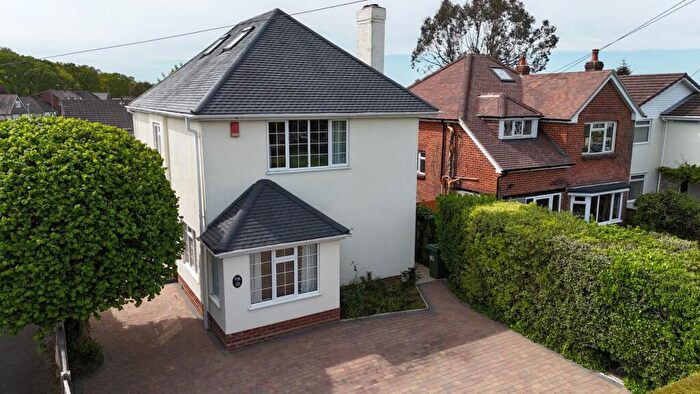
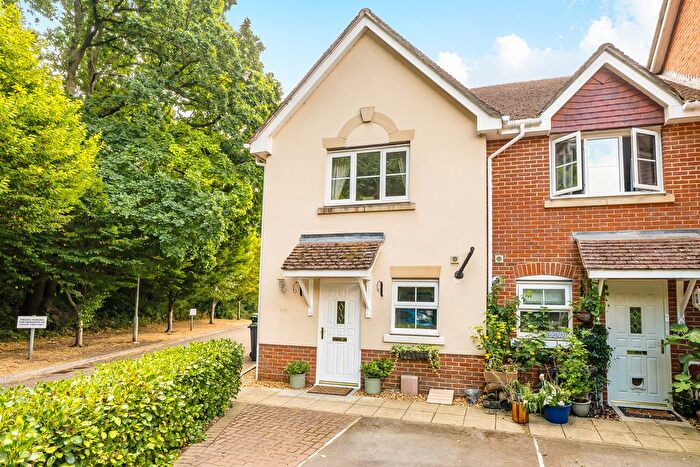
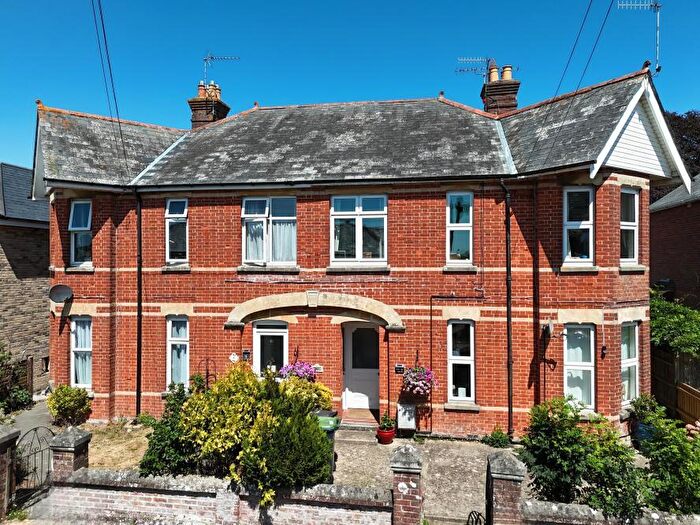
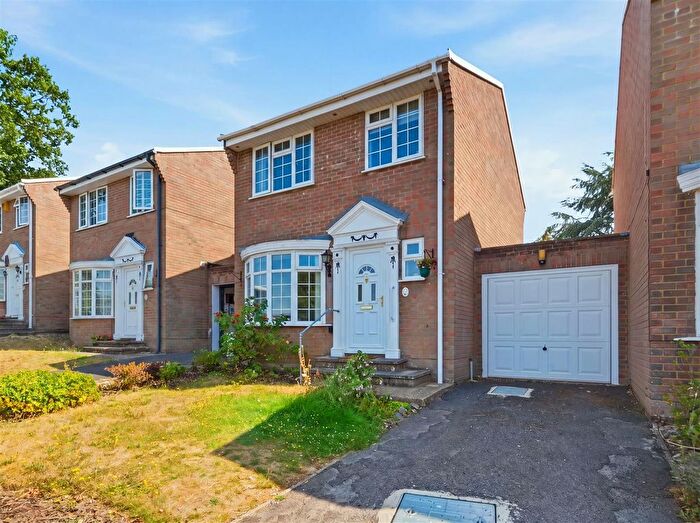
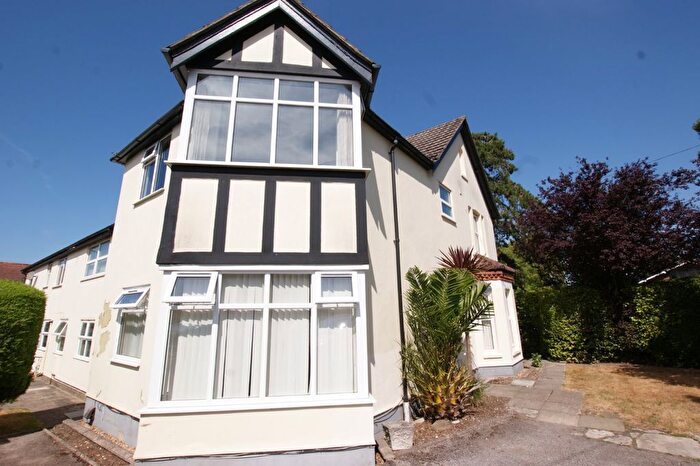
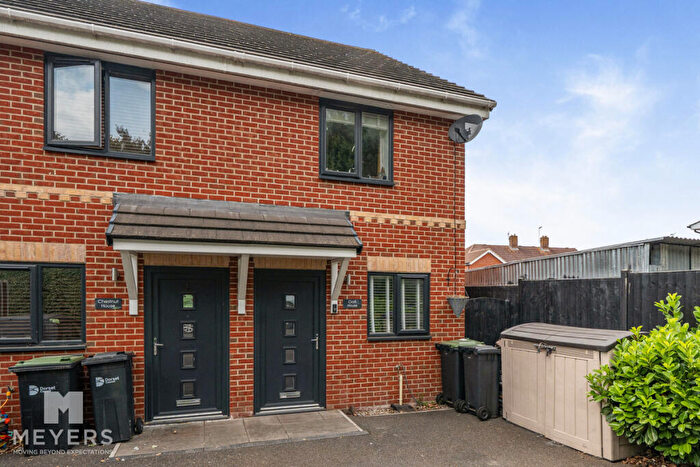
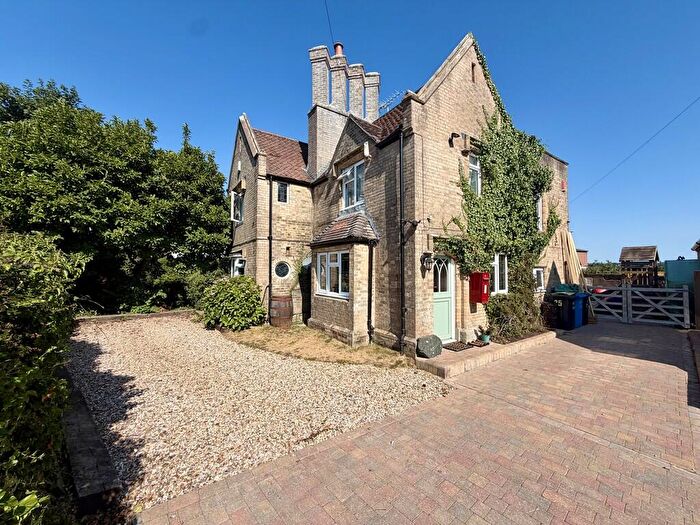
Properties for sale in Wimborne
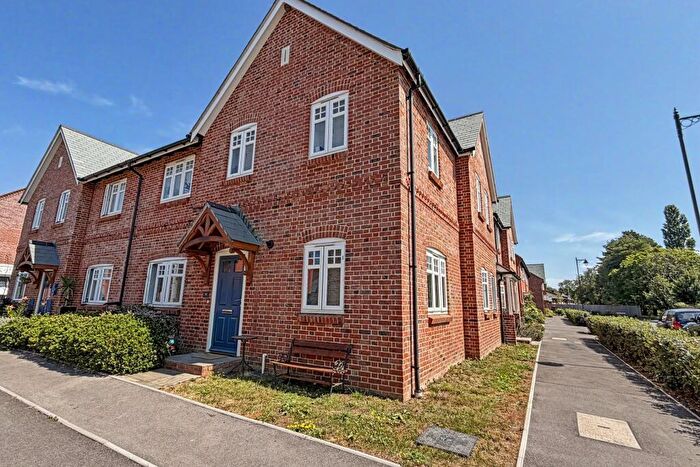
![]()
If you are looking to sell your house, let it out, or receive a property valuation, an expert can help you.
Click the button below to get started.


Neighbourhoods in Wimborne
Navigate through our locations to find the location of your next house in Wimborne, Dorset for sale or to rent.
- Stapehill
- Colehill East
- Colehill West
- Corfe Mullen Central
- Corfe Mullen North
- Corfe Mullen South
- Crane
- Handley Vale
- Holt
- Longham
- Lytchett Matravers
- Lytchett Minster And Upton East
- Stour
- Three Cross And Potterne
- Verwood Dewlands
- West Moors
- Wimborne Minster
- Bearwood & Merley
- Colehill & Wimborne Minster East
- Ferndown North
- Corfe Mullen
- Stour & Allen Vale
- Cranborne & Alderholt
- West Moors & Three Legged Cross
- Ferndown South
- Lytchett Matravers & Upton
- Cranborne Chase
Property price trends in Wimborne
According to the latest Land Registry data, the average home in Wimborne sold for £431,595 in 2026. That figure comes from a substantial record of 19,160 sales logged over the past 31 years.
Prices have fallen back over the last three years. Compared with 2023, when the typical sale came in around £476,577, that's a fall of roughly 9.4%.
Looking back five years, average prices are down about 3.8% since 2021, a drop of around £16,913 in cash terms.
Zoom out to the past decade for the fuller picture. Back in 2016, homes here averaged £358,852, so the typical sold price has climbed about 20.3% since then, roughly 1.9% a year. Stretch the view to fifteen years and that annual pace edges up closer to 2.7%.
Frequently asked questions about Wimborne
What is the average price for a property for sale in Wimborne?
The average price for a property for sale in Wimborne is £447,591. This amount is 14% higher than the average price in Dorset. There are more than 10,000 property listings for sale in Wimborne.
What locations have the most expensive properties for sale in Wimborne?
The locations with the most expensive properties for sale in Wimborne are Ferndown North at an average of £896,361, Holt at an average of £744,910 and Colehill West at an average of £721,044.
What locations have the most affordable properties for sale in Wimborne?
The locations with the most affordable properties for sale in Wimborne are Wimborne Minster at an average of £350,396, Colehill & Wimborne Minster East at an average of £358,877 and Corfe Mullen Central at an average of £394,613.
Which train stations are available in or near Wimborne?
Some of the train stations available in or near Wimborne are Parkstone, Branksome and Hamworthy.
Property Price Paid in Wimborne by Year
The average sold property price by year was:
| Year | Average Sold Price | Price Change |
Sold Properties
|
|---|---|---|---|
| 2026 | £431,595 | 1% |
42 Properties |
| 2025 | £429,371 | -2% |
468 Properties |
| 2024 | £438,281 | -9% |
441 Properties |
| 2023 | £476,577 | -4% |
459 Properties |
| 2022 | £493,693 | 9% |
570 Properties |
| 2021 | £448,508 | 9% |
865 Properties |
| 2020 | £406,425 | 2% |
570 Properties |
| 2019 | £396,529 | 2% |
570 Properties |
| 2018 | £389,857 | -2% |
540 Properties |
| 2017 | £396,707 | 10% |
580 Properties |
Property Price per Property Type in Wimborne
Here you can find historic sold price data in order to help with your property search.
The average Property Paid Price for specific property types in the last three years are:
| Property Type | Average Sold Price | Sold Properties |
|---|---|---|
| Semi Detached House | £388,780.00 | 315 Semi Detached Houses |
| Terraced House | £332,437.00 | 261 Terraced Houses |
| Detached House | £590,395.00 | 644 Detached Houses |
| Flat | £219,247.00 | 190 Flats |
Transport in Wimborne
Please see below transportation links in this area:
