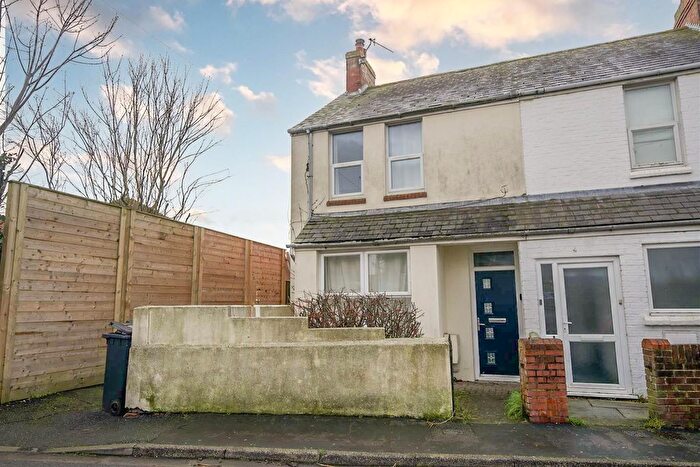
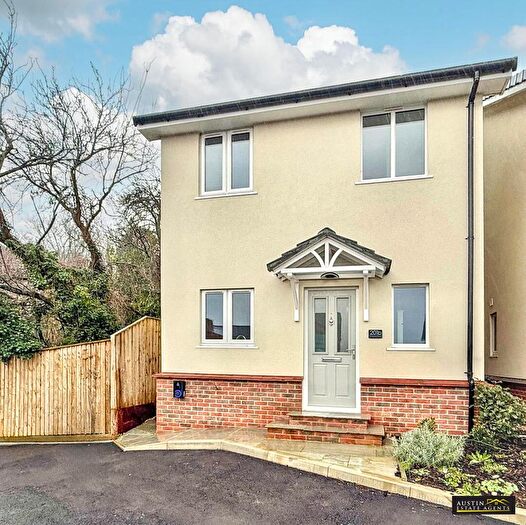
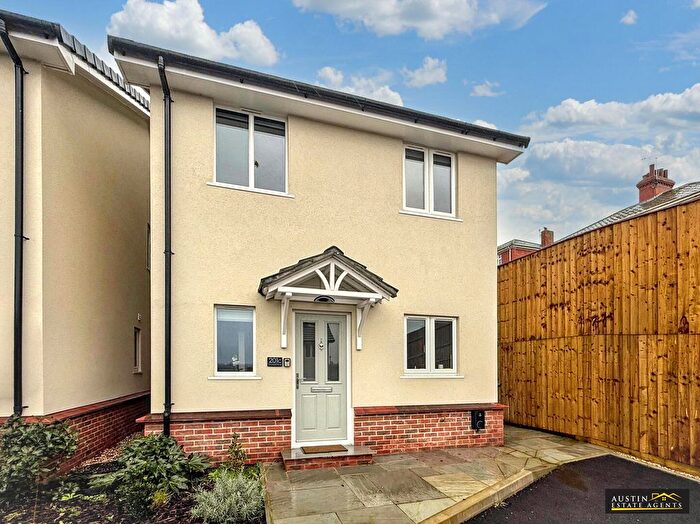
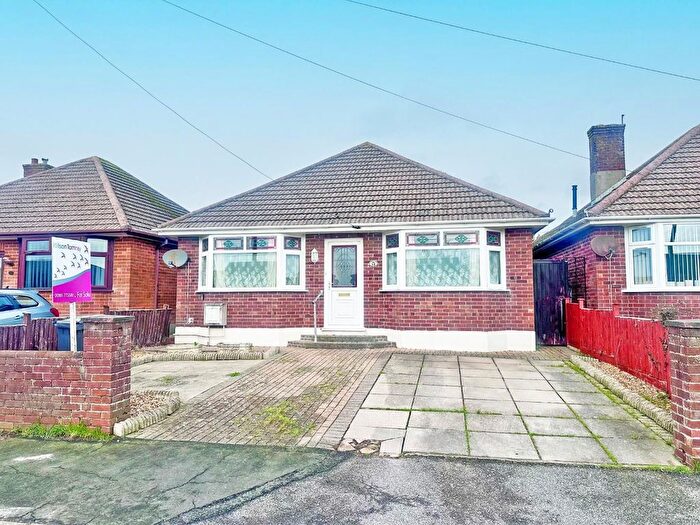
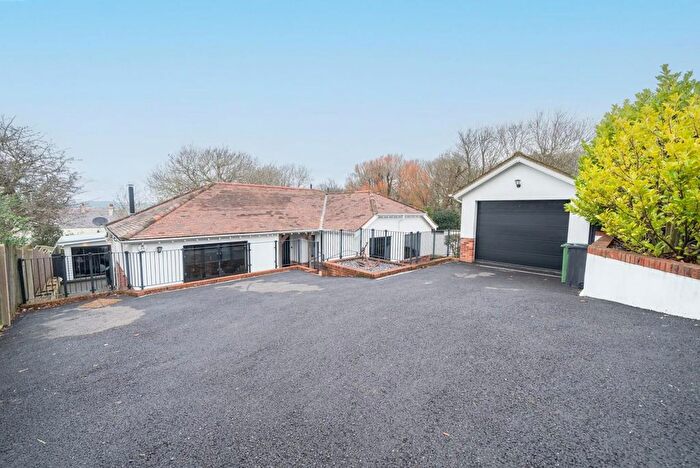
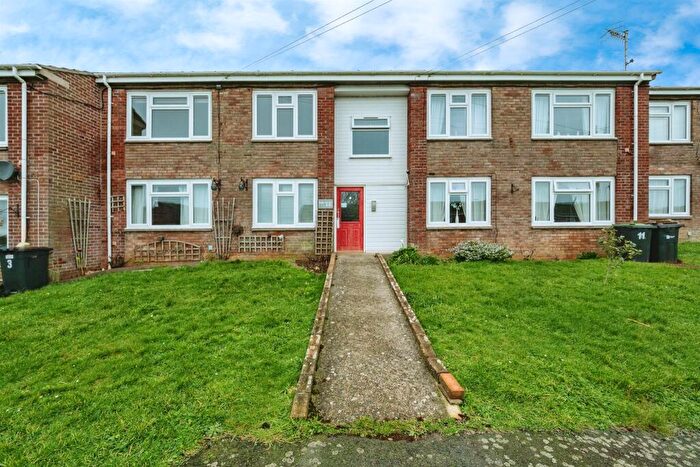
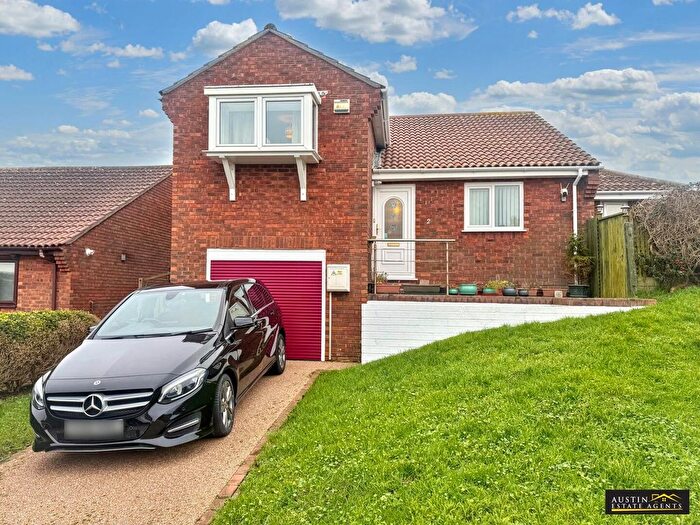
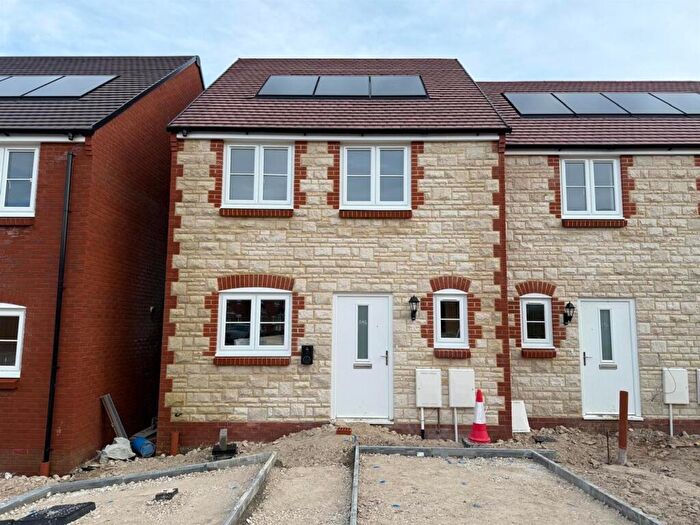
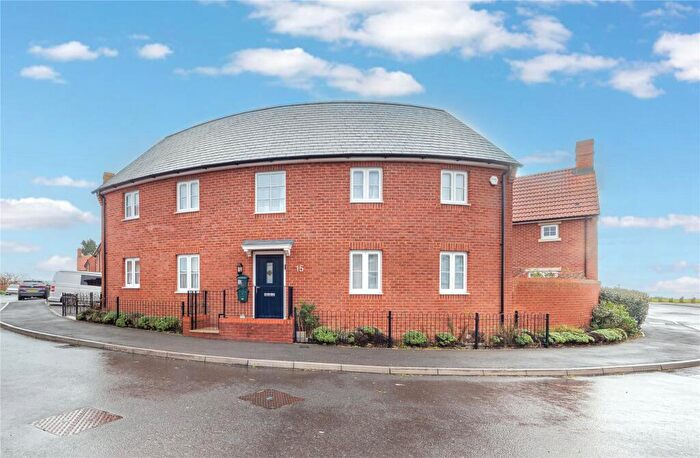
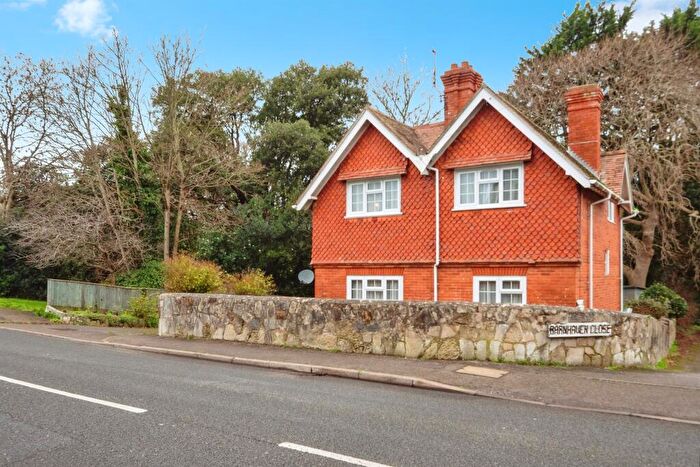
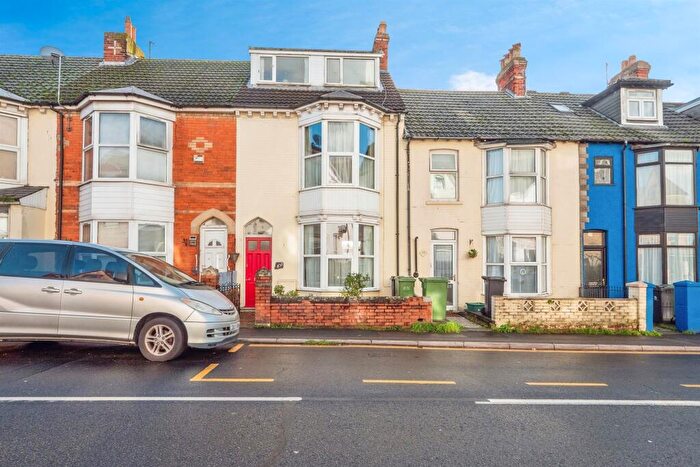
Houses for sale & to rent in Westham West, Weymouth
House Prices in Westham West
Properties in Westham West have an average house price of £294,354.00 and had 186 Property Transactions within the last 3 years¹.
Westham West is an area in Weymouth, Dorset with 1,445 households², where the most expensive property was sold for £678,000.00.
Properties for sale in Westham West
Roads and Postcodes in Westham West
Navigate through our locations to find the location of your next house in Westham West, Weymouth for sale or to rent.
| Streets | Postcodes |
|---|---|
| Abbotsbury Road | DT4 0LY DT4 0NB |
| Benville Road | DT4 0SG |
| Bryn Road | DT4 0NP |
| Chickerell Road | DT4 0QR DT4 0QT DT4 0QU DT4 0QW DT4 0QY DT4 0QZ DT4 0RA DT4 0RD DT4 0RE DT4 0RF |
| Cockles Lane | DT4 9LT |
| Cumberland Drive | DT4 9ST |
| Dennis Road | DT4 0NJ DT4 0NL DT4 0NN |
| East Wyld Road | DT4 0RP |
| Francis Road | DT4 0QN |
| Granby Close | DT4 0SP DT4 0SR DT4 0SS |
| Hardy Avenue | DT4 0RJ DT4 0RQ |
| Kitchener Road | DT4 0LN |
| Lanehouse Rocks Road | DT4 9DH DT4 9DJ DT4 9DQ DT4 9HX DT4 9HY |
| Leamington Road | DT4 0EY DT4 0EZ DT4 0HA |
| Leeds Crescent | DT4 0HG |
| Lichfield Road | DT4 0HE DT4 0HF |
| Lincoln Road | DT4 0HQ |
| Littleview Road | DT4 9DX |
| Liverpool Road | DT4 0HJ |
| Ludlow Road | DT4 0HB DT4 0HD |
| Lynch Lane | DT4 9DL |
| Lynch Road | DT4 0SJ |
| Malvern Terrace | DT4 0NR |
| Markham Avenue | DT4 0QL |
| Nutgrove Avenue | DT4 9ED |
| Overbury Close | DT4 9UE |
| Peartree Lane | DT4 0QS |
| Portland Crescent | DT4 0NW |
| Quibo Lane | DT4 0RR |
| Radipole Lane | DT4 0QE DT4 0QF DT4 0QG DT4 0SN |
| Roundham Gardens | DT4 0RL |
| Roundhayes Close | DT4 0RN |
| Shirecroft Road | DT4 0NH DT4 0NQ |
| St Helens Road | DT4 9DY |
| Stainforth Close | DT4 0SY |
| Tollerdown Road | DT4 0SQ |
| Vines Place | DT4 9DS |
| Warren Close | DT4 0SH |
| Westdowne Close | DT4 0RW |
| Westhaven | DT4 0SE DT4 0SF |
Transport near Westham West
-
Weymouth Station
-
Upwey Station
-
Dorchester South Station
-
Dorchester West Station
-
Moreton (Dorset) Station
- FAQ
- Price Paid By Year
- Property Type Price
Frequently asked questions about Westham West
What is the average price for a property for sale in Westham West?
The average price for a property for sale in Westham West is £294,354. This amount is 4% lower than the average price in Weymouth. There are 1,263 property listings for sale in Westham West.
What streets have the most expensive properties for sale in Westham West?
The streets with the most expensive properties for sale in Westham West are Roundham Gardens at an average of £467,500, Quibo Lane at an average of £445,333 and Cockles Lane at an average of £445,000.
What streets have the most affordable properties for sale in Westham West?
The streets with the most affordable properties for sale in Westham West are Liverpool Road at an average of £91,000, Peartree Lane at an average of £155,000 and Granby Close at an average of £194,833.
Which train stations are available in or near Westham West?
Some of the train stations available in or near Westham West are Weymouth, Upwey and Dorchester South.
Property Price Paid in Westham West by Year
The average sold property price by year was:
| Year | Average Sold Price | Price Change |
Sold Properties
|
|---|---|---|---|
| 2025 | £313,706 | 11% |
58 Properties |
| 2024 | £277,794 | -6% |
66 Properties |
| 2023 | £293,879 | 3% |
62 Properties |
| 2022 | £286,213 | 7% |
64 Properties |
| 2021 | £265,815 | 7% |
72 Properties |
| 2020 | £247,989 | 4% |
47 Properties |
| 2019 | £238,491 | 0,1% |
67 Properties |
| 2018 | £238,229 | 6% |
57 Properties |
| 2017 | £224,340 | 7% |
58 Properties |
| 2016 | £208,605 | - |
60 Properties |
| 2015 | £208,522 | 5% |
43 Properties |
| 2014 | £197,441 | 4% |
58 Properties |
| 2013 | £190,166 | 5% |
50 Properties |
| 2012 | £181,215 | -3% |
48 Properties |
| 2011 | £186,635 | -2% |
37 Properties |
| 2010 | £190,220 | 12% |
47 Properties |
| 2009 | £168,236 | -10% |
34 Properties |
| 2008 | £184,564 | -14% |
34 Properties |
| 2007 | £210,690 | 14% |
77 Properties |
| 2006 | £181,415 | -9% |
98 Properties |
| 2005 | £197,211 | 10% |
70 Properties |
| 2004 | £178,179 | 16% |
73 Properties |
| 2003 | £149,753 | 22% |
65 Properties |
| 2002 | £117,426 | 18% |
78 Properties |
| 2001 | £95,912 | 17% |
74 Properties |
| 2000 | £79,722 | 11% |
56 Properties |
| 1999 | £70,737 | 11% |
81 Properties |
| 1998 | £62,838 | 2% |
61 Properties |
| 1997 | £61,509 | 13% |
64 Properties |
| 1996 | £53,756 | 12% |
55 Properties |
| 1995 | £47,478 | - |
48 Properties |
Property Price per Property Type in Westham West
Here you can find historic sold price data in order to help with your property search.
The average Property Paid Price for specific property types in the last three years are:
| Property Type | Average Sold Price | Sold Properties |
|---|---|---|
| Semi Detached House | £294,306.00 | 84 Semi Detached Houses |
| Detached House | £381,555.00 | 45 Detached Houses |
| Terraced House | £257,613.00 | 39 Terraced Houses |
| Flat | £156,180.00 | 18 Flats |

