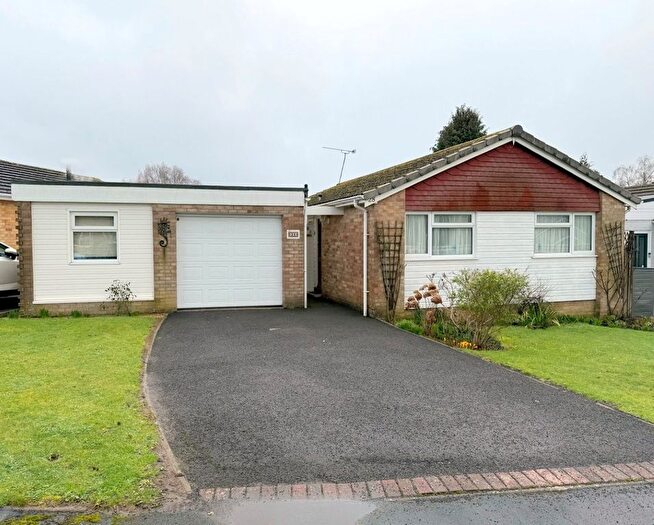
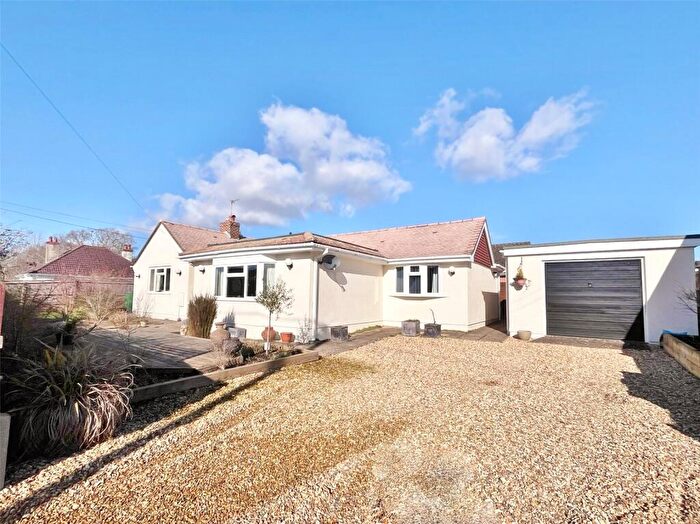
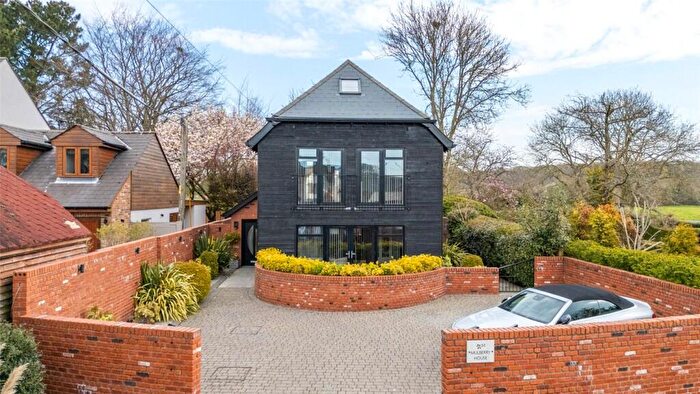
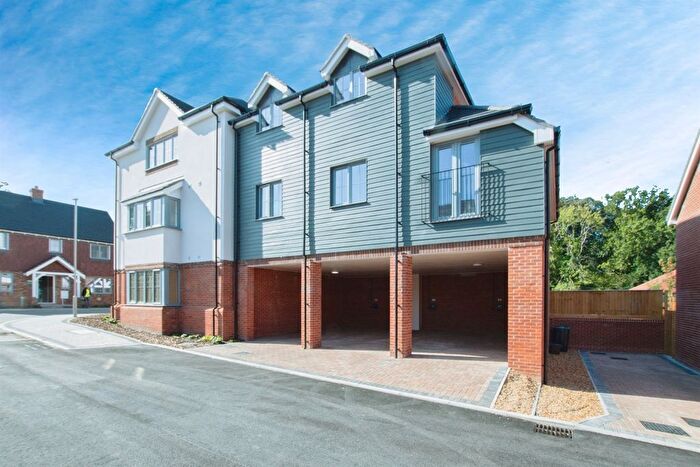
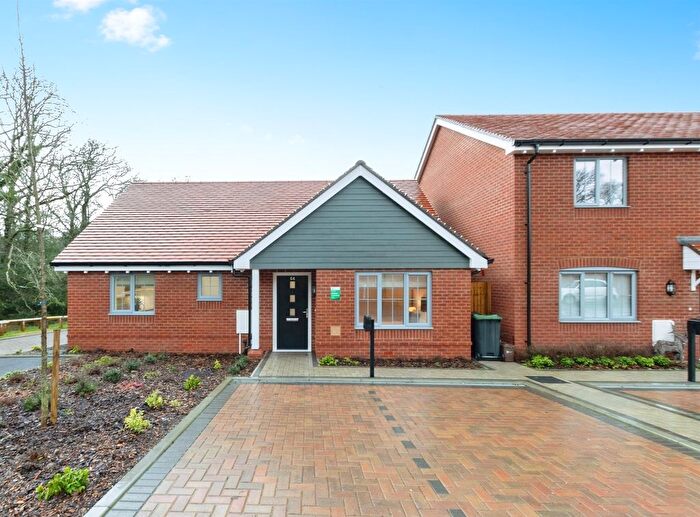
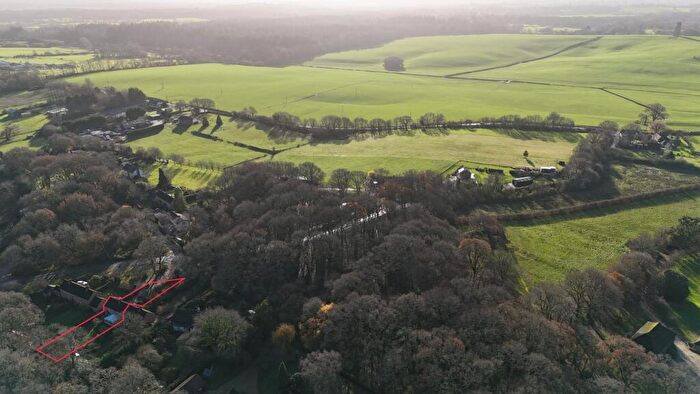
Houses for sale & to rent in Crane, Wimborne
House Prices in Crane
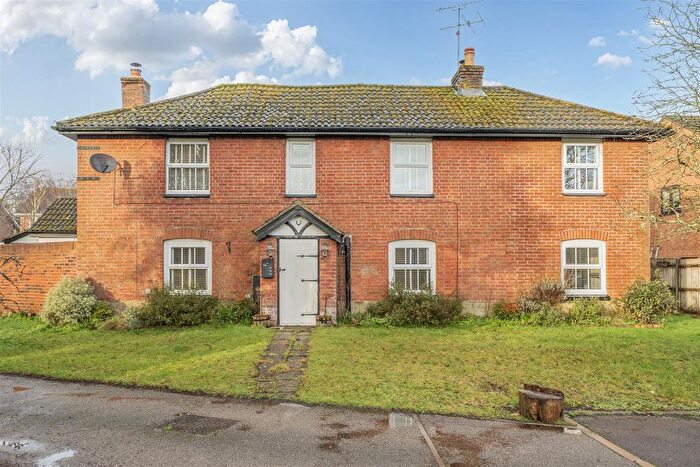
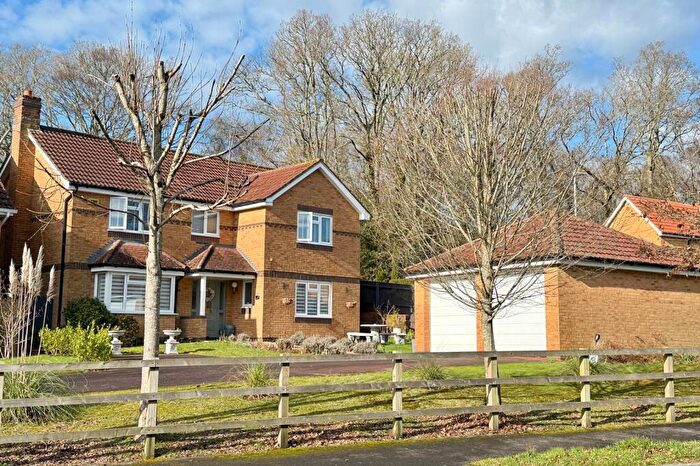
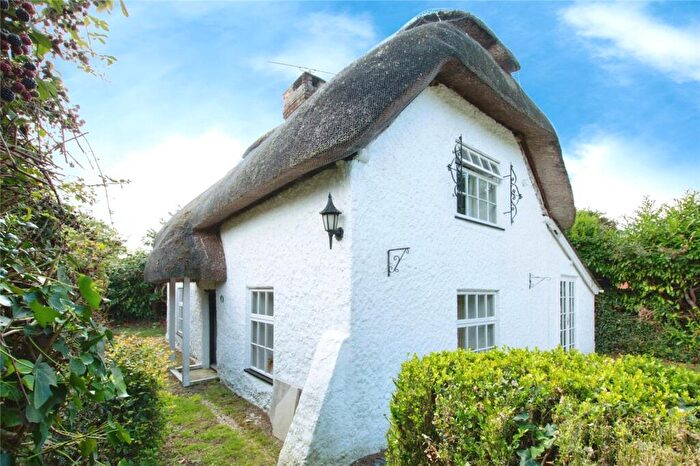
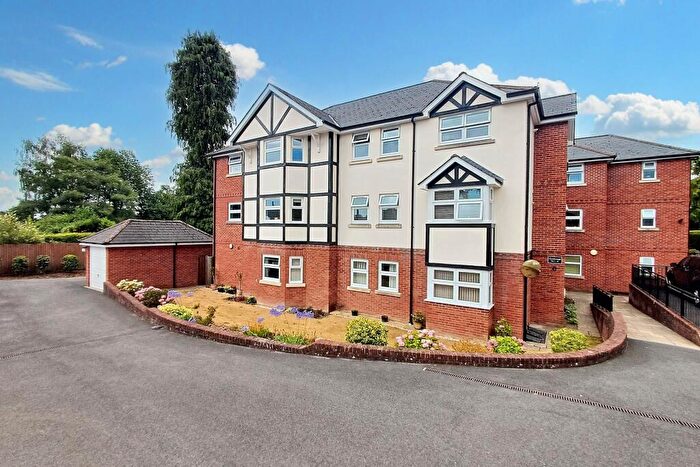
Properties in Crane have an average house price of £519,842.00 and had 27 Property Transactions within the last 3 years¹.
Crane is an area in Wimborne, Dorset with 565 households², where the most expensive property was sold for £1,020,000.00.
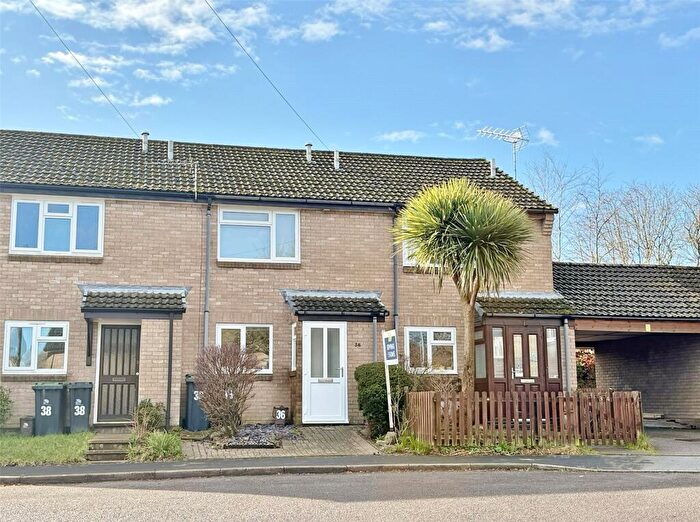
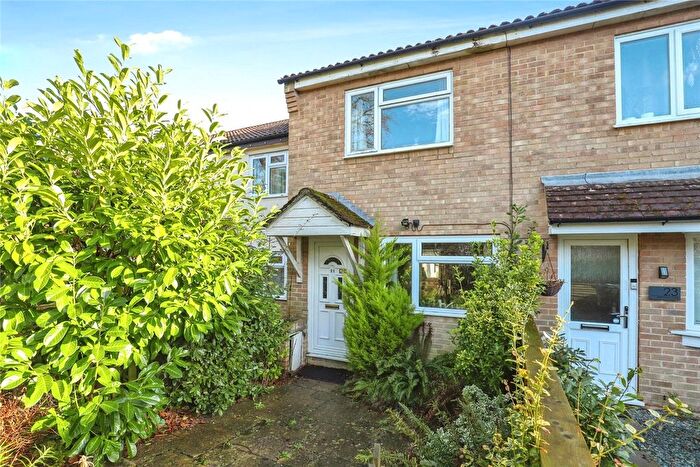
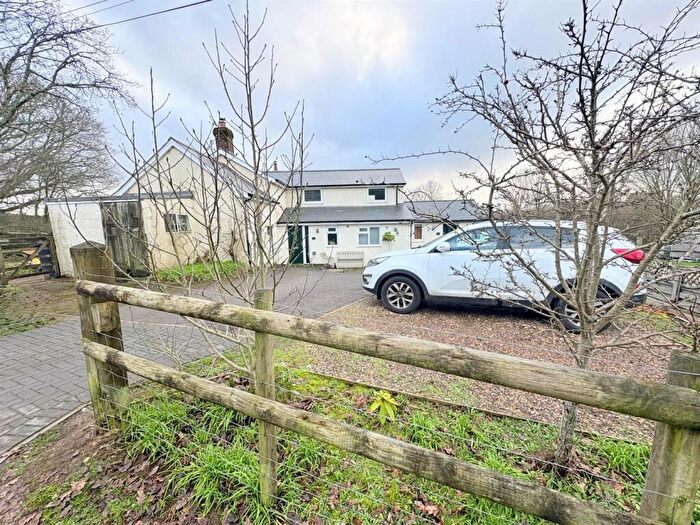
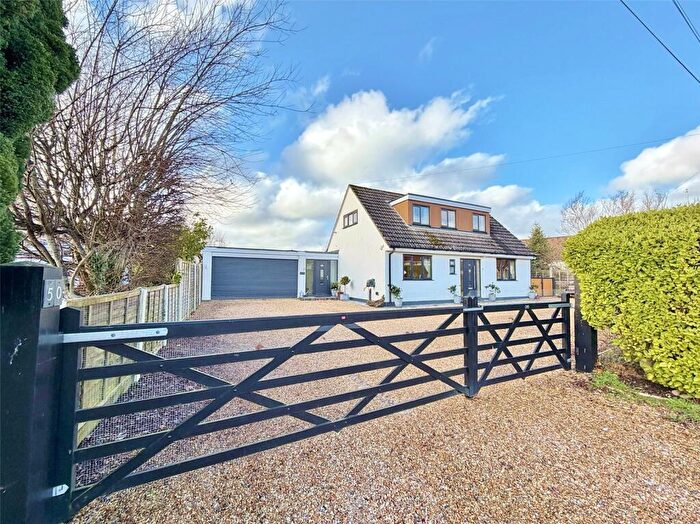
Properties for sale in Crane
Roads and Postcodes in Crane
Navigate through our locations to find the location of your next house in Crane, Wimborne for sale or to rent.
| Streets | Postcodes |
|---|---|
| Baileys Hill | BH21 5NE |
| Batterley Drove | BH21 5QX |
| Castle Close | BH21 5QG |
| Castle Street | BH21 5PZ BH21 5QA |
| Chapel Lane | BH21 8LU |
| Church Street | BH21 5PY |
| Crane Street | BH21 5QD |
| Gotham | BH21 5QY |
| Grugs Lane | BH21 5PX |
| Hare Lane | BH21 5QT |
| Hibberds Field | BH21 5QL |
| Hillside Road | BH21 8NJ |
| Hillside Walk | BH21 8NL |
| Holwell | BH21 5QS |
| Horton Road | BH21 8NB BH21 8ND BH21 8NE BH21 8NF |
| Jubilee Hill | BH21 8LY |
| Kings Lane | BH21 8LZ |
| Matterly Cottages | BH21 7HN |
| New Road | BH21 8LR |
| Pennys Lane | BH21 5QE |
| Pennys Mead | BH21 5QH |
| Pye Lane | BH21 5QU |
| Salisbury Street | BH21 5PU |
| Slough Lane | BH21 7JL |
| Swan Street | BH21 5PT |
| The Square | BH21 5PR |
| Verwood Road | BH21 8LJ BH21 8LW |
| Water Street | BH21 5QB |
| West View | BH21 5LY |
| Whitmore Lane | BH21 8LS |
| Wimborne Street | BH21 5PP |
| BH21 5AE BH21 5LX BH21 5LZ BH21 5NF BH21 5NZ BH21 5PN BH21 5RF BH21 5RG BH21 5RH BH21 5RJ BH21 5RR BH21 5RW BH21 5RX BH21 5RZ BH21 7HL BH21 8LL BH21 8LN BH21 8LP BH21 8LT BH21 8NG BH21 8NQ |
Transport near Crane
-
Branksome Station
-
Bournemouth Station
-
Parkstone Station
-
Pokesdown Station
-
Salisbury Station
-
Christchurch Station
-
Poole Station
-
Hamworthy Station
-
Tisbury Station
-
Hinton Admiral Station
- FAQ
- Price Paid By Year
- Property Type Price
Frequently asked questions about Crane
What is the average price for a property for sale in Crane?
The average price for a property for sale in Crane is £519,842. This amount is 16% higher than the average price in Wimborne. There are 1,579 property listings for sale in Crane.
What streets have the most expensive properties for sale in Crane?
The streets with the most expensive properties for sale in Crane are Water Street at an average of £585,000, Slough Lane at an average of £562,500 and Castle Close at an average of £540,000.
What streets have the most affordable properties for sale in Crane?
The streets with the most affordable properties for sale in Crane are Castle Street at an average of £368,333, Horton Road at an average of £410,000 and Wimborne Street at an average of £427,000.
Which train stations are available in or near Crane?
Some of the train stations available in or near Crane are Branksome, Bournemouth and Parkstone.
Property Price Paid in Crane by Year
The average sold property price by year was:
| Year | Average Sold Price | Price Change |
Sold Properties
|
|---|---|---|---|
| 2025 | £606,500 | 24% |
8 Properties |
| 2024 | £463,333 | -8% |
9 Properties |
| 2023 | £501,375 | -43% |
10 Properties |
| 2022 | £719,363 | 14% |
11 Properties |
| 2021 | £615,157 | 16% |
27 Properties |
| 2020 | £518,187 | 25% |
8 Properties |
| 2019 | £389,363 | -32% |
11 Properties |
| 2018 | £514,617 | -5% |
17 Properties |
| 2017 | £540,421 | 23% |
19 Properties |
| 2016 | £418,437 | -8% |
16 Properties |
| 2015 | £453,467 | -16% |
14 Properties |
| 2014 | £524,830 | 20% |
15 Properties |
| 2013 | £417,730 | 10% |
13 Properties |
| 2012 | £376,458 | 11% |
12 Properties |
| 2011 | £333,700 | -8% |
10 Properties |
| 2010 | £358,750 | -18% |
10 Properties |
| 2009 | £422,595 | -24% |
10 Properties |
| 2008 | £525,333 | 27% |
6 Properties |
| 2007 | £383,597 | -26% |
20 Properties |
| 2006 | £481,733 | 36% |
15 Properties |
| 2005 | £306,728 | -36% |
14 Properties |
| 2004 | £418,326 | 22% |
13 Properties |
| 2003 | £326,979 | 18% |
19 Properties |
| 2002 | £267,917 | 5% |
28 Properties |
| 2001 | £254,833 | -8% |
18 Properties |
| 2000 | £276,400 | 36% |
10 Properties |
| 1999 | £176,814 | -10% |
20 Properties |
| 1998 | £194,125 | 8% |
20 Properties |
| 1997 | £178,500 | 38% |
26 Properties |
| 1996 | £110,942 | -24% |
27 Properties |
| 1995 | £137,720 | - |
17 Properties |
Property Price per Property Type in Crane
Here you can find historic sold price data in order to help with your property search.
The average Property Paid Price for specific property types in the last three years are:
| Property Type | Average Sold Price | Sold Properties |
|---|---|---|
| Semi Detached House | £427,159.00 | 11 Semi Detached Houses |
| Detached House | £622,307.00 | 13 Detached Houses |
| Terraced House | £415,666.00 | 3 Terraced Houses |

