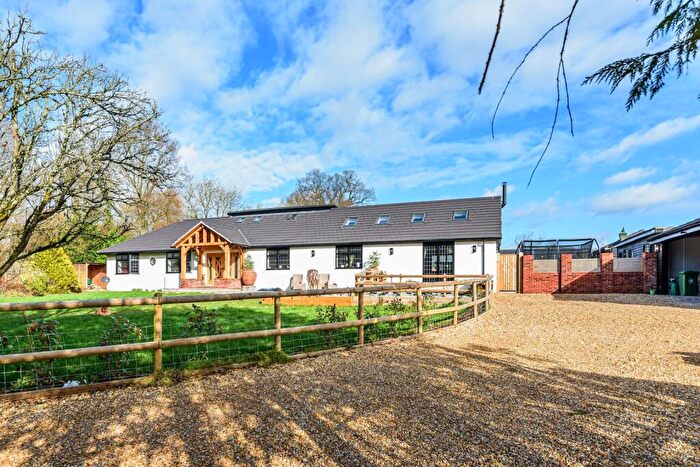
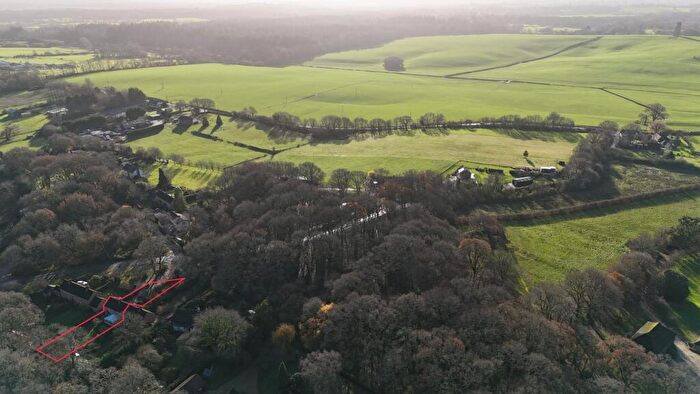
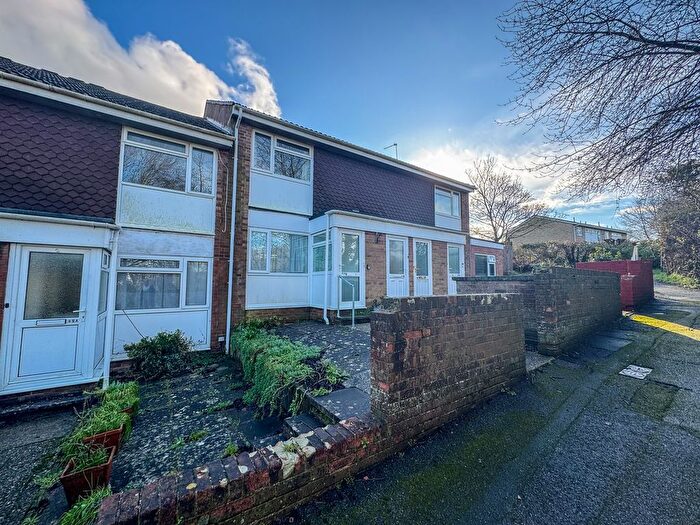
Houses for sale & to rent in Holt, Wimborne
House Prices in Holt
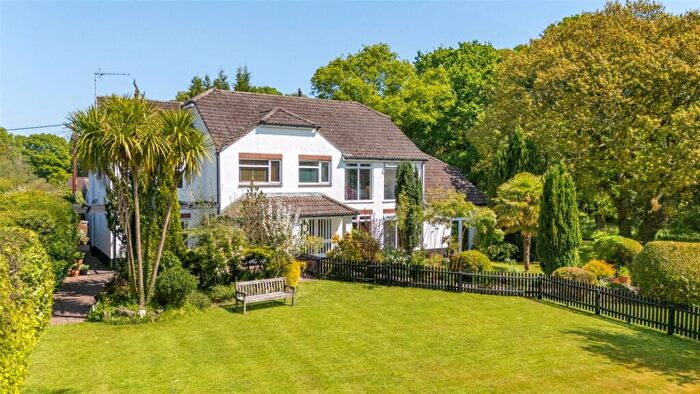
Properties in Holt have an average house price of £747,020.00 and had 48 Property Transactions within the last 3 years¹.
Holt is an area in Wimborne, Dorset with 837 households², where the most expensive property was sold for £1,700,000.00.
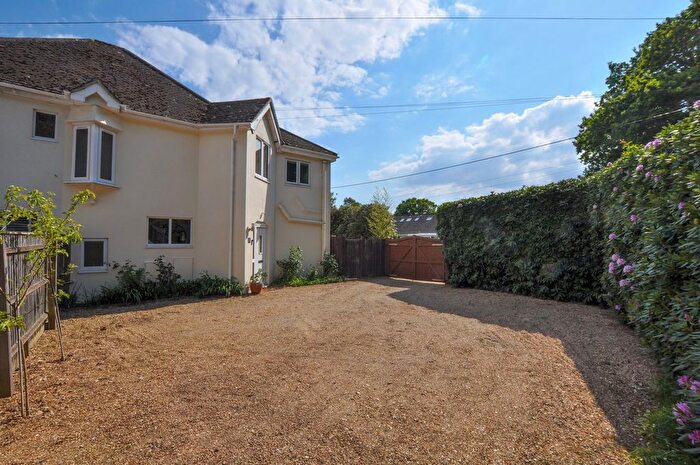
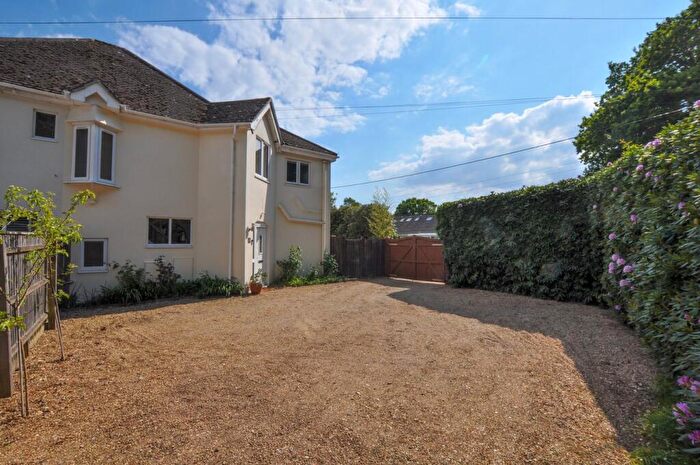
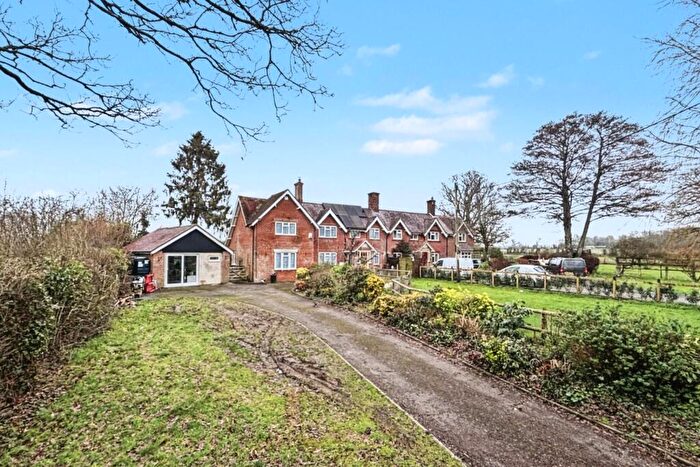
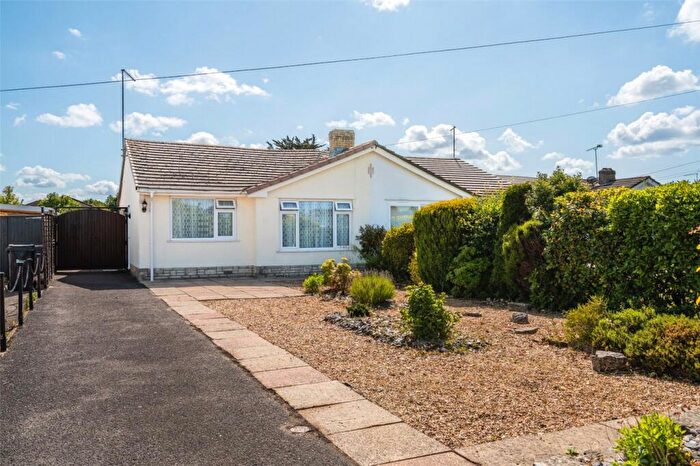
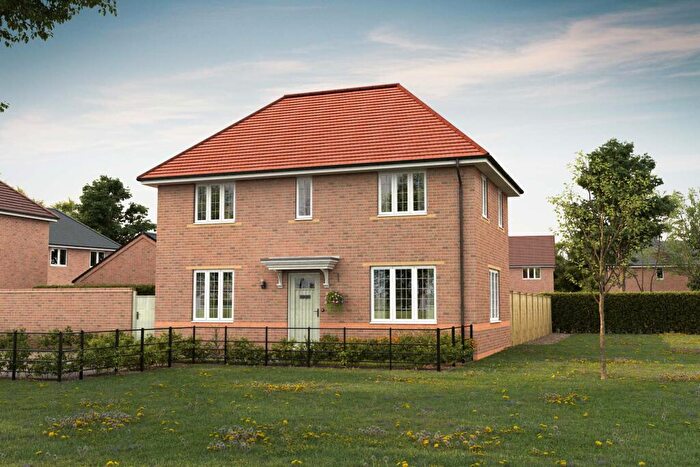
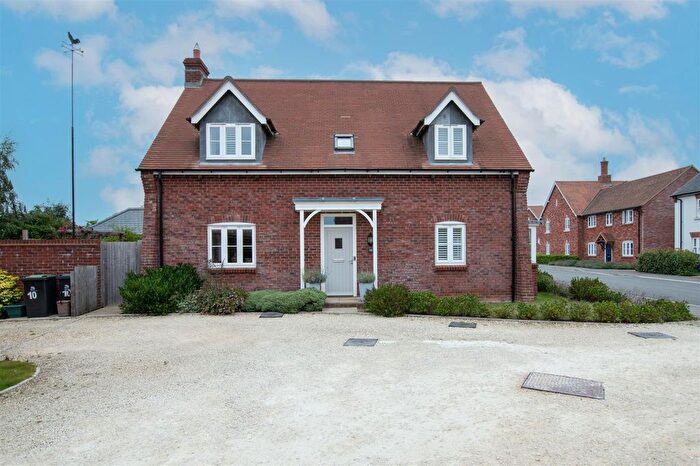
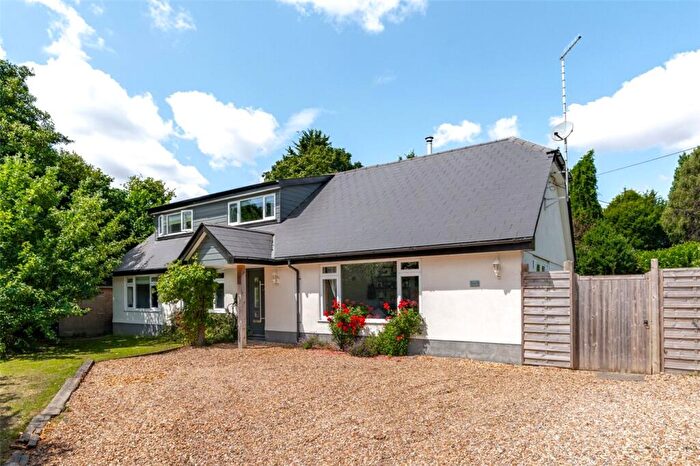
Properties for sale in Holt
Roads and Postcodes in Holt
Navigate through our locations to find the location of your next house in Holt, Wimborne for sale or to rent.
| Streets | Postcodes |
|---|---|
| Ashbury Cottages | BH21 7HG |
| Broomhill | BH21 7AR |
| Burts Cottages | BH21 4JW |
| Burts Lane | BH21 7JX |
| Cranborne Road | BH21 7HW |
| Furzehill | BH21 4HT |
| Gaunts Common | BH21 4JN BH21 4JP BH21 4JR |
| Gods Blessing Green | BH21 7DD |
| Gods Blessing Lane | BH21 7DE |
| Haythorne | BH21 7JG |
| Haythorne Common | BH21 7JQ |
| High Lea | BH21 5AB |
| Holt Forest | BH21 7BT |
| Holt Green | BH21 7DH |
| Holt Lane | BH21 7DQ |
| Holt Road | BH21 7JY |
| Holt Wood | BH21 7DR BH21 7DS BH21 7DT BH21 7DU BH21 7DX |
| Horton Heath | BH21 7JN BH21 7JR BH21 7JS |
| Horton Hollow | BH21 7EP |
| Horton Road | BH21 6SD |
| Lodge Road | BH21 7DN BH21 7DW |
| Lower Row | BH21 7DZ |
| Manor Farm Cottages | BH21 7HF |
| Newtown | BH21 5AY |
| Petersham Lane | BH21 4JQ |
| Pig Oak | BH21 7DG |
| Pond Head | BH21 7DP |
| Queens Copse Lane | BH21 7EF |
| Rowe Hill | BH21 7EB |
| Smugglers Lane | BH21 4HB |
| Stanbridge | BH21 4JD |
| Tower Close | BH21 7ET |
| Uddens Drive | BH21 7BN |
| Uppington | BH21 7HA BH21 7HP |
| Uppington Close | BH21 7HS |
| Village Hall Lane | BH21 6SG |
| Welchnut Cottages | BH21 7JE |
| West Moors Road | BH21 6QP |
| Whitemoor | BH21 7DA |
| Wigbeth | BH21 7JH BH21 7JJ |
| Woodcutts Farm Cottages | BH21 4JJ |
| Woodhuish | BH21 7EA |
| BH21 4HU BH21 4HX BH21 4JS BH21 7BJ BH21 7DB BH21 7DJ BH21 7DL BH21 7ER BH21 7EU BH21 7EY BH21 7EZ BH21 7HD BH21 7HE BH21 7HR BH21 7JA BH21 7JB BH21 7JU BH21 7JZ BH21 7LA |
Transport near Holt
-
Branksome Station
-
Parkstone Station
-
Hamworthy Station
-
Poole Station
-
Bournemouth Station
-
Pokesdown Station
- FAQ
- Price Paid By Year
- Property Type Price
Frequently asked questions about Holt
What is the average price for a property for sale in Holt?
The average price for a property for sale in Holt is £747,020. This amount is 67% higher than the average price in Wimborne. There are 4,929 property listings for sale in Holt.
What streets have the most expensive properties for sale in Holt?
The streets with the most expensive properties for sale in Holt are Holt Lane at an average of £1,080,000, Uppington at an average of £1,080,000 and Broomhill at an average of £823,750.
What streets have the most affordable properties for sale in Holt?
The streets with the most affordable properties for sale in Holt are Cranborne Road at an average of £200,000, Village Hall Lane at an average of £410,000 and Horton Heath at an average of £495,125.
Which train stations are available in or near Holt?
Some of the train stations available in or near Holt are Branksome, Parkstone and Hamworthy.
Property Price Paid in Holt by Year
The average sold property price by year was:
| Year | Average Sold Price | Price Change |
Sold Properties
|
|---|---|---|---|
| 2025 | £717,576 | 4% |
13 Properties |
| 2024 | £691,625 | -15% |
12 Properties |
| 2023 | £792,565 | -4% |
23 Properties |
| 2022 | £825,027 | 13% |
18 Properties |
| 2021 | £721,462 | 19% |
49 Properties |
| 2020 | £587,647 | -2% |
17 Properties |
| 2019 | £599,740 | -8% |
26 Properties |
| 2018 | £647,673 | -5% |
23 Properties |
| 2017 | £681,225 | 15% |
39 Properties |
| 2016 | £577,562 | 1% |
24 Properties |
| 2015 | £569,081 | 12% |
29 Properties |
| 2014 | £502,496 | -3% |
28 Properties |
| 2013 | £519,360 | 12% |
20 Properties |
| 2012 | £459,466 | -6% |
15 Properties |
| 2011 | £487,191 | 12% |
17 Properties |
| 2010 | £430,472 | -18% |
22 Properties |
| 2009 | £506,835 | 18% |
19 Properties |
| 2008 | £417,357 | -24% |
14 Properties |
| 2007 | £516,541 | 12% |
34 Properties |
| 2006 | £454,467 | 12% |
31 Properties |
| 2005 | £401,804 | -14% |
22 Properties |
| 2004 | £456,562 | 5% |
30 Properties |
| 2003 | £435,859 | 31% |
34 Properties |
| 2002 | £299,261 | -7% |
41 Properties |
| 2001 | £321,137 | 12% |
29 Properties |
| 2000 | £284,010 | 20% |
29 Properties |
| 1999 | £226,801 | 15% |
41 Properties |
| 1998 | £192,442 | 5% |
33 Properties |
| 1997 | £183,168 | 6% |
44 Properties |
| 1996 | £171,825 | 12% |
33 Properties |
| 1995 | £151,660 | - |
28 Properties |
Property Price per Property Type in Holt
Here you can find historic sold price data in order to help with your property search.
The average Property Paid Price for specific property types in the last three years are:
| Property Type | Average Sold Price | Sold Properties |
|---|---|---|
| Semi Detached House | £557,900.00 | 5 Semi Detached Houses |
| Detached House | £769,011.00 | 43 Detached Houses |

