
Houses for sale in Longham, Wimborne
House Prices in Longham
Properties in Longham have an average house price of £711k and had 3 Property Transactions within the last 3 years¹.
Longham is an area in Wimborne, Dorset with 33 households², where the most expensive property was sold for £890k.
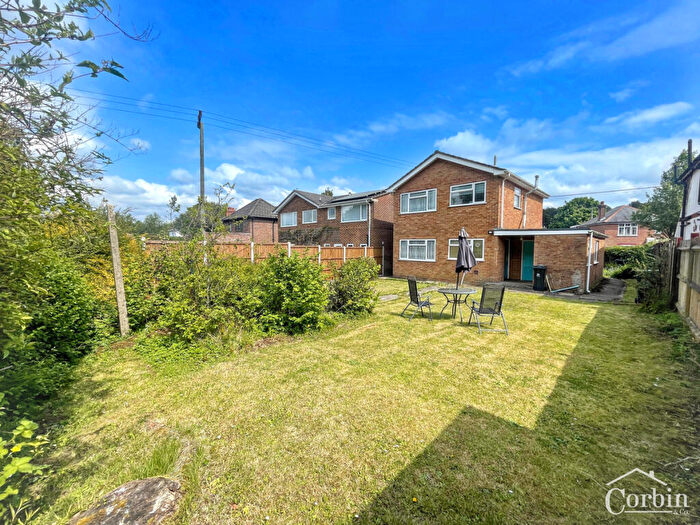
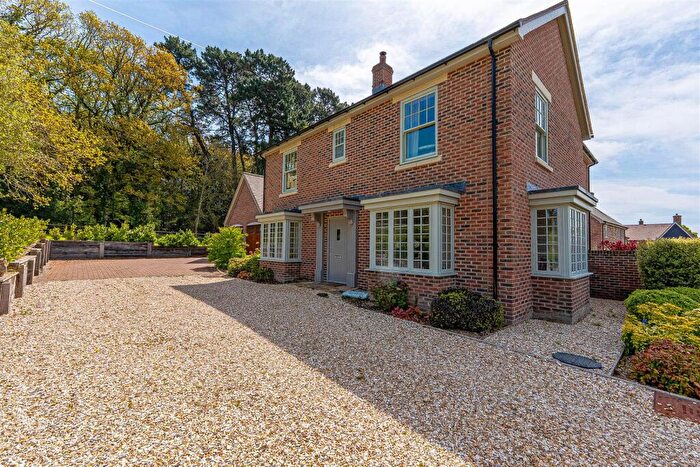
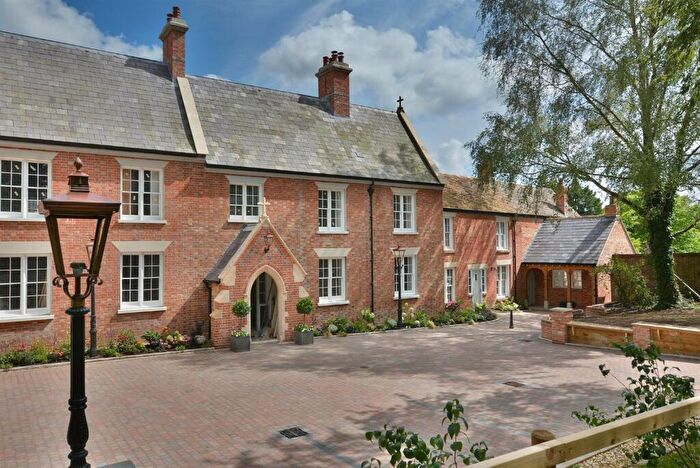
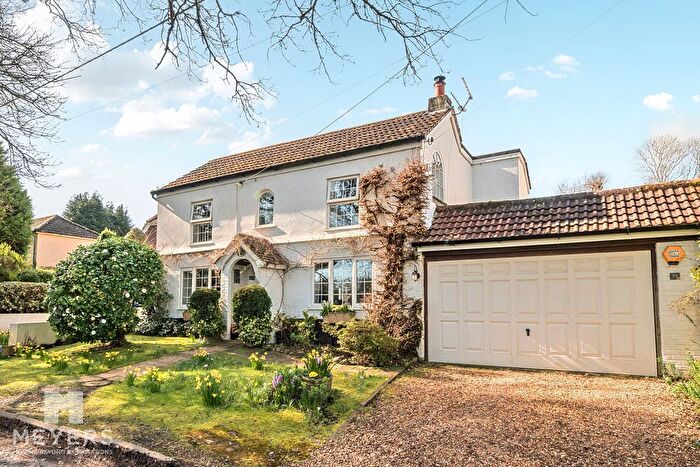
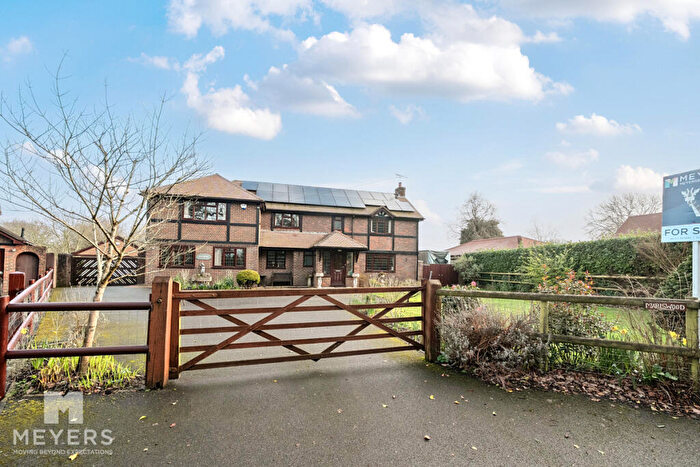
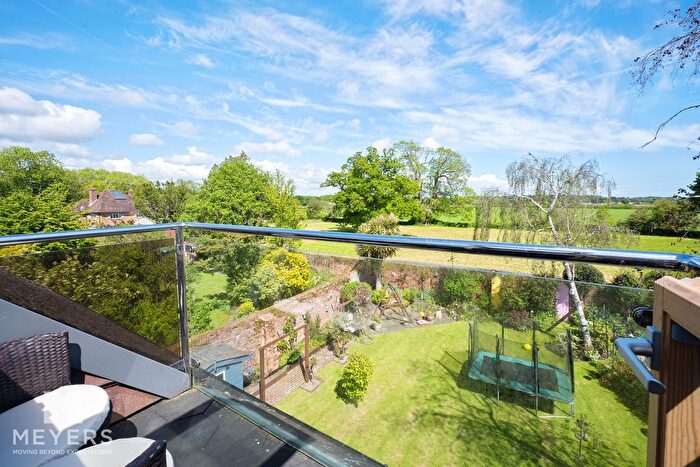
Properties for sale in Longham
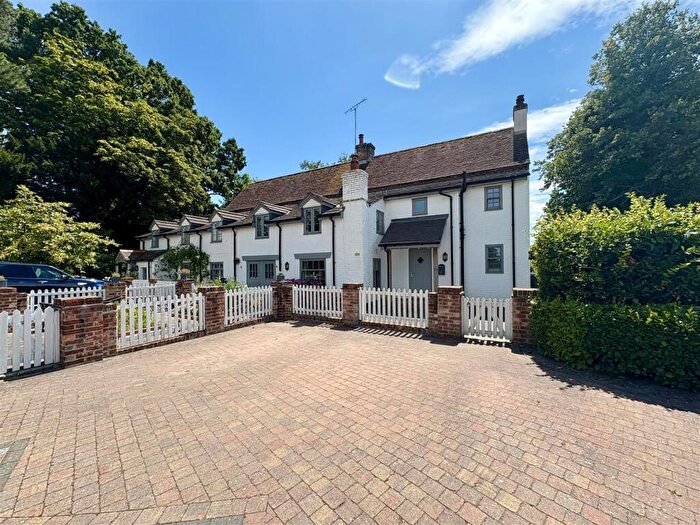
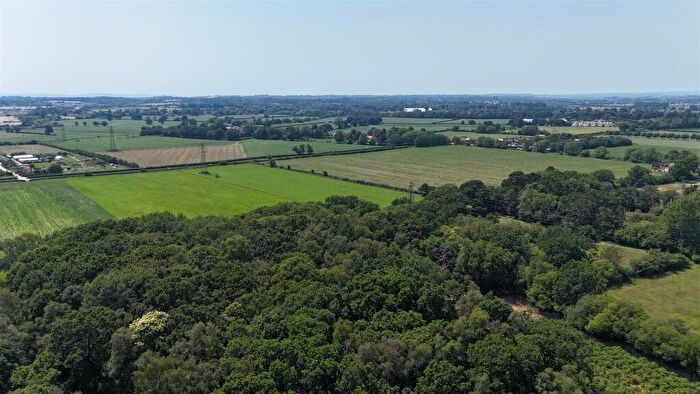
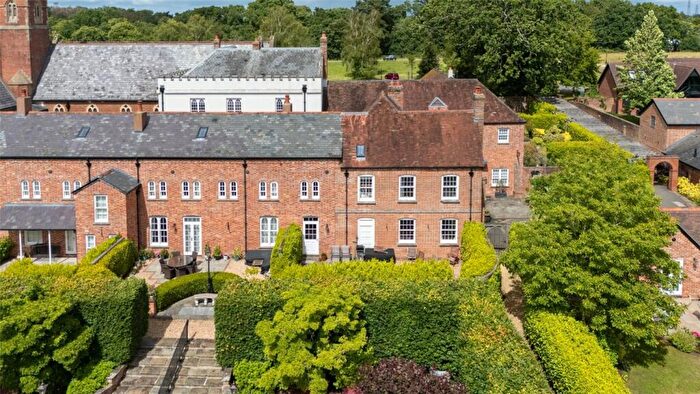
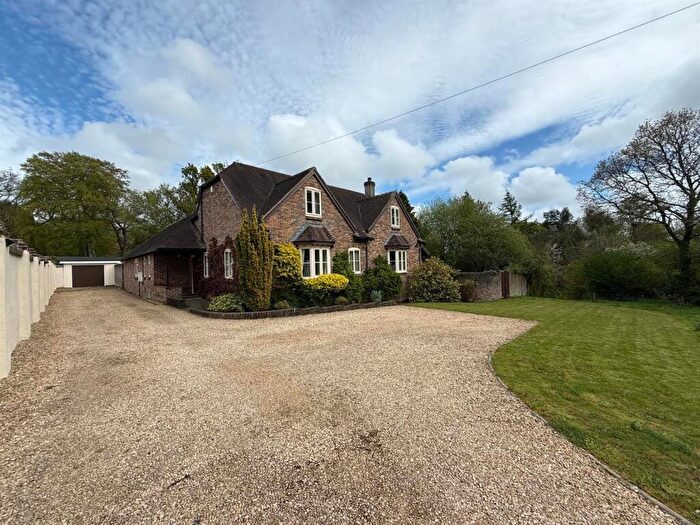
![]()
If you are looking to sell your house, let it out, or receive a property valuation, an expert can help you.
Click the button below to get started.
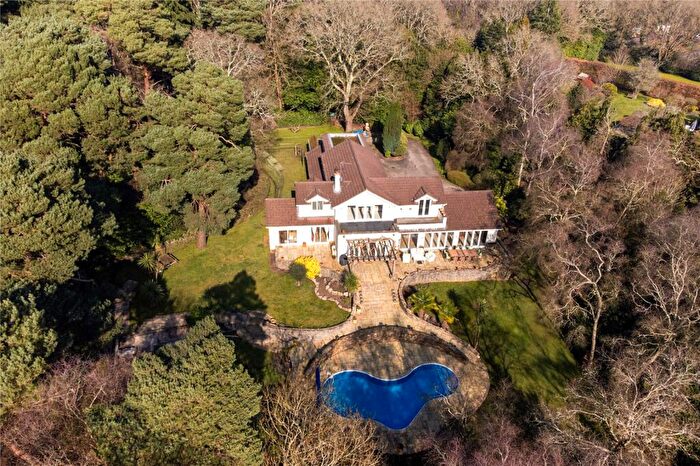
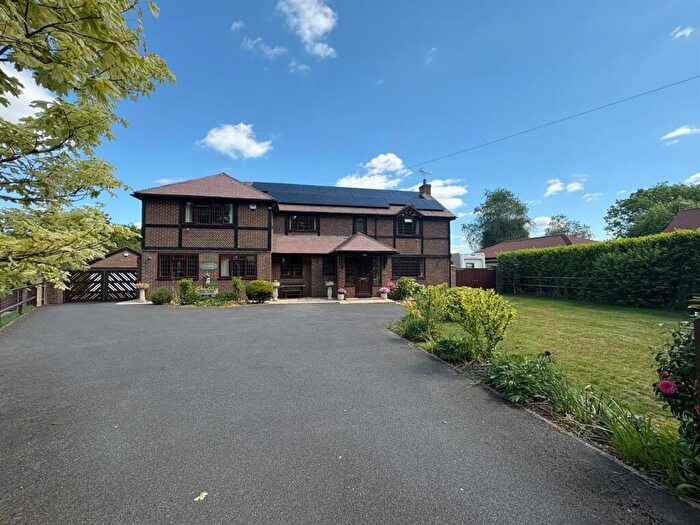
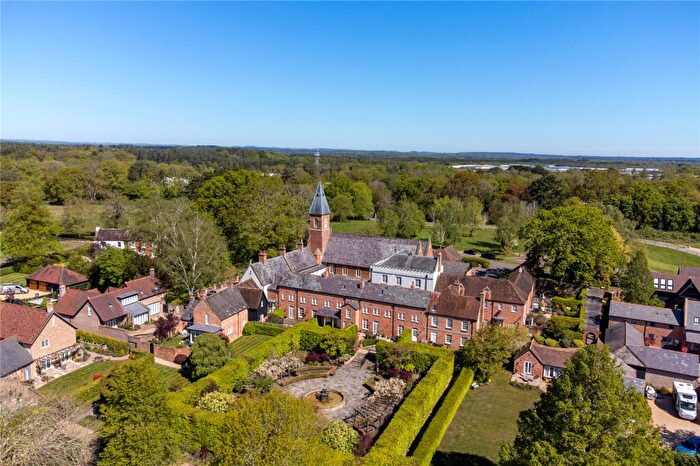
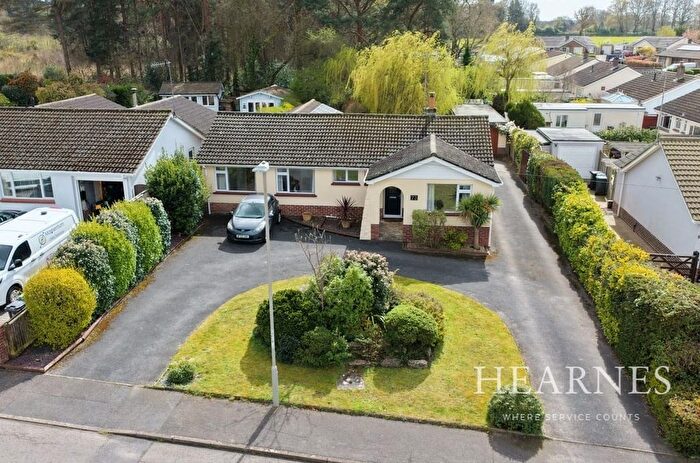

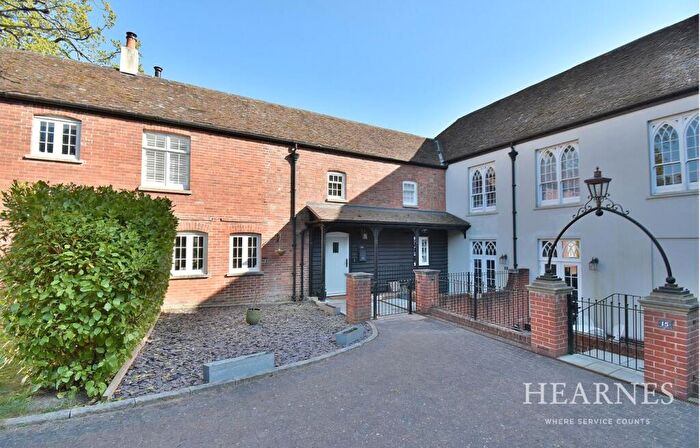
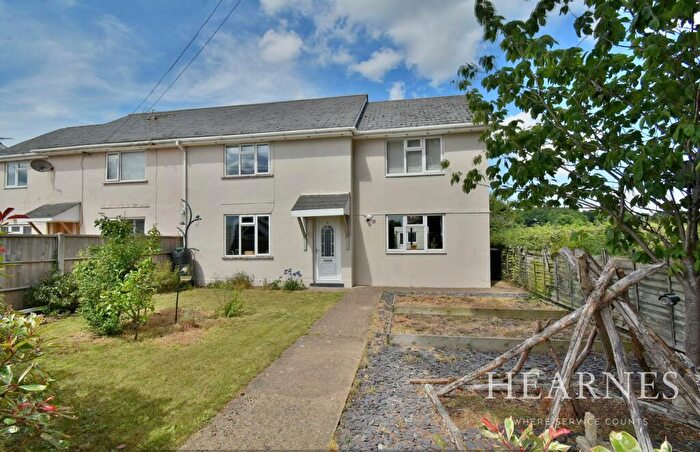
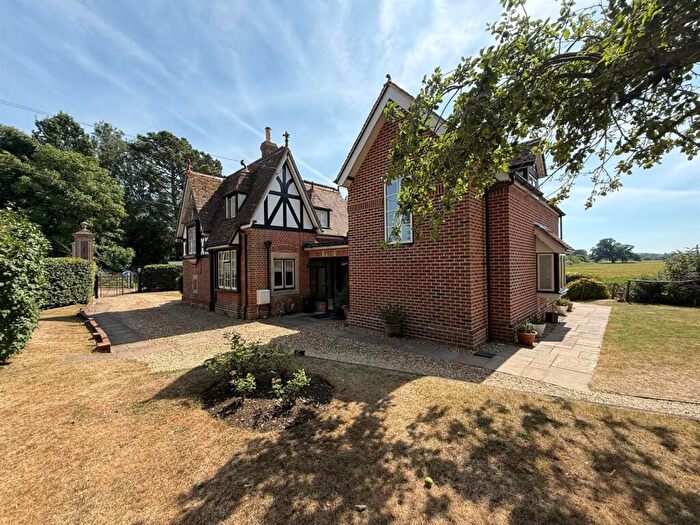
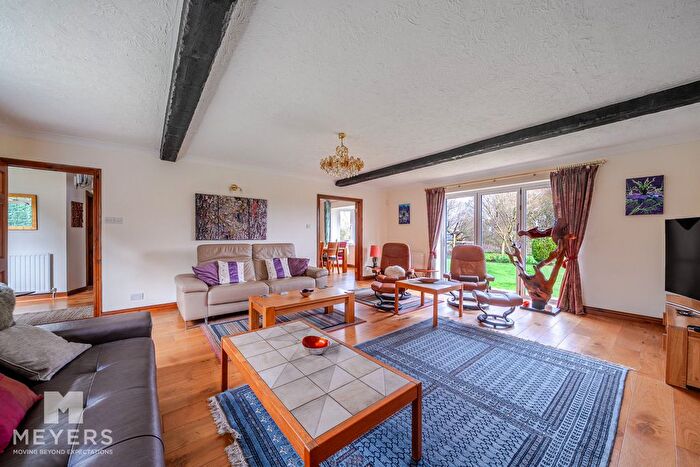
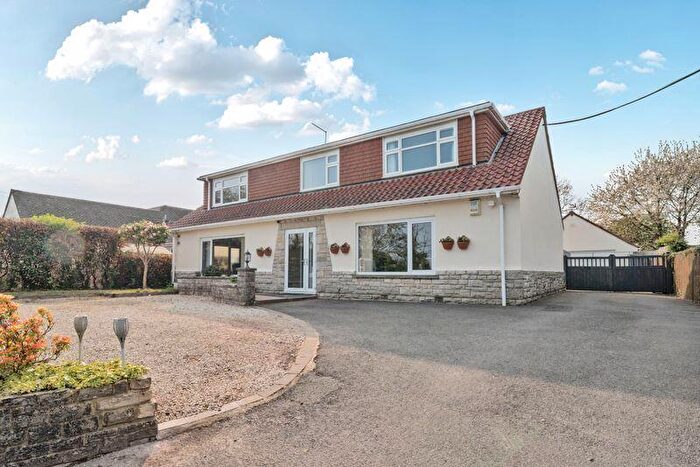
Previously listed properties in Longham

![]()
If you are looking to sell your house, let it out, or receive a property valuation, an expert can help you.
Click the button below to get started.
Roads and Postcodes in Longham
Navigate through our locations to find the location of your next house in Longham, Wimborne for sale or to rent.
Property price trends in Longham
According to the latest Land Registry data, the average home in Longham sold for £787,500 in 2025. That figure comes from 21 sales logged over the past 29 years.
Prices have continued to climb over the last three years. Compared with 2021, when the typical sale came in around £560,000, that's a rise of roughly 40.6%.
Looking back five years, average prices are up about 44.5% since 2019, a gain of around £242,500 in cash terms.
Frequently asked questions about Longham
What is the average price for a property for sale in Longham?
The average price for a property for sale in Longham is £710,800. This amount is 59% higher than the average price in Wimborne. There are 89 property listings for sale in Longham.
What streets have the most expensive properties for sale in Longham?
The street with the most expensive properties for sale in Longham is Stapehill Road at an average of £890,000.
What streets have the most affordable properties for sale in Longham?
The street with the most affordable properties for sale in Longham is Ham Lane at an average of £621,200.
Which train stations are available in or near Longham?
Some of the train stations available in or near Longham are Branksome, Parkstone and Bournemouth.
Property Price Paid in Longham by Year
The average sold property price by year was:
| Year | Average Sold Price | Price Change |
Sold Properties
|
|---|---|---|---|
| 2025 | £787,500 | 29% |
2 Properties |
| 2024 | £557,400 | -0,5% |
1 Property |
| 2021 | £560,000 | 3% |
1 Property |
| 2019 | £545,000 | 4% |
1 Property |
| 2018 | £522,500 | 28% |
1 Property |
| 2011 | £376,000 | 15% |
4 Properties |
| 2009 | £318,500 | -90% |
1 Property |
| 2008 | £604,150 | 35% |
1 Property |
| 2006 | £393,316 | -14% |
3 Properties |
| 2005 | £450,000 | 47% |
1 Property |
Property Price per Property Type in Longham
Here you can find historic sold price data in order to help with your property search.
The average Property Paid Price for specific property types in the last three years are:
| Property Type | Average Sold Price | Sold Properties |
|---|---|---|
| Detached House | £710,800.00 | 3 Detached Houses |
