Houses for sale & to rent in Amblecote, Brierley Hill
House Prices in Amblecote
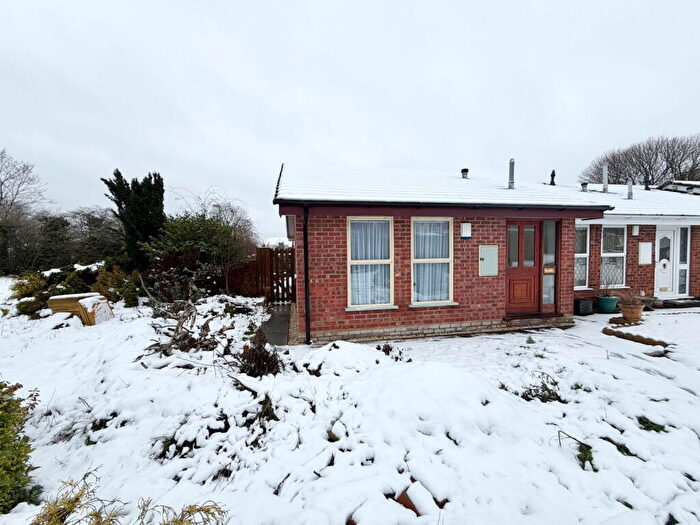
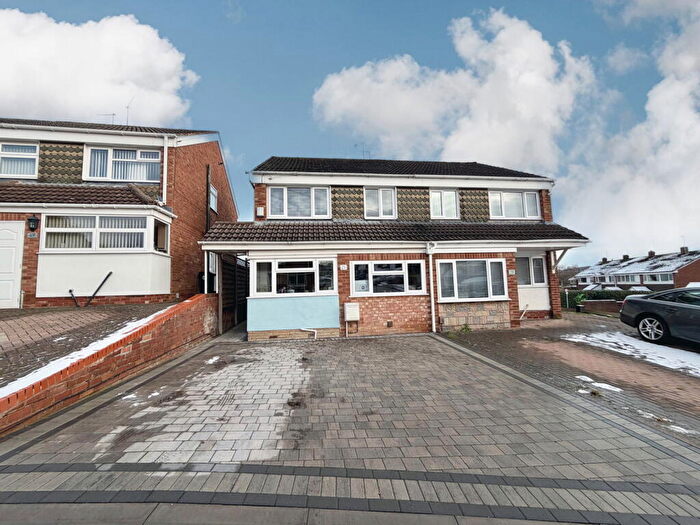
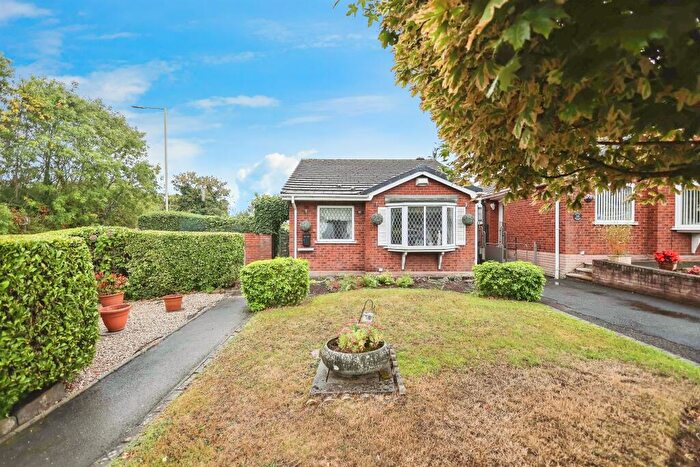
Properties in Amblecote have an average house price of £253,432.00 and had 221 Property Transactions within the last 3 years¹.
Amblecote is an area in Brierley Hill, Dudley with 3,139 households², where the most expensive property was sold for £475,000.00.
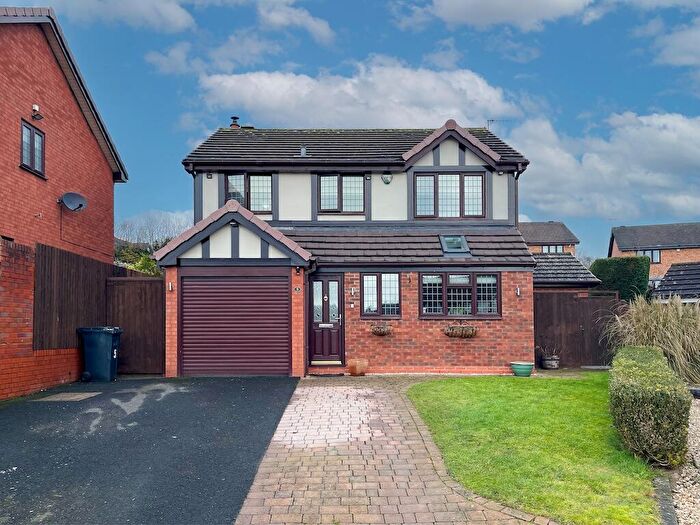
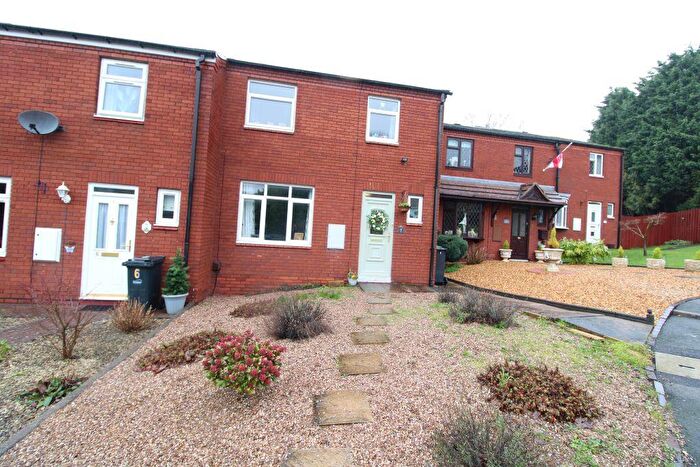
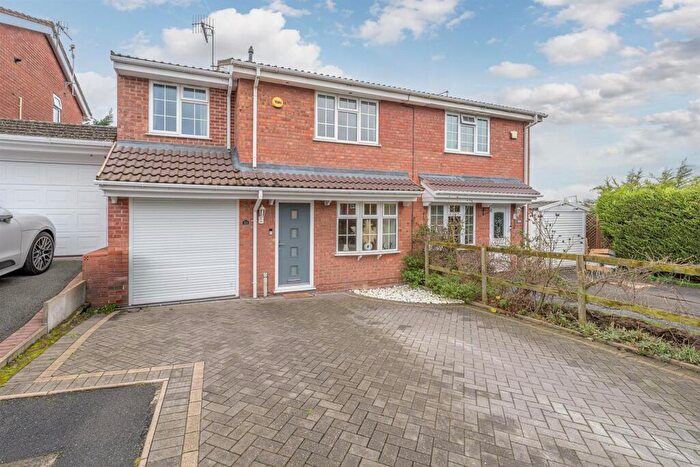
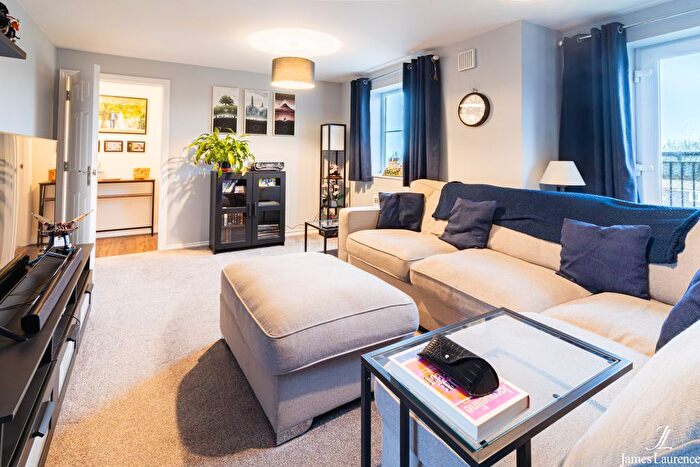
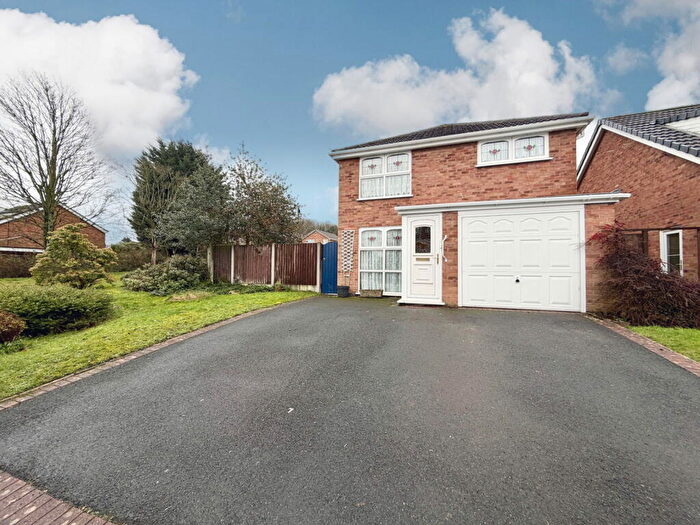
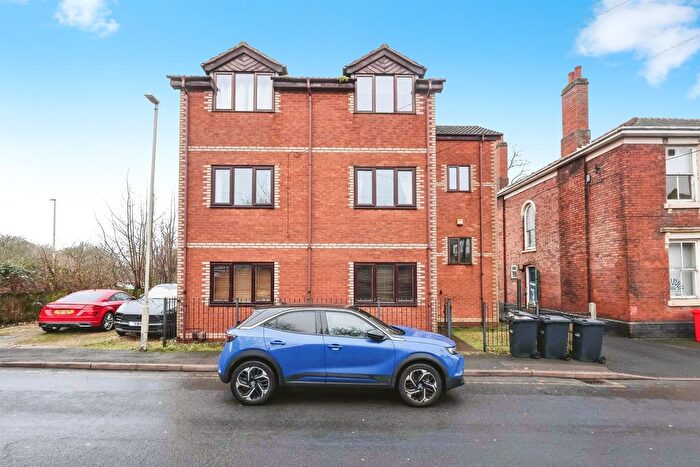
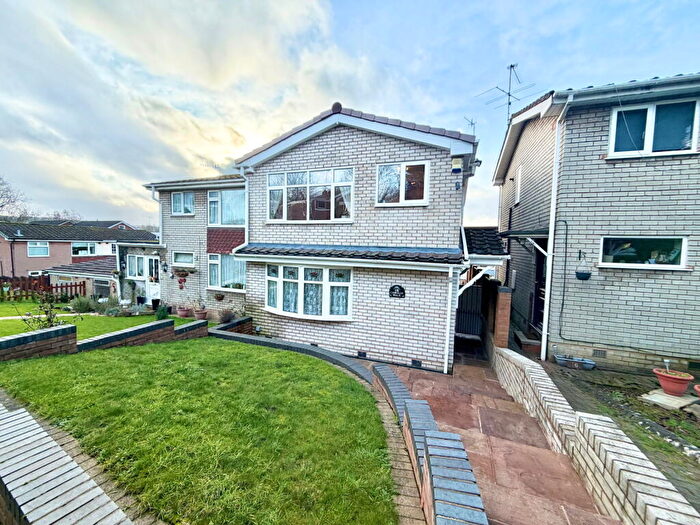
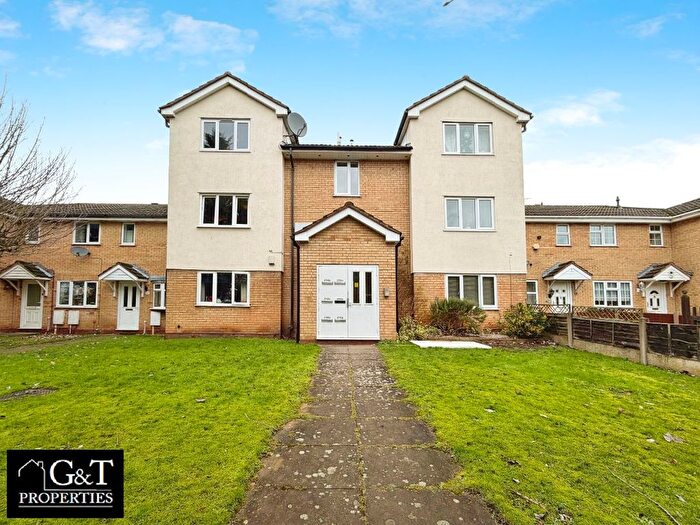
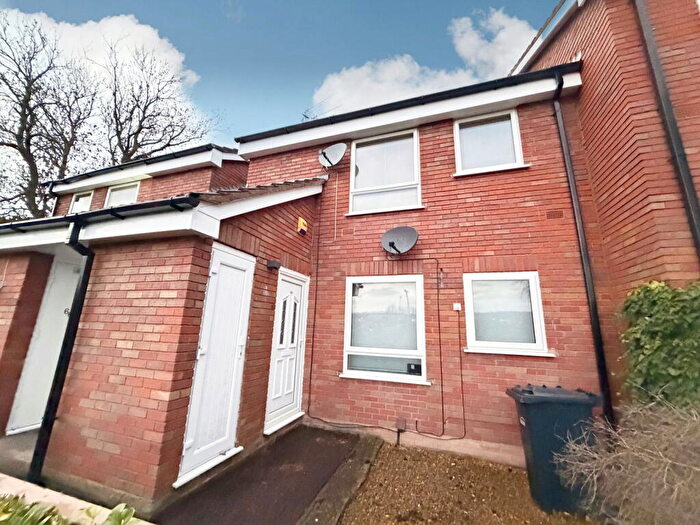
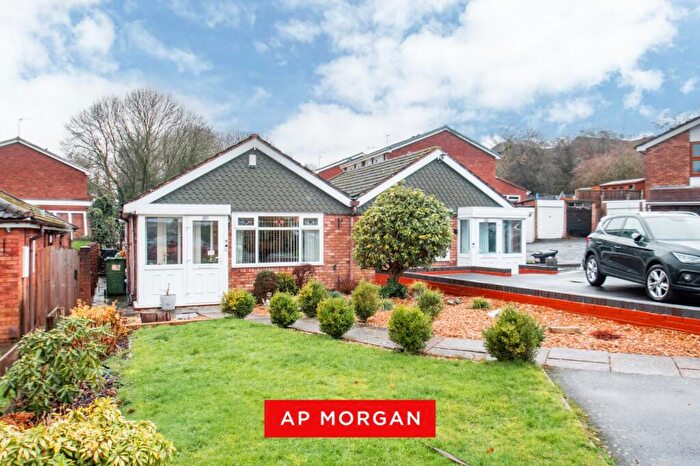
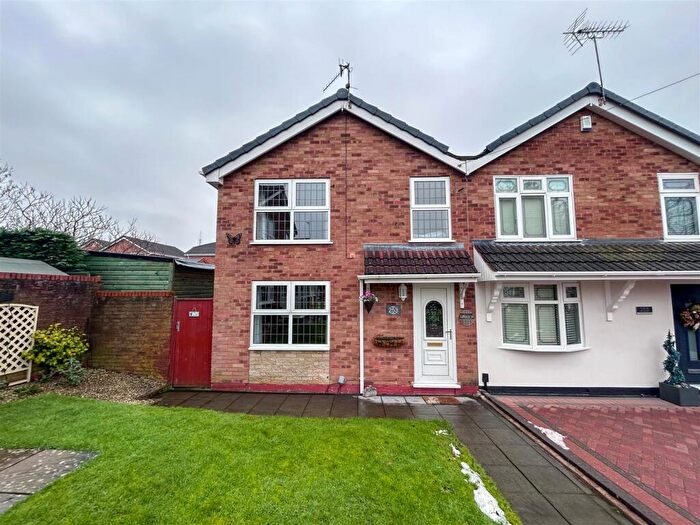
Properties for sale in Amblecote
Roads and Postcodes in Amblecote
Navigate through our locations to find the location of your next house in Amblecote, Brierley Hill for sale or to rent.
| Streets | Postcodes |
|---|---|
| Abbotts Mews | DY5 3DG |
| Acres Road | DY5 2XS DY5 2XT DY5 2XY DY5 2YB |
| Aldeford Drive | DY5 3JF |
| Aldgate Drive | DY5 3NT |
| Amblecote Road | DY5 2PP DY5 2YE DY5 2YG DY5 2YJ DY5 2YQ DY5 2YH |
| Ambleside Drive | DY5 3XL |
| Amelas Close | DY5 3FD |
| Andrews Close | DY5 2XB |
| Ansculf Road | DY5 3FQ |
| Ashton Park Drive | DY5 3ER |
| Ashtree Close | DY5 3FW |
| Bagnall Walk | DY5 2SS |
| Barbrook Drive | DY5 3PZ |
| Barsham Drive | DY5 3HE |
| Batson Rise | DY5 3FP |
| Beeston Close | DY5 3JQ |
| Bewlay Close | DY5 3NW |
| Blake Hall Close | DY5 3NU |
| Borrowdale Close | DY5 3RW |
| Brayford Avenue | DY5 3PW |
| Briseley Close | DY5 3JG |
| Briston Close | DY5 3JX |
| Brompton Drive | DY5 3NZ DY5 3NF DY5 3QS |
| Burghley Walk | DY5 3RN |
| Buttermere Close | DY5 3SD |
| Channon Drive | DY5 2SR |
| Charnwood Close | DY5 3UE |
| Cheyne Walk | DY5 3NX |
| Cider Avenue | DY5 2XP DY5 2XR |
| Clockfields Drive | DY5 3FB |
| Conifer Close | DY5 3HG |
| Culverhouse Drive | DY5 3FE |
| Deeley Street | DY5 2YL |
| Delph Lane | DY5 2YF |
| Delph Road | DY5 2TW |
| Dunsford Close | DY5 3PR |
| Eskdale Walk | DY5 3SG |
| Exford Close | DY5 3PU |
| Farm Road | DY5 2XH |
| Felbrigg Close | DY5 3HB |
| Fimbrell Close | DY5 3FL |
| Finsbury Drive | DY5 3NY |
| Fir Croft | DY5 3HZ |
| Freshwater Drive | DY5 3TP |
| Gayfield Avenue | DY5 2BP DY5 2BT DY5 2BU DY5 2BX DY5 2ST DY5 2SU DY5 3JE DY5 2BH |
| Goldthorn Walk | DY5 2SP |
| Hawthorn Road | DY5 2XZ |
| Helmsley Close | DY5 3UF |
| Heronswood Drive | DY5 3DE |
| Hillfields Road | DY5 2NG |
| Hudswell Drive | DY5 2PD |
| Hunstanton Close | DY5 3QZ |
| Hyatt Square | DY5 3LF |
| Karen Way | DY5 2SN |
| Kelling Close | DY5 3HA |
| Kirkstone Court | DY5 3SF |
| Kirkstone Way | DY5 3RZ |
| Knarsdale Close | DY5 3RF |
| Lakeside Court | DY5 3RQ |
| Lambourne Way | DY5 3RL |
| Larksfield Mews | DY5 2HH |
| Lexington Green | DY5 3LE |
| Leyton Close | DY5 3JJ |
| Lisko Close | DY5 3FN |
| Lorrainer Avenue | DY5 3FH |
| Lythwood Drive | DY5 3QW |
| Marbury Mews | DY5 3DQ |
| Margaret Close | DY5 2XD |
| Millbrook Way | DY5 3YY |
| Monkswell Close | DY5 2BN |
| Morlich Rise | DY5 3YZ |
| Mount Pleasant | DY5 2YN DY5 2YY |
| Norbury Drive | DY5 3DP |
| Northwood Way | DY5 3FR |
| Oakhill Drive | DY5 3PP |
| Orme Close | DY5 3FJ |
| Palm Croft | DY5 3HQ |
| Patterdale Way | DY5 3XJ |
| Penrith Close | DY5 3YX |
| Perrott Gardens | DY5 3FF |
| Plants Hollow | DY5 2BZ |
| Quincy Rise | DY5 3LL |
| Rannoch Close | DY5 3RP |
| Ravensitch Walk | DY5 2BY |
| Rosemoor Drive | DY5 3NS |
| Royal Close | DY5 3HW |
| Salcombe Drive | DY5 3QX |
| Sandringham Way | DY5 3JR |
| Sedgeford Close | DY5 3JD |
| Sevendwellings View | DY5 3BT |
| Shadymoor Drive | DY5 3YF |
| Shorwell Place | DY5 3TZ |
| Silvester Way | DY5 3FG |
| Southcott Avenue | DY5 2SW |
| Squires Court | DY5 3RJ |
| Stanhoe Close | DY5 3JH |
| Studley Drive | DY5 3YE |
| Suffolk Drive | DY5 3QY |
| Tarvin Mews | DY5 3DF |
| The Grove | DY5 3ES |
| Thirlmere Walk | DY5 3SE |
| Thornhill Road | DY5 2XG DY5 2XQ |
| Thorns Avenue | DY5 2XE DY5 2XJ DY5 2XL DY5 2XW DY5 2XN |
| Thorns Road | DY5 2JT DY5 2JU |
| Thornton Drive | DY5 2BS |
| Tilston Drive | DY5 3DR |
| Troutbeck Drive | DY5 3YU |
| Turners Lane | DY5 2PG DY5 2PQ DY5 3SQ |
| Vicarage Close | DY5 2RJ |
| Vicarage Road | DY5 2PS |
| Walthamstow Court | DY5 2BL |
| Warner Drive | DY5 2BW |
| Waterside View | DY5 3YA |
| Willow Rise | DY5 3EW |
| Woburn Drive | DY5 3UD |
| Woodcombe Close | DY5 3PQ |
| Wroxall Close | DY5 3TT |
| Wychbury Road | DY5 2XU DY5 2XX |
Transport near Amblecote
- FAQ
- Price Paid By Year
- Property Type Price
Frequently asked questions about Amblecote
What is the average price for a property for sale in Amblecote?
The average price for a property for sale in Amblecote is £253,432. This amount is 29% higher than the average price in Brierley Hill. There are 1,335 property listings for sale in Amblecote.
What streets have the most expensive properties for sale in Amblecote?
The streets with the most expensive properties for sale in Amblecote are Culverhouse Drive at an average of £475,000, Vicarage Road at an average of £440,000 and Millbrook Way at an average of £427,500.
What streets have the most affordable properties for sale in Amblecote?
The streets with the most affordable properties for sale in Amblecote are Hudswell Drive at an average of £97,000, Kirkstone Court at an average of £144,125 and Thorns Avenue at an average of £147,750.
Which train stations are available in or near Amblecote?
Some of the train stations available in or near Amblecote are Lye, Stourbridge Town and Cradley Heath.
Property Price Paid in Amblecote by Year
The average sold property price by year was:
| Year | Average Sold Price | Price Change |
Sold Properties
|
|---|---|---|---|
| 2025 | £273,470 | 10% |
62 Properties |
| 2024 | £246,911 | 1% |
89 Properties |
| 2023 | £243,974 | 1% |
70 Properties |
| 2022 | £241,696 | -0,4% |
107 Properties |
| 2021 | £242,651 | 13% |
129 Properties |
| 2020 | £210,464 | 6% |
84 Properties |
| 2019 | £196,934 | -1% |
120 Properties |
| 2018 | £199,407 | 3% |
114 Properties |
| 2017 | £193,198 | 6% |
110 Properties |
| 2016 | £182,317 | 6% |
98 Properties |
| 2015 | £171,996 | 1% |
96 Properties |
| 2014 | £169,479 | 5% |
110 Properties |
| 2013 | £161,839 | 3% |
85 Properties |
| 2012 | £156,389 | 0,2% |
61 Properties |
| 2011 | £156,037 | 2% |
77 Properties |
| 2010 | £152,665 | -3% |
78 Properties |
| 2009 | £156,961 | -1% |
73 Properties |
| 2008 | £157,783 | -8% |
66 Properties |
| 2007 | £169,966 | 10% |
143 Properties |
| 2006 | £153,253 | 3% |
190 Properties |
| 2005 | £149,204 | 3% |
123 Properties |
| 2004 | £144,979 | 14% |
161 Properties |
| 2003 | £125,024 | 20% |
152 Properties |
| 2002 | £99,863 | 4% |
156 Properties |
| 2001 | £95,640 | 19% |
184 Properties |
| 2000 | £77,254 | 11% |
211 Properties |
| 1999 | £68,488 | 4% |
223 Properties |
| 1998 | £65,448 | 4% |
184 Properties |
| 1997 | £63,026 | 7% |
184 Properties |
| 1996 | £58,440 | 4% |
160 Properties |
| 1995 | £56,088 | - |
141 Properties |
Property Price per Property Type in Amblecote
Here you can find historic sold price data in order to help with your property search.
The average Property Paid Price for specific property types in the last three years are:
| Property Type | Average Sold Price | Sold Properties |
|---|---|---|
| Semi Detached House | £227,360.00 | 98 Semi Detached Houses |
| Detached House | £342,147.00 | 71 Detached Houses |
| Terraced House | £214,176.00 | 34 Terraced Houses |
| Flat | £119,592.00 | 18 Flats |

