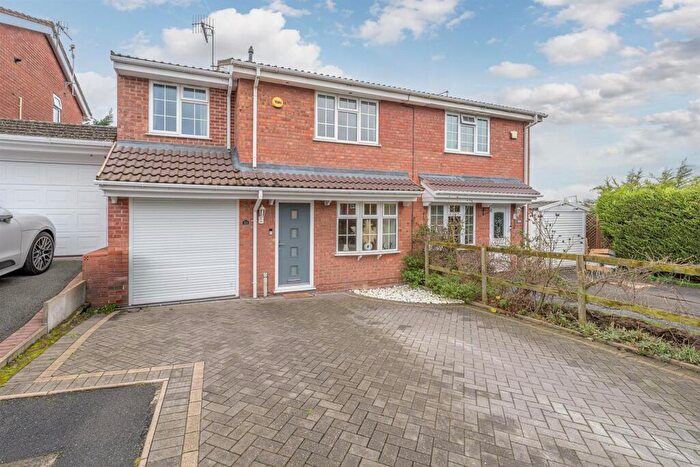
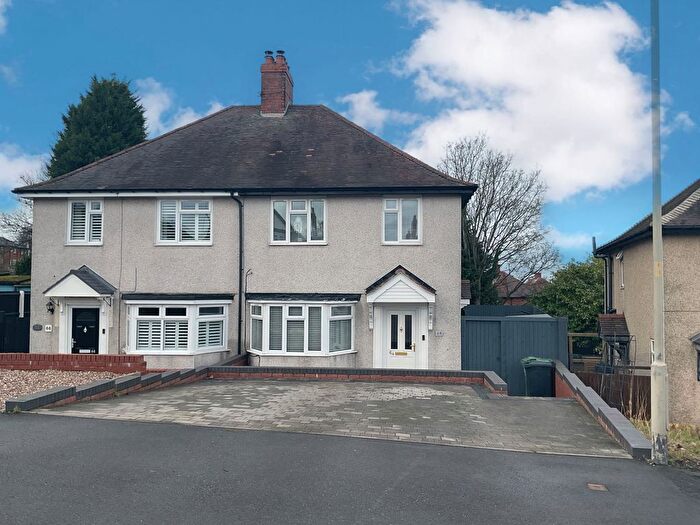
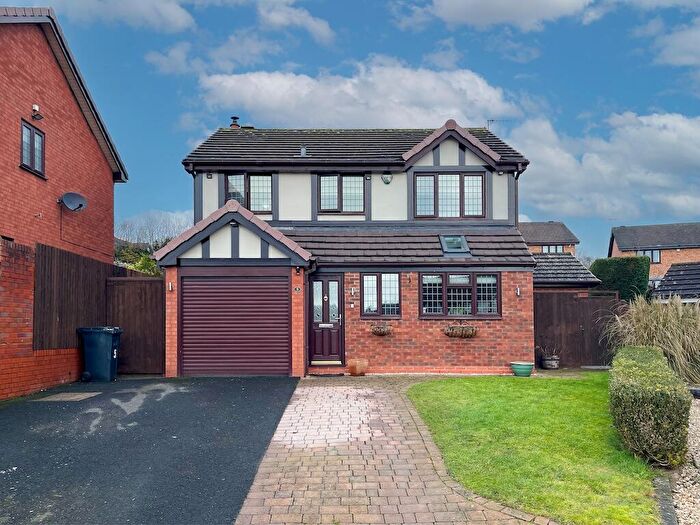
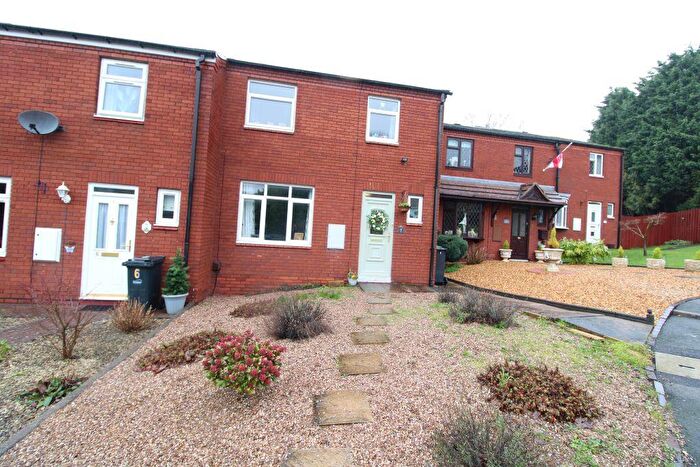
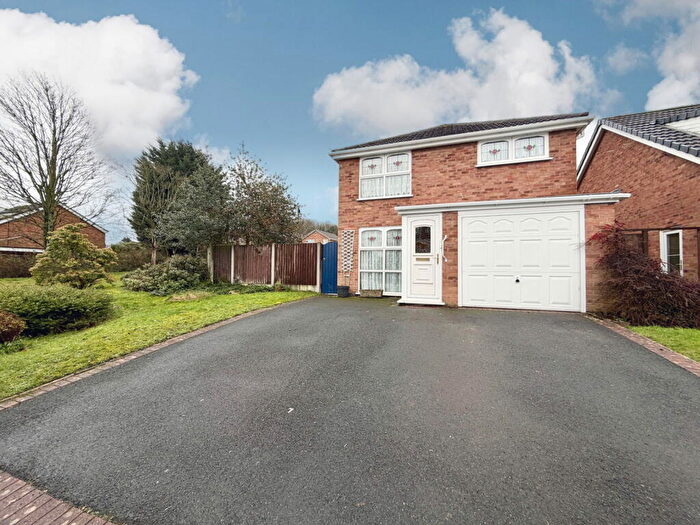
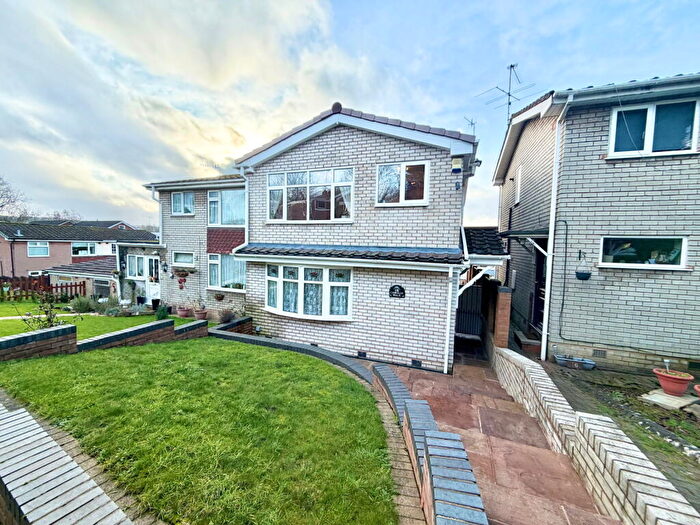
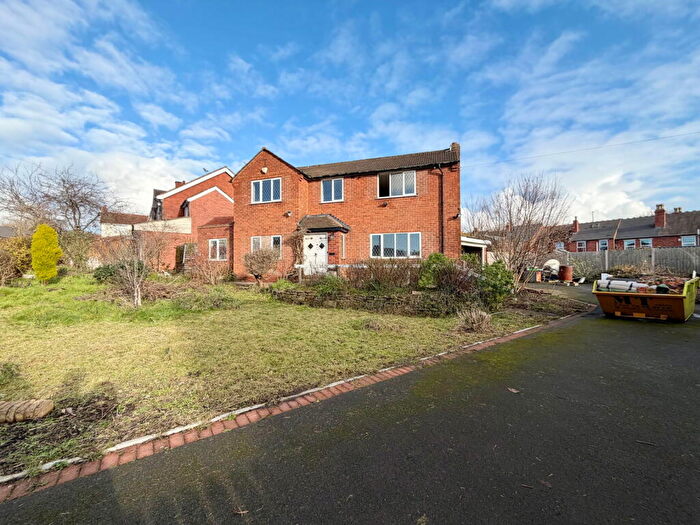
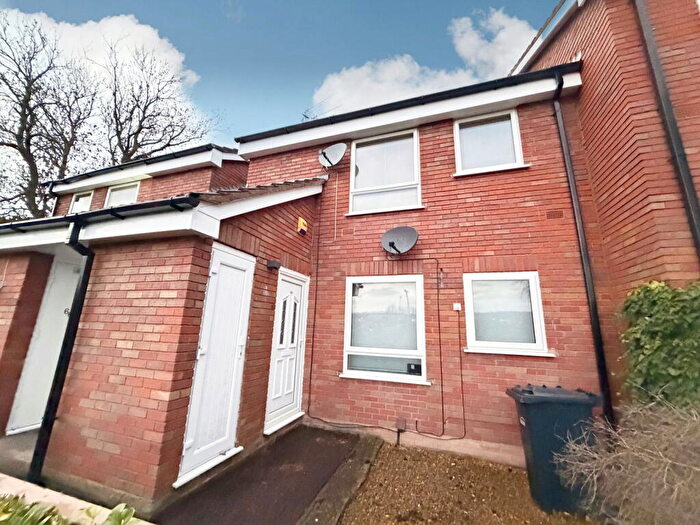
Houses for sale & to rent in Lye And Stourbridge North, Brierley Hill
House Prices in Lye And Stourbridge North
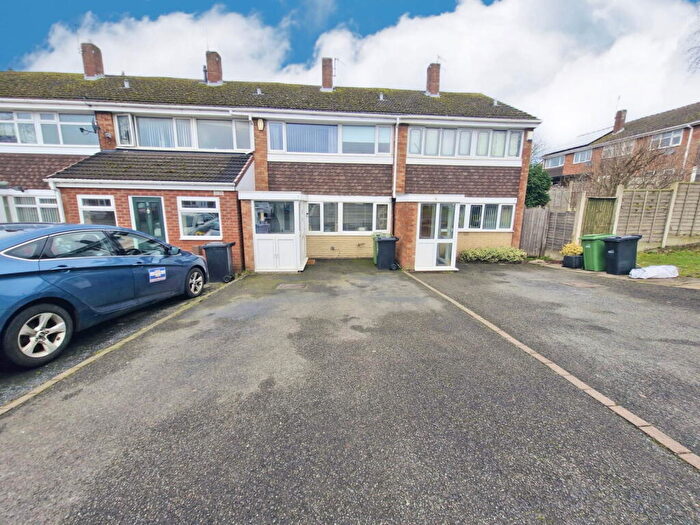
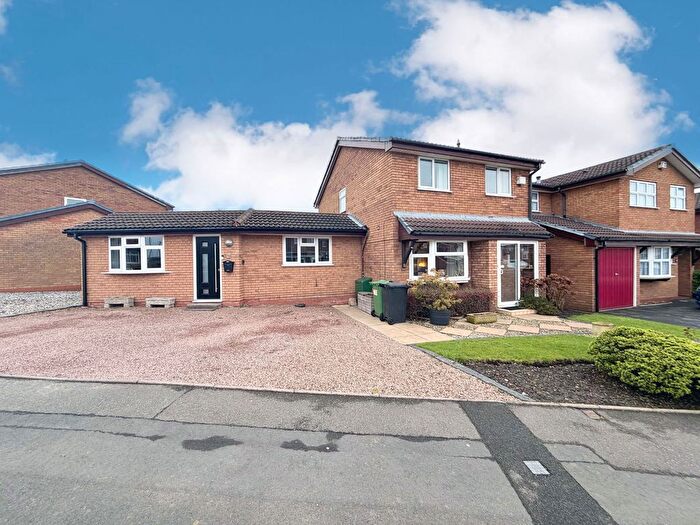
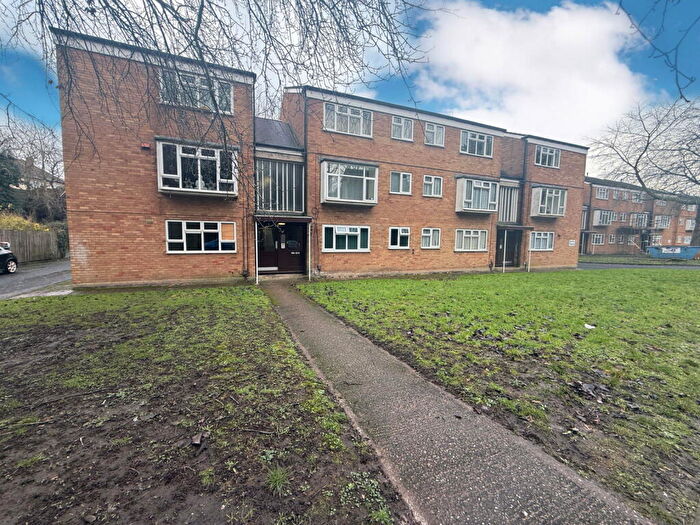
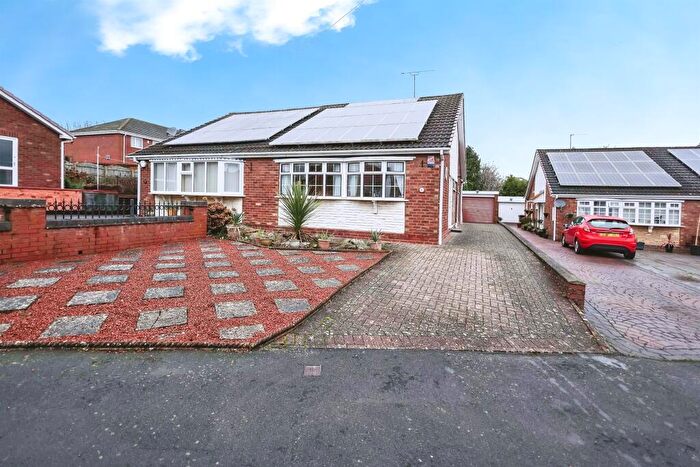
Properties in Lye And Stourbridge North have an average house price of £215,487.00 and had 149 Property Transactions within the last 3 years¹.
Lye And Stourbridge North is an area in Brierley Hill, Dudley with 1,819 households², where the most expensive property was sold for £499,950.00.
Properties for sale in Lye And Stourbridge North
Roads and Postcodes in Lye And Stourbridge North
Navigate through our locations to find the location of your next house in Lye And Stourbridge North, Brierley Hill for sale or to rent.
| Streets | Postcodes |
|---|---|
| Acres Road | DY5 2YA |
| Amblecote Road | DY5 2PR DY5 2YD |
| Ardingley Walk | DY5 2NY |
| Astons Close | DY5 2QT |
| Astons Fold | DY5 2QR |
| Bagleys Road | DY5 2PL |
| Barnowl Walk | DY5 2QW |
| Beaumont Drive | DY5 2RT |
| Bisell Way | DY5 2RY DY5 2RZ |
| Bittern Walk | DY5 2PX DY5 2QB |
| Blithfield Drive | DY5 2NX |
| Brambling Walk | DY5 2QA |
| Brandon Way | DY5 2JX |
| Broomehill Close | DY5 2PE |
| Caledonia | DY5 2LE DY5 2LF DY5 2LX |
| Calewood Road | DY5 2ND DY5 2NE DY5 2NQ |
| Callcott Drive | DY5 2NF |
| Cowslip Walk | DY5 2QN |
| Delph Drive | DY5 2LQ |
| Ellerslie Close | DY5 2NN |
| Farndale Close | DY5 2RU |
| Fennel Road | DY5 2PU |
| Fitzgerald Place | DY5 2SZ |
| Glenwood Close | DY5 2NW |
| Gratham Close | DY5 2NZ |
| Grosvenor Way | DY5 2LG DY5 2LH DY5 2LJ DY5 2LL |
| Hern Road | DY5 2PN DY5 2PW |
| Hordern Crescent | DY5 2NP DY5 2NR |
| Kittiwake Drive | DY5 2QJ DY5 2QX |
| Lindale Crescent | DY5 2RL |
| Mallard Close | DY5 2RE |
| Martindale Walk | DY5 2RX |
| Mears Coppice | DY5 2PH |
| Morton Road | DY5 2NH |
| Mousehall Farm Road | DY5 2LR DY5 2LS DY5 2LT DY5 2LU DY5 2NJ |
| Nightingale Crescent | DY5 2QL |
| Nuthatch Drive | DY5 2RF |
| Peters Hill Road | DY5 2QH |
| Rodway Close | DY5 2NA DY5 2NB |
| Shearwater Drive | DY5 2RD |
| Sorrel Walk | DY5 2QG DY5 2QQ |
| Southview Ridge | DY5 2BJ |
| Speedwell Gardens | DY5 2TU |
| Stamford Road | DY5 2PT DY5 2PY DY5 2PZ DY5 2QD DY5 2QE DY5 2QF |
| Stockwell Avenue | DY5 2NL DY5 2NS DY5 2NT DY5 2NU |
| Stourvalley Close | DY5 2JD |
| Stow Drive | DY5 2SL |
| Thorns Road | DY5 2JY DY5 2LD |
| Turner Drive | DY5 2LP |
| Walker Avenue | DY5 2LY DY5 2LZ |
| Waterfall Road | DY5 2QP |
| Winding Mill North | DY5 2LN |
| Winding Mill South | DY5 2LW |
| Woods Lane | DY5 2QS DY5 2QU DY5 2QY DY5 2QZ DY5 2RA DY5 2RB |
Transport near Lye And Stourbridge North
-
Lye Station
-
Stourbridge Town Station
-
Stourbridge Junction Station
-
Cradley Heath Station
-
Old Hill Station
- FAQ
- Price Paid By Year
- Property Type Price
Frequently asked questions about Lye And Stourbridge North
What is the average price for a property for sale in Lye And Stourbridge North?
The average price for a property for sale in Lye And Stourbridge North is £215,487. This amount is 10% higher than the average price in Brierley Hill. There are 1,110 property listings for sale in Lye And Stourbridge North.
What streets have the most expensive properties for sale in Lye And Stourbridge North?
The streets with the most expensive properties for sale in Lye And Stourbridge North are Mears Coppice at an average of £499,950, Gratham Close at an average of £375,000 and Stow Drive at an average of £325,000.
What streets have the most affordable properties for sale in Lye And Stourbridge North?
The streets with the most affordable properties for sale in Lye And Stourbridge North are Bagleys Road at an average of £84,666, Bisell Way at an average of £121,136 and Turner Drive at an average of £144,875.
Which train stations are available in or near Lye And Stourbridge North?
Some of the train stations available in or near Lye And Stourbridge North are Lye, Stourbridge Town and Stourbridge Junction.
Property Price Paid in Lye And Stourbridge North by Year
The average sold property price by year was:
| Year | Average Sold Price | Price Change |
Sold Properties
|
|---|---|---|---|
| 2025 | £220,739 | -0,5% |
46 Properties |
| 2024 | £221,837 | 8% |
51 Properties |
| 2023 | £204,614 | 1% |
52 Properties |
| 2022 | £202,165 | -1% |
57 Properties |
| 2021 | £203,313 | -1% |
64 Properties |
| 2020 | £205,341 | 17% |
54 Properties |
| 2019 | £169,988 | 3% |
65 Properties |
| 2018 | £164,810 | 4% |
64 Properties |
| 2017 | £158,389 | 3% |
55 Properties |
| 2016 | £154,040 | 5% |
66 Properties |
| 2015 | £146,562 | 4% |
56 Properties |
| 2014 | £140,528 | 10% |
65 Properties |
| 2013 | £125,816 | 6% |
51 Properties |
| 2012 | £117,822 | -4% |
39 Properties |
| 2011 | £122,118 | -13% |
34 Properties |
| 2010 | £138,603 | 14% |
33 Properties |
| 2009 | £118,950 | -13% |
27 Properties |
| 2008 | £133,867 | -1% |
48 Properties |
| 2007 | £135,058 | 5% |
79 Properties |
| 2006 | £128,044 | 4% |
108 Properties |
| 2005 | £122,584 | 7% |
80 Properties |
| 2004 | £114,451 | 18% |
92 Properties |
| 2003 | £93,783 | 19% |
91 Properties |
| 2002 | £76,017 | 3% |
105 Properties |
| 2001 | £73,454 | 16% |
99 Properties |
| 2000 | £61,928 | 3% |
107 Properties |
| 1999 | £60,335 | 21% |
83 Properties |
| 1998 | £47,526 | -2% |
84 Properties |
| 1997 | £48,249 | 2% |
114 Properties |
| 1996 | £47,295 | 11% |
102 Properties |
| 1995 | £42,232 | - |
76 Properties |
Property Price per Property Type in Lye And Stourbridge North
Here you can find historic sold price data in order to help with your property search.
The average Property Paid Price for specific property types in the last three years are:
| Property Type | Average Sold Price | Sold Properties |
|---|---|---|
| Semi Detached House | £217,043.00 | 63 Semi Detached Houses |
| Detached House | £288,048.00 | 39 Detached Houses |
| Terraced House | £166,527.00 | 36 Terraced Houses |
| Flat | £109,545.00 | 11 Flats |

