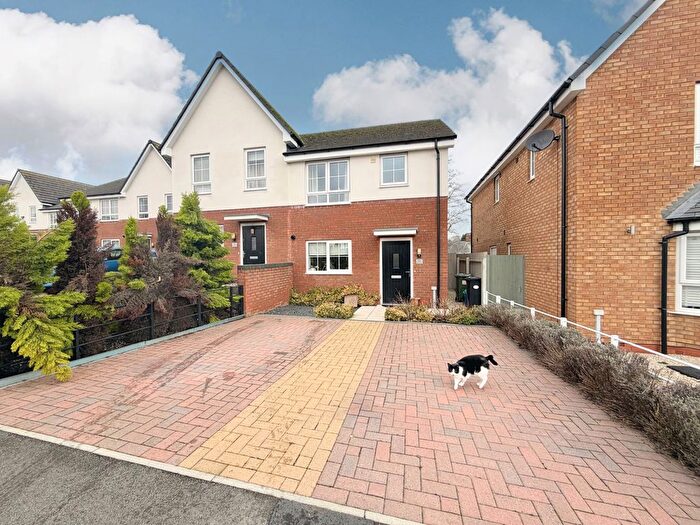
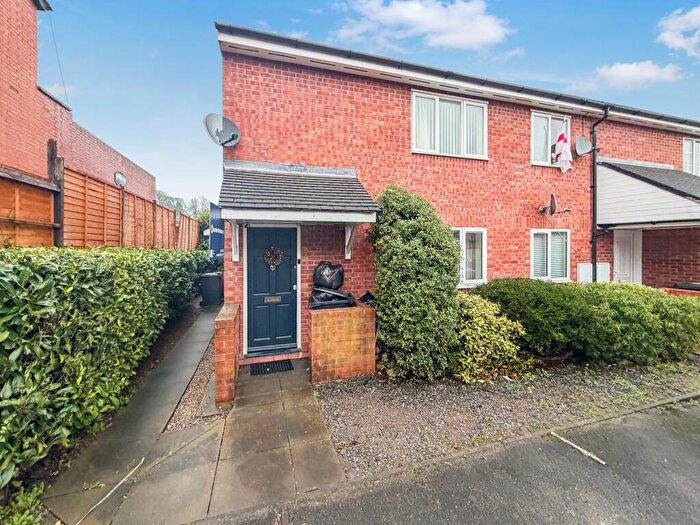
Houses for sale & to rent in Netherton, Woodside And St Andrews, Dudley
House Prices in Netherton, Woodside And St Andrews
Properties in Netherton, Woodside And St Andrews have an average house price of £177,905.00 and had 343 Property Transactions within the last 3 years¹.
Netherton, Woodside And St Andrews is an area in Dudley, Dudley with 5,777 households², where the most expensive property was sold for £395,000.00.
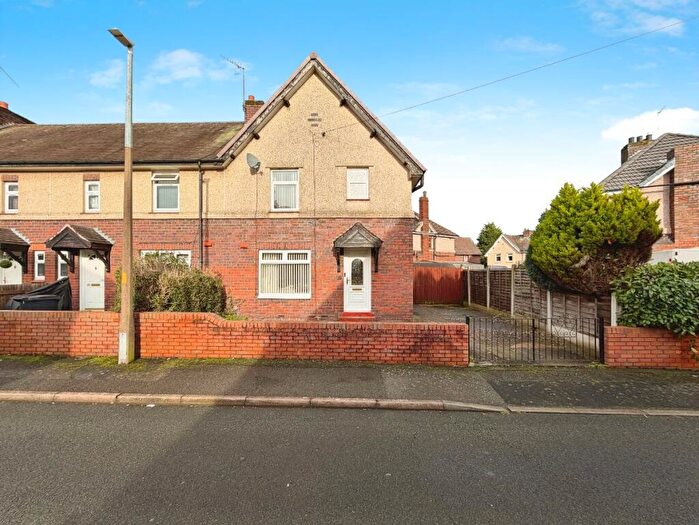
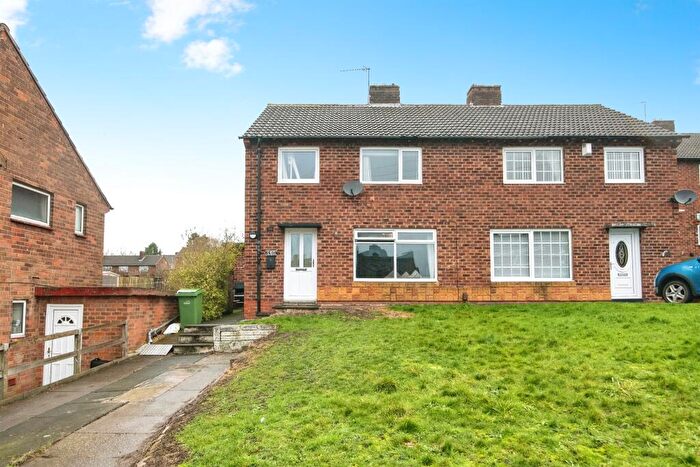
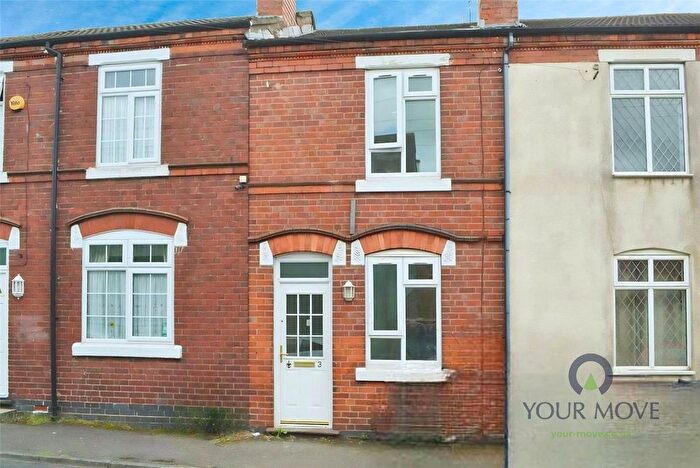
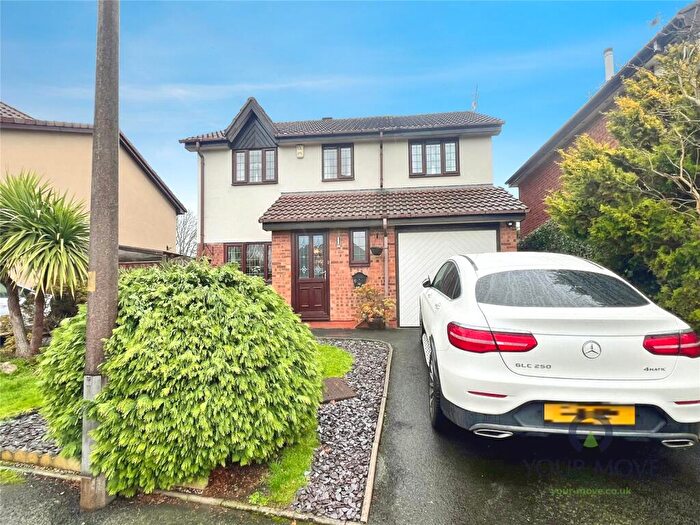
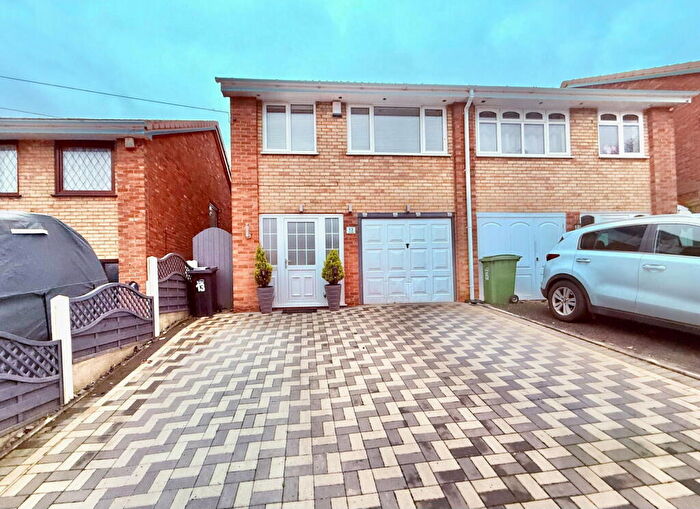
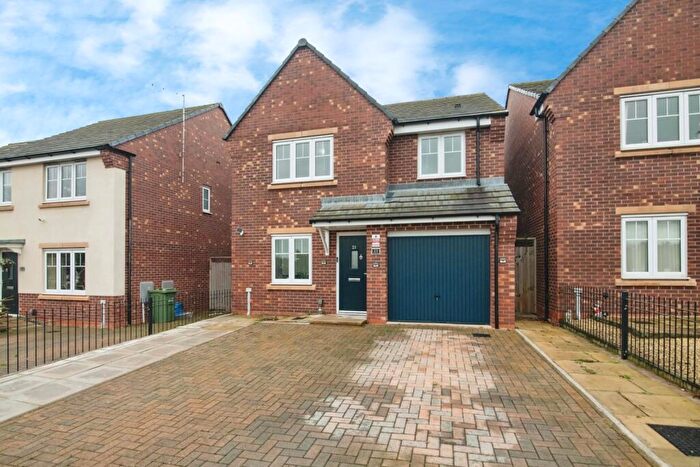
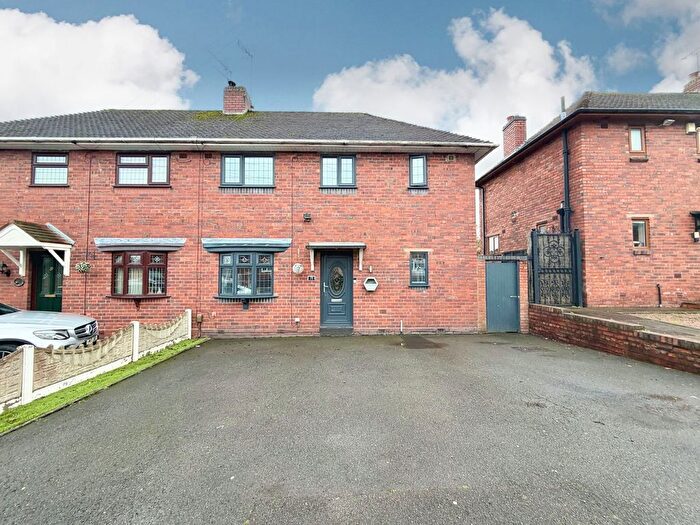
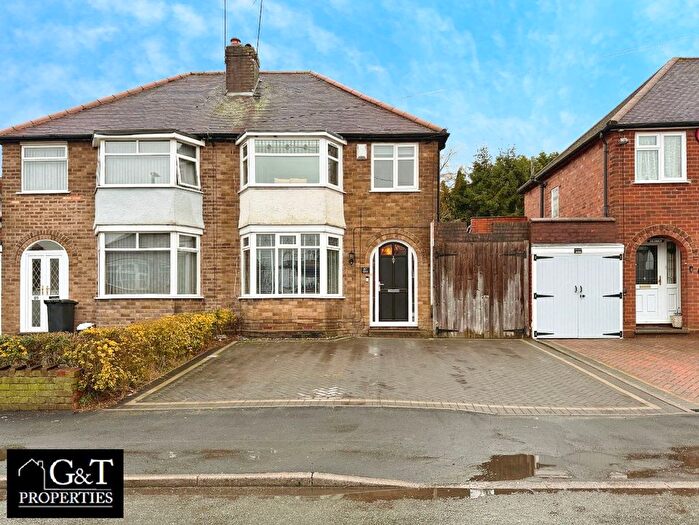
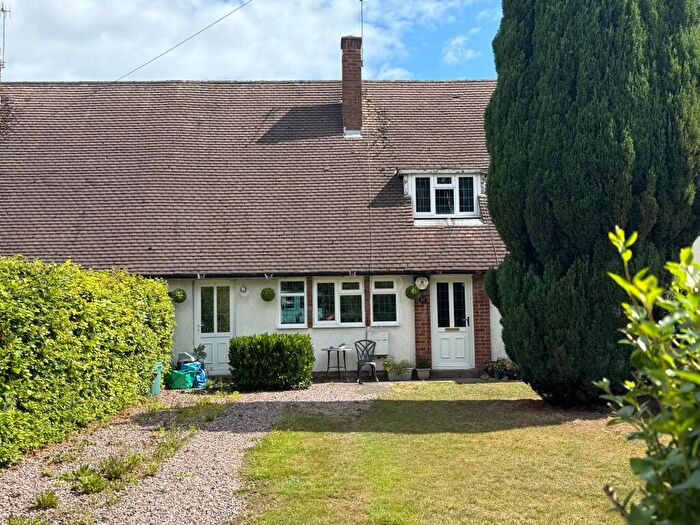
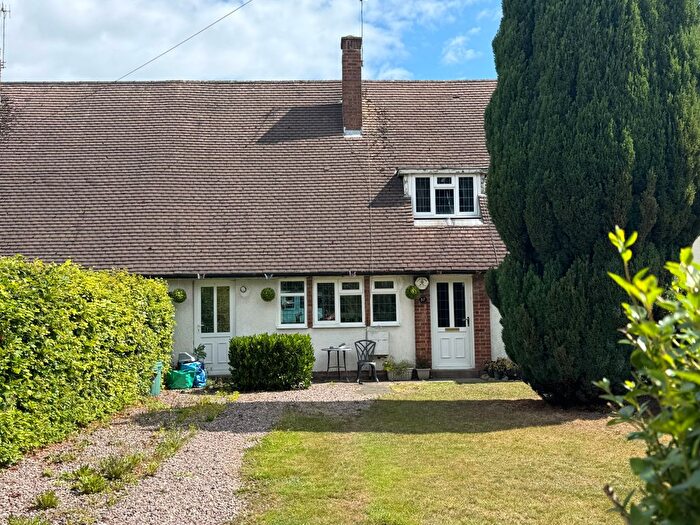
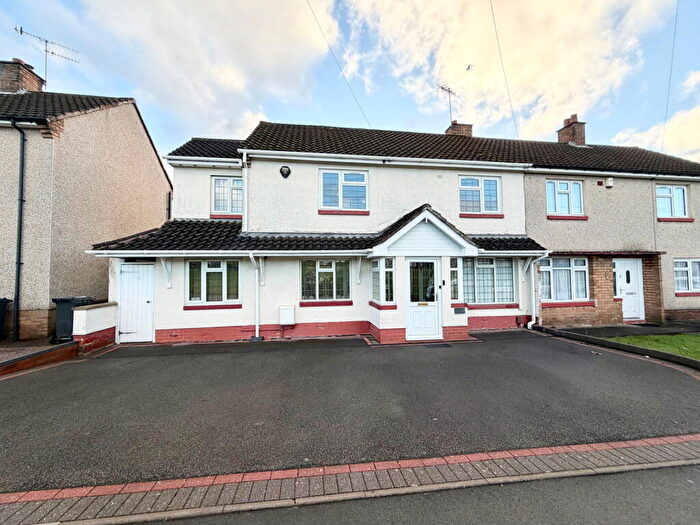
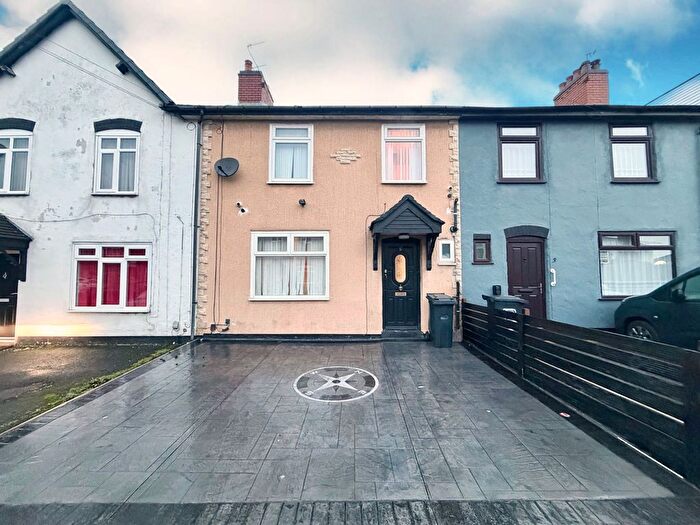
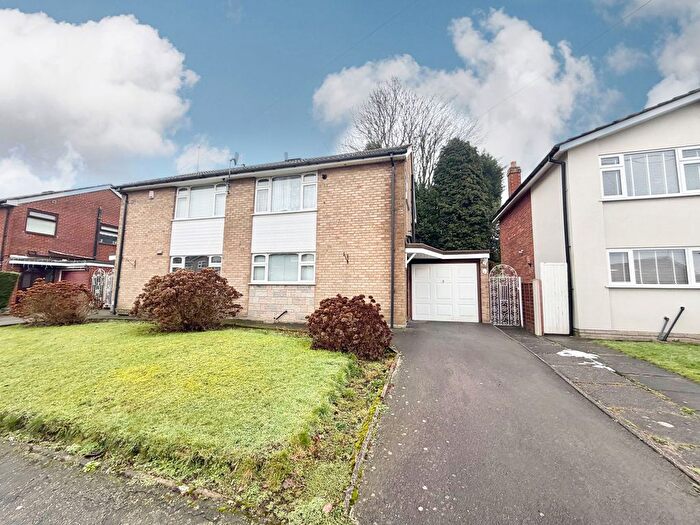
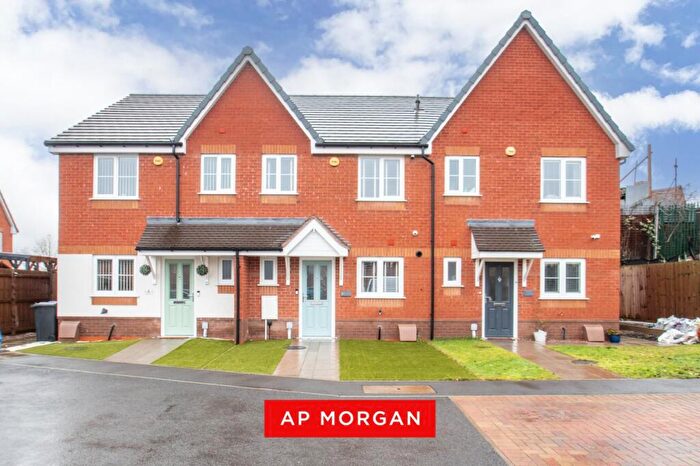
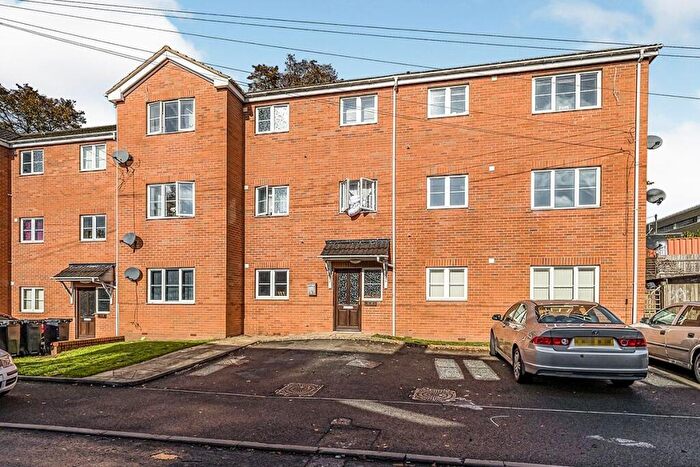
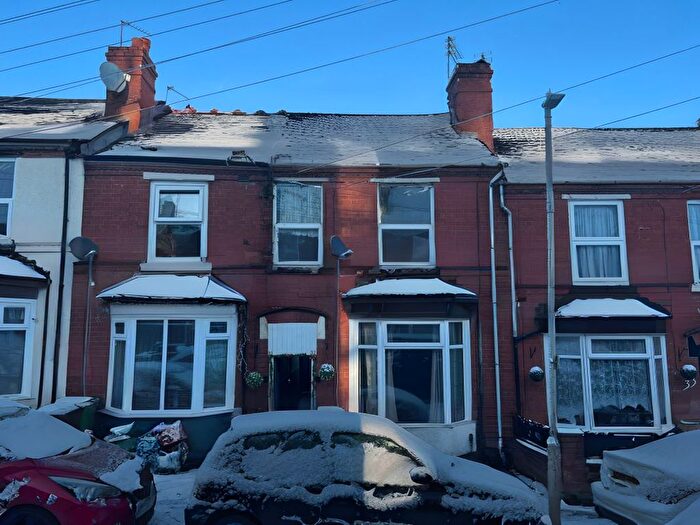
Properties for sale in Netherton, Woodside And St Andrews
Roads and Postcodes in Netherton, Woodside And St Andrews
Navigate through our locations to find the location of your next house in Netherton, Woodside And St Andrews, Dudley for sale or to rent.
| Streets | Postcodes |
|---|---|
| Alpine Drive | DY2 0JH |
| Arch Hill Street | DY2 9QE |
| Avenue Road | DY2 0SL |
| Awbridge Road | DY2 0HZ DY2 0JA |
| Bagley Industrial Park | DY2 9DY |
| Ballard Crescent | DY2 9EZ |
| Ballard Road | DY2 9EY |
| Bank Road | DY2 9DQ |
| Baptist End Road | DY2 9BU DY2 9DH DY2 9DJ DY2 9DL DY2 9BX DY2 9DE DY2 9DF |
| Bell Road | DY2 0NH |
| Belper Row | DY2 9LP |
| Birch Terrace | DY2 0LJ |
| Bishton Grove | DY2 9PP |
| Blackbrook Close | DY2 0HD |
| Blackbrook Road | DY2 0NR DY2 0NT DY2 0QP DY2 0AF DY2 0NG DY2 0RT |
| Blackbrook Valley Industrial Estate | DY2 0EZ DY2 0XQ |
| Blakeley Walk | DY2 0HY |
| Bobbington Way | DY2 9JH |
| Boss Drive | DY2 8SZ |
| Bourne Hill Close | DY2 9PB |
| Bournebrook Close | DY2 0PG |
| Bradford Road | DY2 0SH DY2 0SJ |
| Bratch Close | DY2 0JB DY2 0JD |
| Brewster Street | DY2 0PH |
| Bromford Road | DY2 0TX |
| Buxton Road | DY2 0SR DY2 0ST DY2 0TR DY2 0TS |
| Cambridge Road | DY2 0UL |
| Castleton Street | DY2 0LU DY2 0LX |
| Central Park | DY2 9NW |
| Chapel Street | DY2 9PN |
| Chichester Avenue | DY2 9JJ DY2 9JL |
| Church Road | DY2 0JJ DY2 0LY DY2 0LZ |
| Cinder Bank | DY2 9AL DY2 9BB DY2 9BG DY2 9BH DY2 9BP DY2 9BW DY2 9AD DY2 9AE DY2 9AP DY2 9BL |
| Clee Road | DY2 0XU DY2 0YG |
| Cochrane Road | DY2 0RU DY2 0RX DY2 0SF |
| Cole Street | DY2 9PA |
| Cosford Drive | DY2 9JN |
| Crackley Way | DY2 0UW |
| Cradley Road | DY2 9RA DY2 9RB DY2 9RD |
| Crescent Industrial Park | DY2 0QQ |
| Crescent Road | DY2 0NW |
| Crossgate Road | DY2 0SY |
| Crossley Street | DY2 9PX |
| Darby End Road | DY2 9JP DY2 9JR DY2 9JS |
| Devon Crescent | DY2 0UB DY2 0UD |
| Double Row | DY2 9LL |
| Edwards Road | DY2 0LE |
| Essex Road | DY2 0TY DY2 0TZ |
| Farm Road | DY2 0HE |
| Foxhills Park | DY2 0JQ |
| Fullwood Crescent | DY2 0SG DY2 0SQ |
| Gads Green | DY2 9HL |
| Galton Drive | DY2 0XE |
| Gill Street | DY2 9LG DY2 9LQ |
| Grazebrook Industrial Park | DY2 0XW |
| Greaves Road | DY2 9EX DY2 9HA |
| Griffin Street | DY2 0LP DY2 0LR DY2 0LS DY2 0LW |
| Hadley Close | DY2 9JX |
| Halesowen Road | DY2 9PS DY2 9PU DY2 9PY DY2 9QD DY2 9QG DY2 9PJ DY2 9PL DY2 9QA |
| Hallchurch Road | DY2 0TG DY2 0TH DY2 0TQ |
| Halton Street | DY2 0PJ |
| Hampton Street | DY2 0NJ |
| Harrisons Fold | DY2 0PU |
| Harveys Terrace | DY2 9JE |
| Hereford Road | DY2 9LR |
| Highbridge Road | DY2 0HJ DY2 0HN DY2 0HT DY2 0HL DY2 0HU |
| Highgate Road | DY2 0SN DY2 0SZ DY2 0SW DY2 0TB DY2 0TD |
| Hilderic Crescent | DY1 2ET DY1 2EU |
| Hill Street | DY2 0NN DY2 0NU DY2 0NX DY2 0NZ |
| Hillcrest Close | DY2 0NQ |
| Hockley Lane | DY2 0JL DY2 0JN DY2 0JW |
| Holly Hall Road | DY2 0TP DY2 0TT DY2 0UN |
| Holly Street | DY1 2EJ |
| Hope Terrace | DY2 0ND |
| Ivanhoe Street | DY2 0YA DY2 0YB DY2 0YD |
| Kent Place | DY2 0TU |
| Kingsley Street | DY2 0PZ |
| Kingswinford Road | DY1 2ES DY1 2EX |
| Knighton Road | DY2 9JF |
| Knowle Hill Road | DY2 0HP DY2 0HW |
| Lodge Crescent | DY2 0HF DY2 0HG DY2 0HQ |
| Longboat Quay | DY2 9EW |
| Lynbrook Close | DY2 9HE DY2 9HF |
| Lyttleton Close | DY2 0JR |
| Magpie Close | DY2 9LU |
| Malvern Crescent | DY2 0RZ |
| Marita Close | DY2 9LF |
| Marl Road | DY2 0HR |
| Marriott Road | DY2 0JX DY2 0JY DY2 0JZ DY2 0LL DY2 0LN |
| Meeting Street | DY2 0LT |
| Monarch Way | DY2 0LD |
| Morville Road | DY2 9HR |
| Mousesweet Close | DY2 9JU |
| Netherton Park | DY2 9QF |
| New Road | DY2 9AY DY2 9AZ DY2 9AF DY2 9AR |
| Newick Street | DY2 0LH |
| Newland Grove | DY2 0TJ DY2 0TL DY2 0TN DY2 0TW |
| Norfolk Road | DY2 0UG |
| Northcott Road | DY2 9PR |
| Northfield Road | DY2 9ET DY2 9JA DY2 9JQ DY2 9ER DY2 9ES DY2 9JD |
| Oak Street | DY2 9LH DY2 9LJ |
| Oakwood Crescent | DY2 0RY |
| Old Level Way | DY2 9RQ |
| Ounsdale Drive | DY2 0HX |
| Park Road | DY2 9BY DY2 9BZ DY2 9DA DY2 9DD |
| Parkhead Locks | DY2 0UP |
| Peartree Lane | DY2 0QU DY2 0QY DY2 0AZ DY2 0QS DY2 0UU DY2 0UX DY2 0UY DY2 0XA DY2 0XD DY2 0XH DY2 0XP DY2 0XR |
| Pedmore Road | DY2 0RP DY2 0RH DY2 0RL |
| Pensnett Road | DY1 2EY DY1 2EZ |
| Primrose Road | DY2 0LB |
| Primrose Trading Estate | DY2 9SA |
| Prince Street | DY2 9EH |
| Purlin Wharf | DY2 9PG DY2 9PQ |
| Quayside Walk | DY2 9PT |
| Queens Gardens | DY2 0JP |
| Rayboulds Fold | DY2 0PP |
| Recreation Street | DY2 9EU |
| Round Street | DY2 9EA DY2 9EB |
| Ryan Place | DY2 9BE |
| Samuel Lewis Way | DY2 9AS |
| Simms Lane | DY2 0PD DY2 0PQ DY2 0PX DY2 0PB |
| Spring Road | DY2 9DG |
| St Andrews Street | DY2 0QB DY2 0QD |
| St Giles Street | DY2 0PR |
| St Johns Street | DY2 0PN DY2 0PW DY2 0PY DY2 0RA |
| St Pauls Road | DY2 9HD |
| St Peters Road | DY2 9HG DY2 9HH DY2 9HN DY2 9HQ DY2 9HW DY2 9HX |
| St Thomas Street | DY2 0PL |
| Stanhope Street | DY2 9LB |
| Stourbridge Road | DY1 2DH DY1 2DQ DY1 2EF DY1 2EG DY1 2EL DY1 2EP DY1 2EQ DY1 2ER |
| Stretton Place | DY2 9JW |
| Suffolk Road | DY2 0UH DY2 0UJ |
| Surrey Road | DY2 0UQ |
| Swan Street | DY2 9EG DY2 9EQ DY2 9EE DY2 9EF |
| Talbot Road | DY2 0HS |
| The Croft | DY2 0SU |
| The Sling | DY2 9AJ |
| The Willows | DY2 9HB |
| Thistlegreen Road | DY2 9JT |
| Thornleigh Trading Estate | DY2 8UB |
| Trysull Way | DY2 0JG |
| Upton Street | DY2 0PE DY2 0PF |
| Vale Road | DY2 9HY DY2 9HZ |
| Walker Street | DY2 0JS DY2 0JT |
| Warwick Road | DY2 9LT |
| Washington Centre | DY2 9RE |
| Washington Street Industrial Estate | DY2 9PH |
| Waterside Estate | DY2 9RG |
| Waverley Street | DY2 0YE |
| Wharf Mews | DY2 9LD |
| Windmill End | DY2 9HS DY2 9HU DY2 9HT |
| Withymoor Road | DY2 9JY DY2 9JZ DY2 9LA |
| Wood Street | DY2 0SP |
| Woodside Road | DY2 0UA DY2 0UE DY2 0UF |
| Worcester Road | DY2 9LN DY2 9LW |
| Wren Street | DY2 0NP |
| Yew Tree Hills | DY2 0JE DY2 0JF DY2 0JU |
| Yew Tree Road | DY2 0LF DY2 0LG |
| York Road | DY2 9LS |
Transport near Netherton, Woodside And St Andrews
-
Cradley Heath Station
-
Old Hill Station
-
Lye Station
-
Rowley Regis Station
-
Dudley Port Station
-
Tipton Station
- FAQ
- Price Paid By Year
- Property Type Price
Frequently asked questions about Netherton, Woodside And St Andrews
What is the average price for a property for sale in Netherton, Woodside And St Andrews?
The average price for a property for sale in Netherton, Woodside And St Andrews is £177,905. This amount is 15% lower than the average price in Dudley. There are 4,098 property listings for sale in Netherton, Woodside And St Andrews.
What streets have the most expensive properties for sale in Netherton, Woodside And St Andrews?
The streets with the most expensive properties for sale in Netherton, Woodside And St Andrews are Monarch Way at an average of £395,000, Alpine Drive at an average of £283,237 and Hockley Lane at an average of £265,600.
What streets have the most affordable properties for sale in Netherton, Woodside And St Andrews?
The streets with the most affordable properties for sale in Netherton, Woodside And St Andrews are Bourne Hill Close at an average of £100,000, Meeting Street at an average of £106,000 and Belper Row at an average of £112,875.
Which train stations are available in or near Netherton, Woodside And St Andrews?
Some of the train stations available in or near Netherton, Woodside And St Andrews are Cradley Heath, Old Hill and Lye.
Property Price Paid in Netherton, Woodside And St Andrews by Year
The average sold property price by year was:
| Year | Average Sold Price | Price Change |
Sold Properties
|
|---|---|---|---|
| 2025 | £189,061 | 8% |
85 Properties |
| 2024 | £173,496 | -1% |
142 Properties |
| 2023 | £175,128 | 4% |
116 Properties |
| 2022 | £167,727 | 9% |
182 Properties |
| 2021 | £152,558 | 8% |
184 Properties |
| 2020 | £140,403 | 11% |
122 Properties |
| 2019 | £124,360 | 5% |
172 Properties |
| 2018 | £118,631 | -2% |
150 Properties |
| 2017 | £120,723 | -1% |
144 Properties |
| 2016 | £122,442 | 9% |
179 Properties |
| 2015 | £110,913 | 1% |
135 Properties |
| 2014 | £109,557 | 3% |
138 Properties |
| 2013 | £105,904 | 10% |
120 Properties |
| 2012 | £95,412 | -0,1% |
73 Properties |
| 2011 | £95,527 | -13% |
124 Properties |
| 2010 | £107,899 | 5% |
134 Properties |
| 2009 | £103,020 | -11% |
109 Properties |
| 2008 | £114,059 | 0,2% |
153 Properties |
| 2007 | £113,884 | 9% |
211 Properties |
| 2006 | £103,161 | 6% |
232 Properties |
| 2005 | £96,894 | -5% |
192 Properties |
| 2004 | £101,807 | 27% |
202 Properties |
| 2003 | £74,364 | 21% |
180 Properties |
| 2002 | £58,382 | 15% |
216 Properties |
| 2001 | £49,793 | 11% |
214 Properties |
| 2000 | £44,318 | 3% |
171 Properties |
| 1999 | £43,120 | 0,4% |
151 Properties |
| 1998 | £42,933 | 2% |
122 Properties |
| 1997 | £41,900 | 3% |
138 Properties |
| 1996 | £40,756 | 2% |
132 Properties |
| 1995 | £40,011 | - |
101 Properties |
Property Price per Property Type in Netherton, Woodside And St Andrews
Here you can find historic sold price data in order to help with your property search.
The average Property Paid Price for specific property types in the last three years are:
| Property Type | Average Sold Price | Sold Properties |
|---|---|---|
| Flat | £123,967.00 | 32 Flats |
| Semi Detached House | £199,278.00 | 121 Semi Detached Houses |
| Detached House | £246,342.00 | 38 Detached Houses |
| Terraced House | £155,139.00 | 152 Terraced Houses |

