
Houses for sale in Stourbridge, Dudley
House Prices in Stourbridge
Properties in Stourbridge have an average house price of £280k and had 2,686 Property Transactions within the last 3 years.¹
Stourbridge is an area in Dudley with 31,351 households², where the most expensive property was sold for £2.3M.
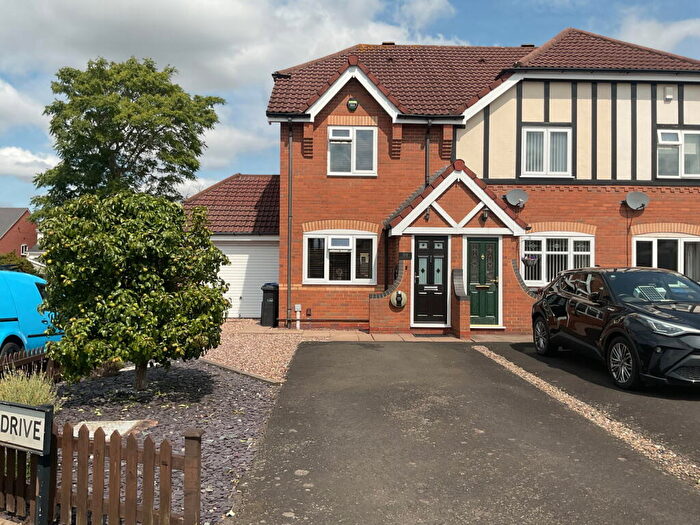
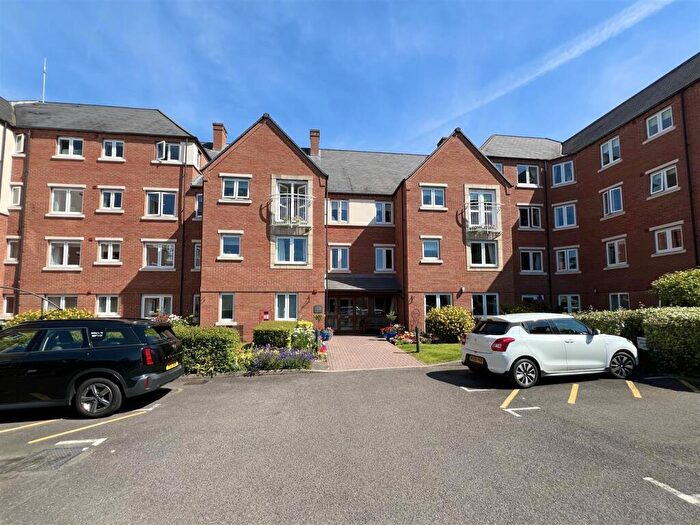
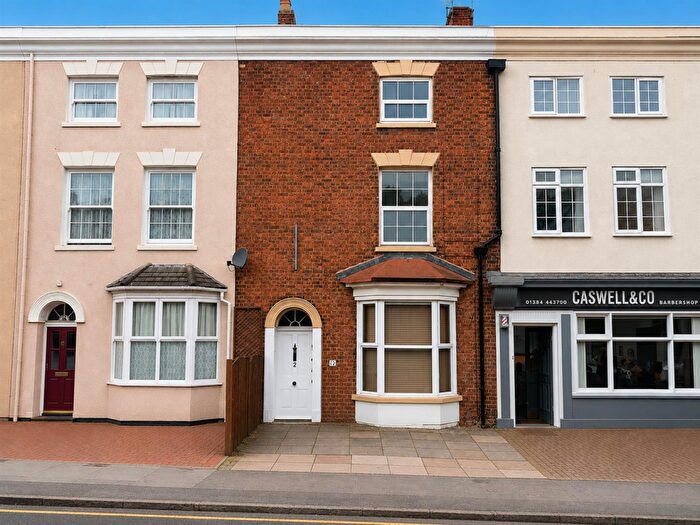
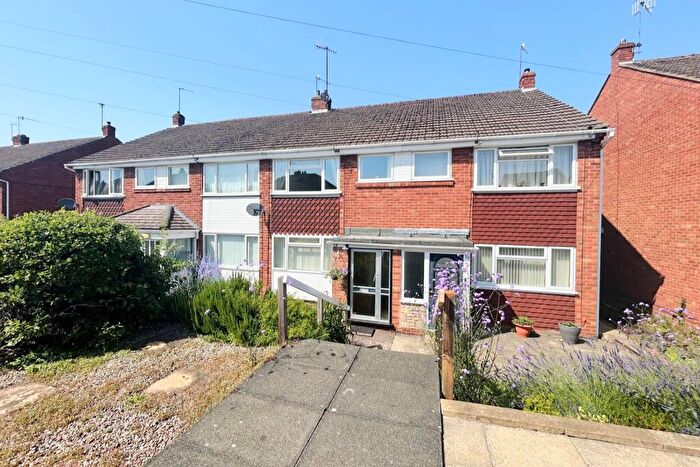
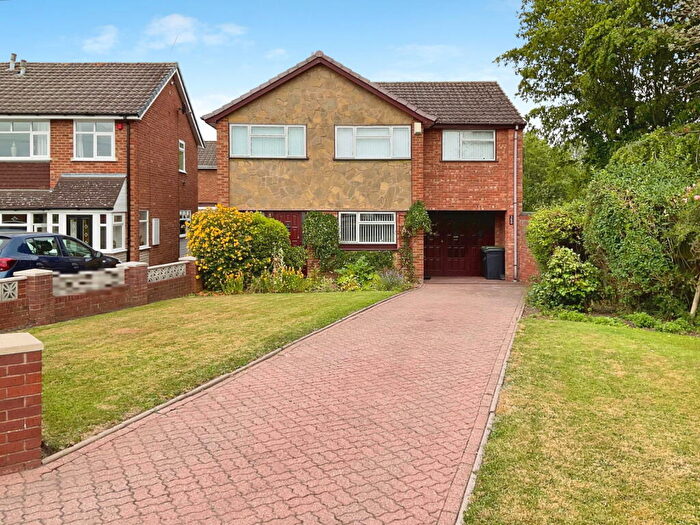
Properties for sale in Stourbridge
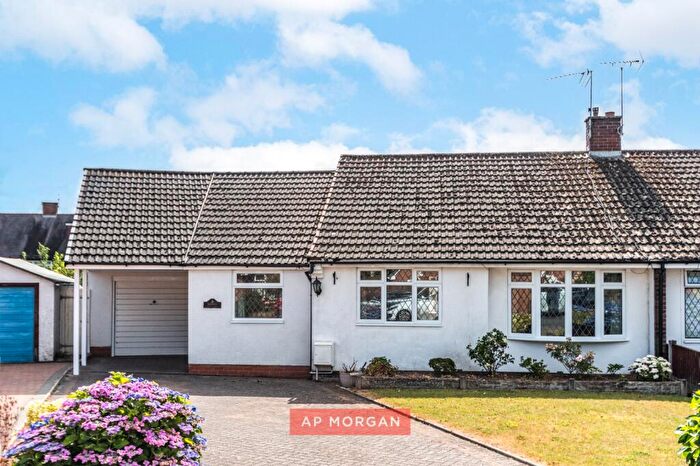
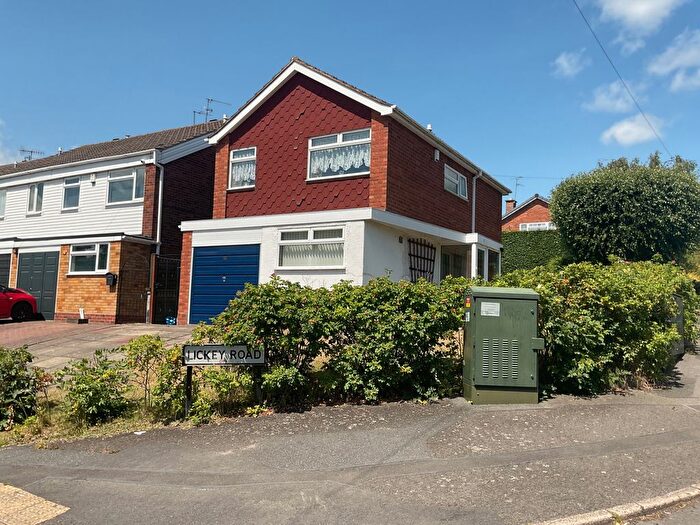
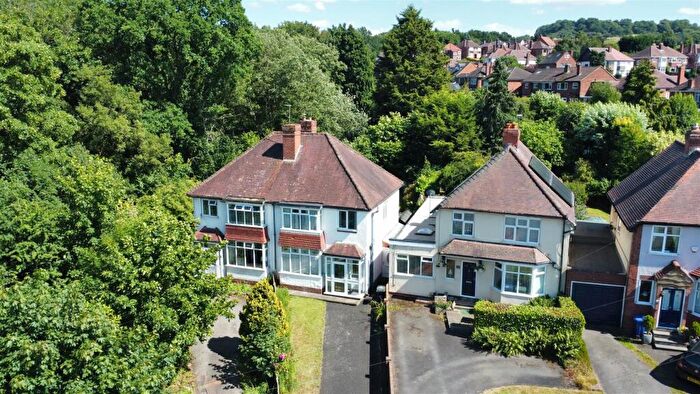
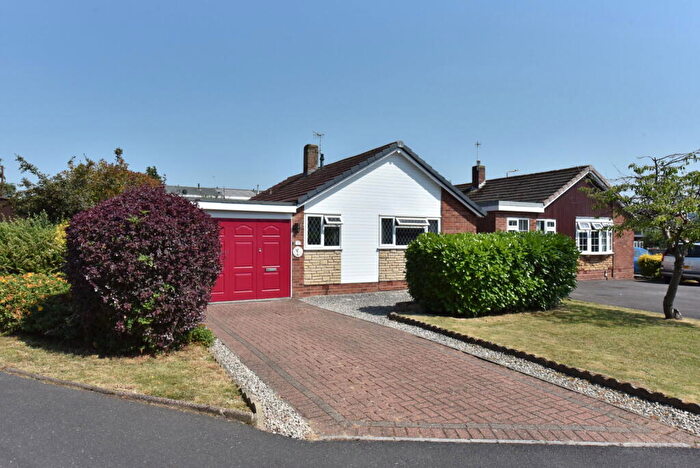
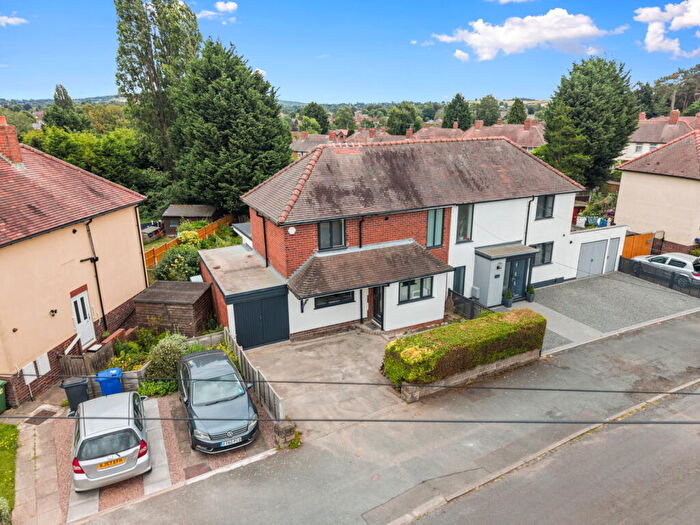
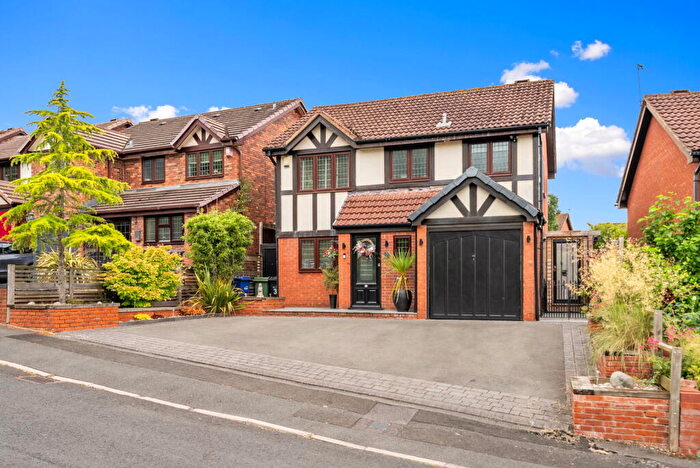
![]()
If you are looking to sell your house, let it out, or receive a property valuation, an expert can help you.
Click the button below to get started.
Neighbourhoods in Stourbridge
Navigate through our locations to find the location of your next house in Stourbridge, Dudley for sale or to rent.
Property price trends in Stourbridge
According to the latest Land Registry data, the average home in Stourbridge sold for £268,028 in 2026. That figure comes from a substantial record of 34,306 sales logged over the past 31 years.
Prices have softened over the last three years. Compared with 2023, when the typical sale came in around £273,372, that's a fall of roughly 2%.
Looking back five years, average prices are up about 4% since 2021, a gain of around £10,320 in cash terms.
Zoom out to the past decade for the fuller picture. Back in 2016, homes here averaged £200,931, so the typical sold price has climbed about 33.4% since then, roughly 2.9% a year. Stretch the view to fifteen years and that annual pace holds at about 2.8%.
Frequently asked questions about Stourbridge
What is the average price for a property for sale in Stourbridge?
The average price for a property for sale in Stourbridge is £279,630. This amount is 17% higher than the average price in Dudley. There are 9,888 property listings for sale in Stourbridge.
What locations have the most expensive properties for sale in Stourbridge?
The locations with the most expensive properties for sale in Stourbridge are Norton at an average of £391,504, Pedmore And Stourbridge East at an average of £356,205 and Kingswinford South at an average of £313,900.
What locations have the most affordable properties for sale in Stourbridge?
The locations with the most affordable properties for sale in Stourbridge are Lye And Stourbridge North at an average of £191,106, Amblecote at an average of £198,744 and Cradley And Wollescote at an average of £209,583.
Which train stations are available in or near Stourbridge?
Some of the train stations available in or near Stourbridge are Stourbridge Town, Stourbridge Junction and Lye.
Property Price Paid in Stourbridge by Year
The average sold property price by year was:
| Year | Average Sold Price | Price Change |
Sold Properties
|
|---|---|---|---|
| 2026 | £268,028 | -6% |
61 Properties |
| 2025 | £282,804 | -0,1% |
845 Properties |
| 2024 | £283,090 | 3% |
943 Properties |
| 2023 | £273,372 | 4% |
837 Properties |
| 2022 | £262,618 | 2% |
1,058 Properties |
| 2021 | £257,708 | 8% |
1,367 Properties |
| 2020 | £236,150 | 6% |
966 Properties |
| 2019 | £221,318 | 5% |
1,178 Properties |
| 2018 | £209,304 | 1% |
1,140 Properties |
| 2017 | £207,648 | 3% |
1,162 Properties |
Property Price per Property Type in Stourbridge
Here you can find historic sold price data in order to help with your property search.
The average Property Paid Price for specific property types in the last three years are:
| Property Type | Average Sold Price | Sold Properties |
|---|---|---|
| Semi Detached House | £260,436.00 | 1,135 Semi Detached Houses |
| Terraced House | £217,913.00 | 609 Terraced Houses |
| Detached House | £452,286.00 | 614 Detached Houses |
| Flat | £137,432.00 | 328 Flats |
Transport in Stourbridge
Please see below transportation links in this area:
