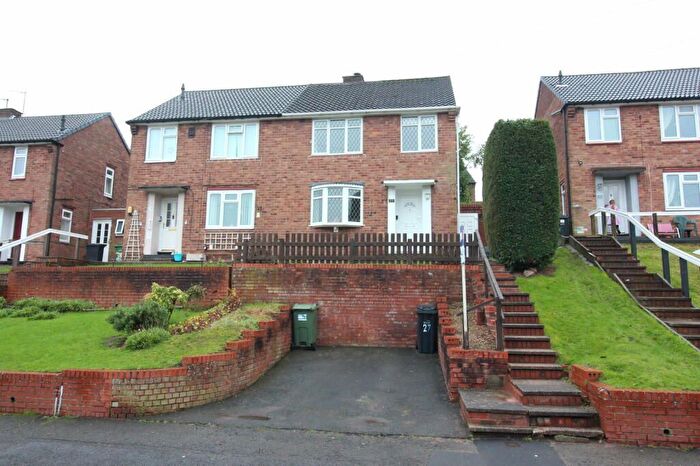
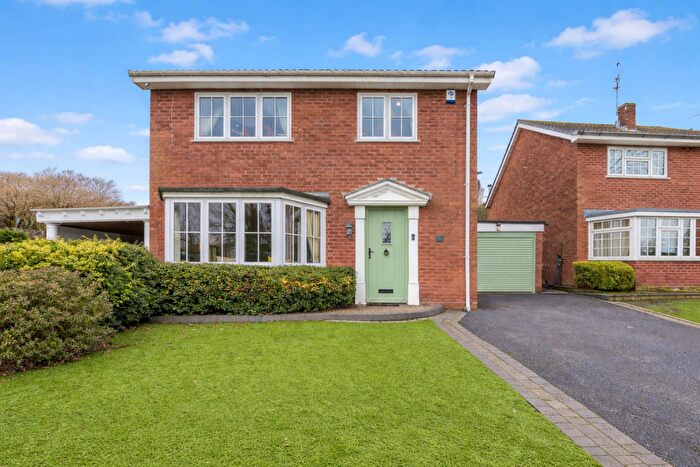
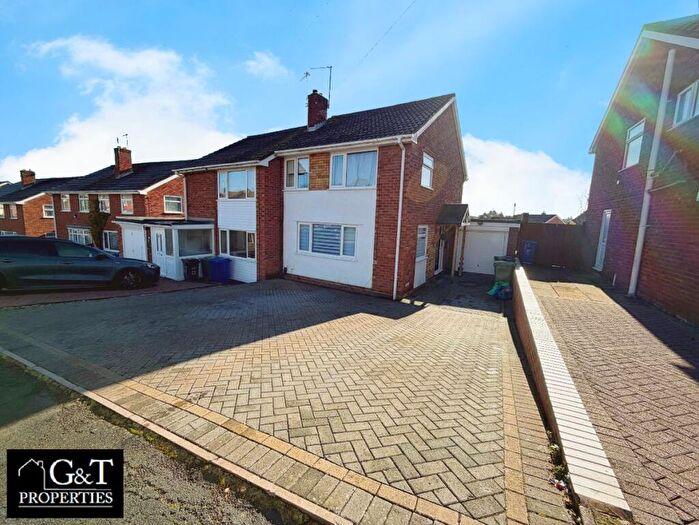
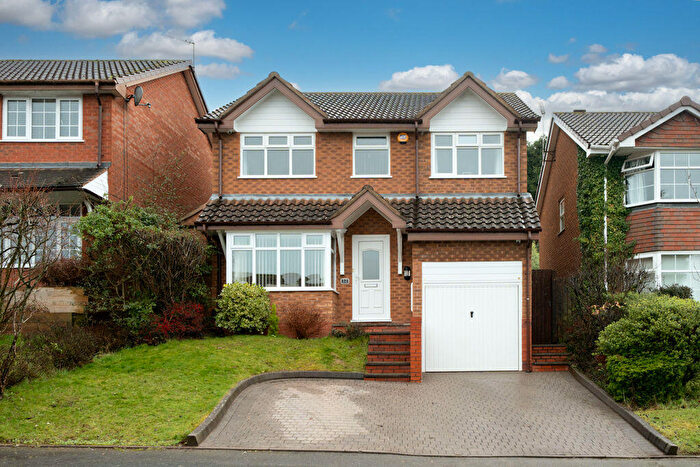
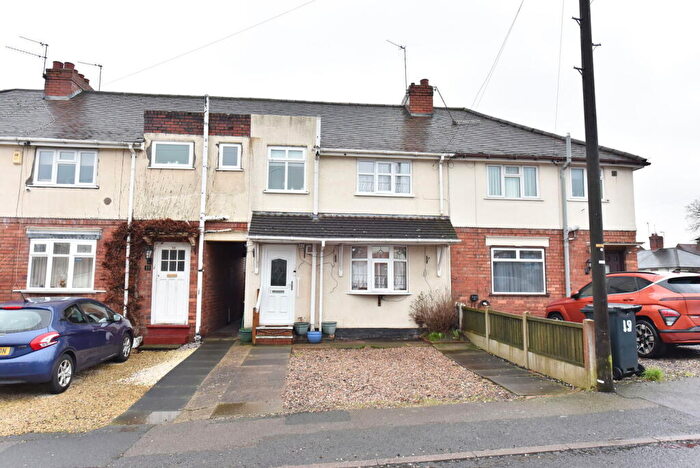
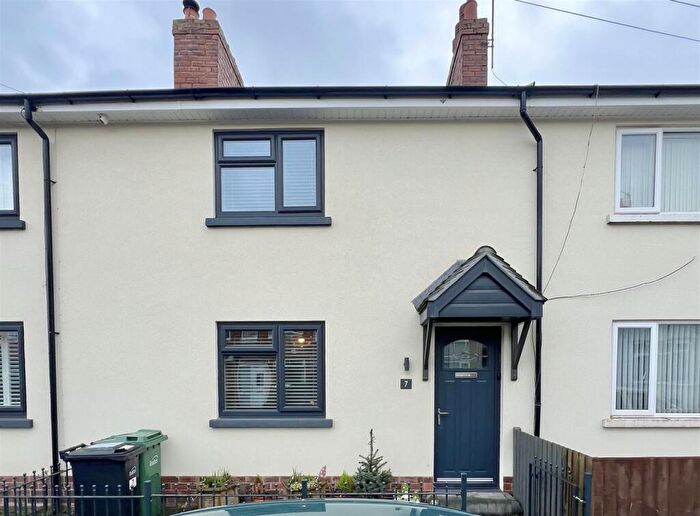
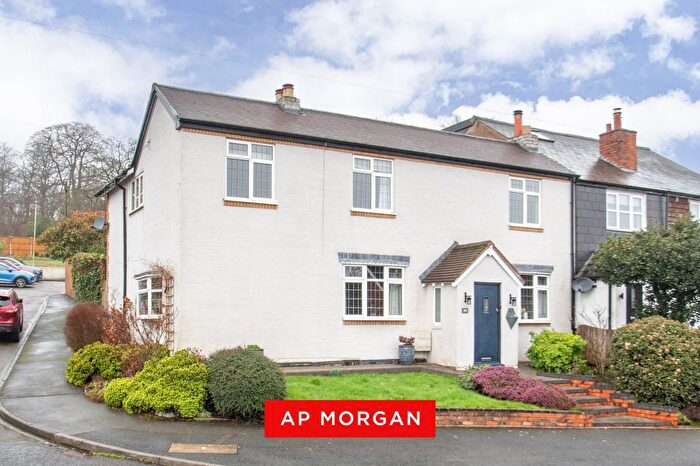
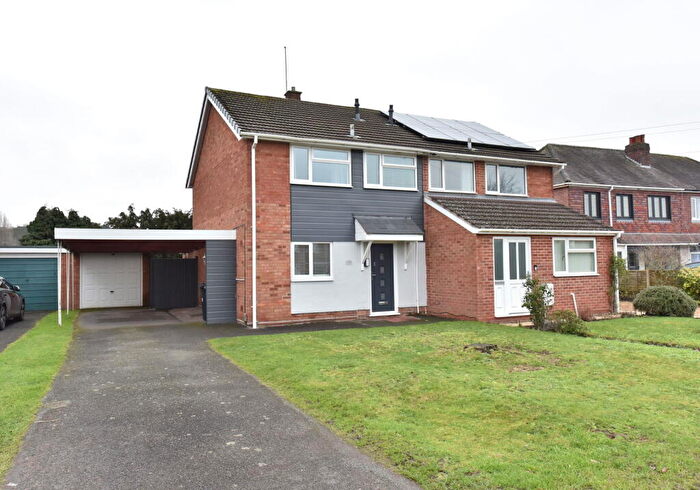
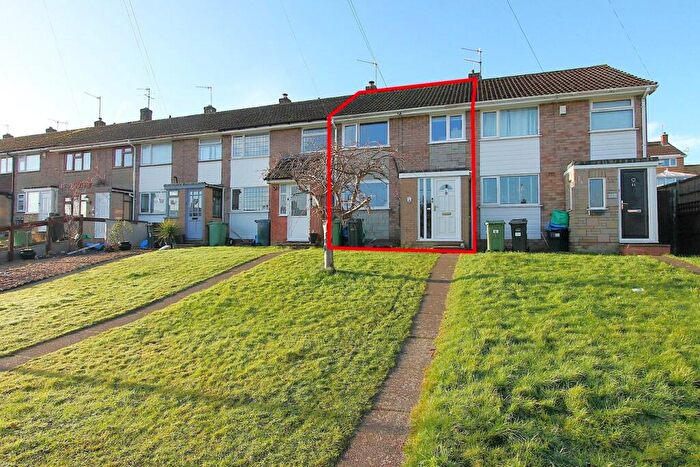
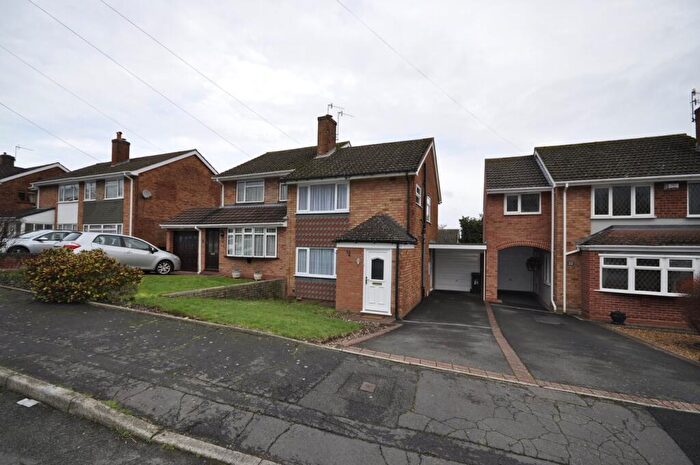
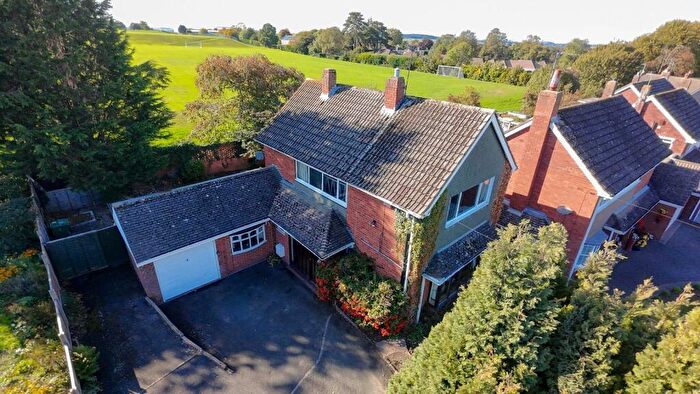
Houses for sale & to rent in Kingswinford South, Stourbridge
House Prices in Kingswinford South
Properties in Kingswinford South have an average house price of £315,714.00 and had 65 Property Transactions within the last 3 years¹.
Kingswinford South is an area in Stourbridge, Dudley with 785 households², where the most expensive property was sold for £595,000.00.
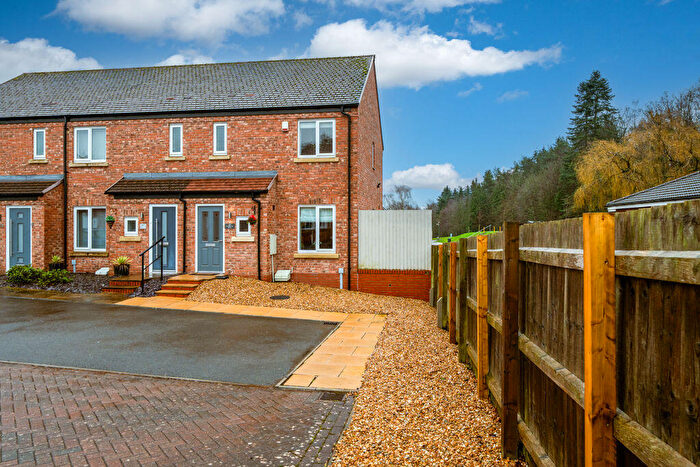
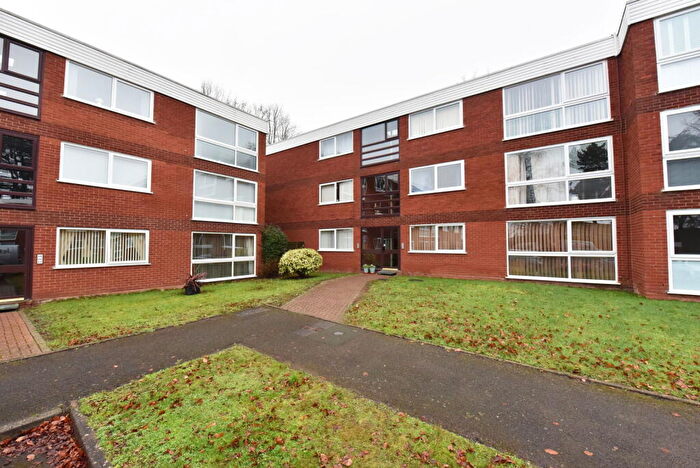
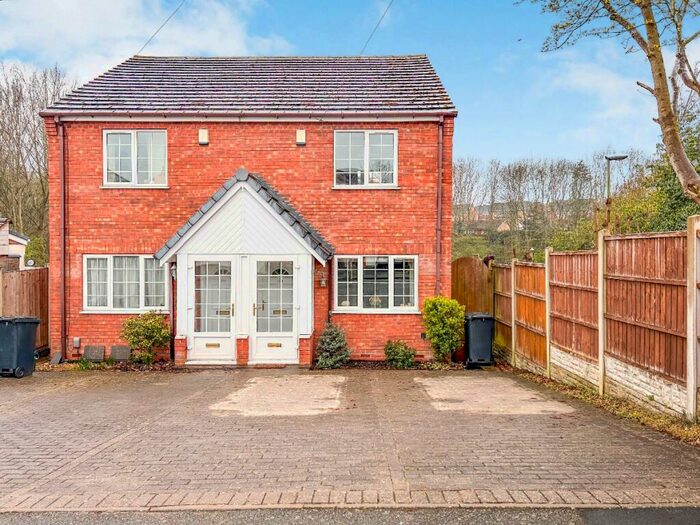
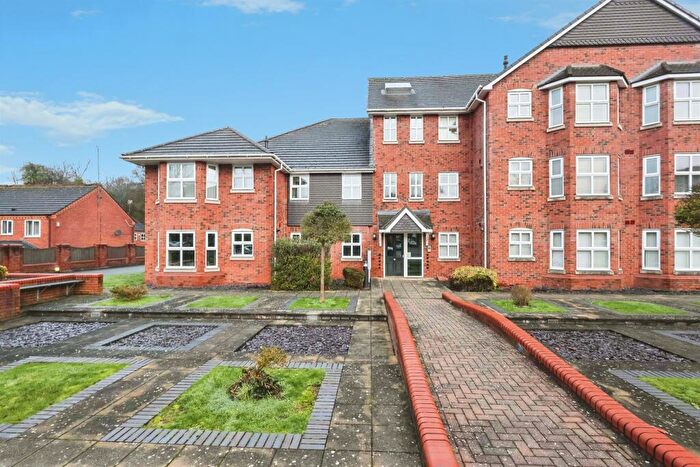
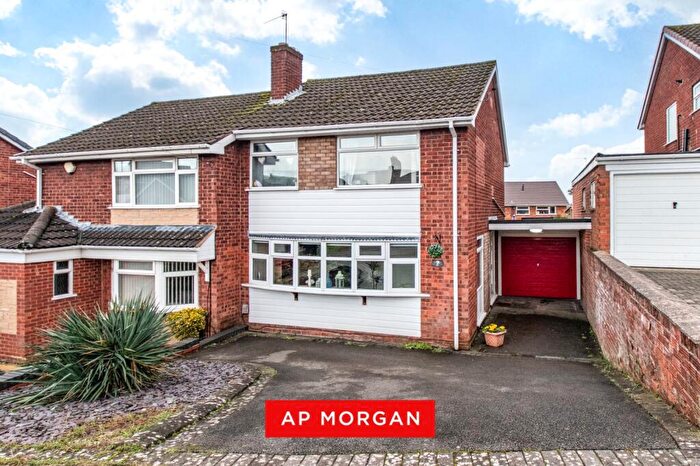
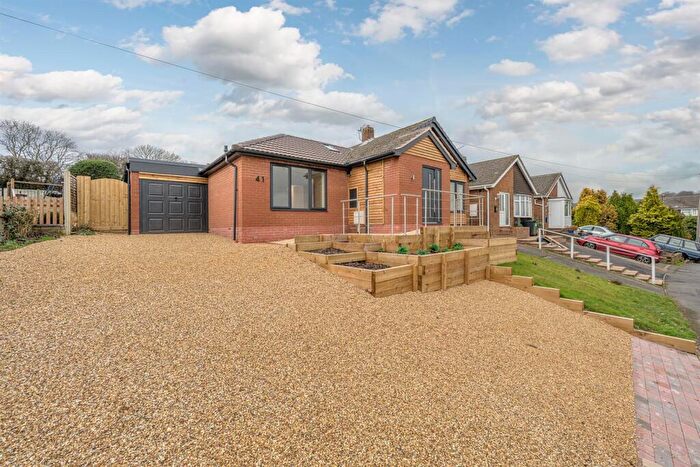
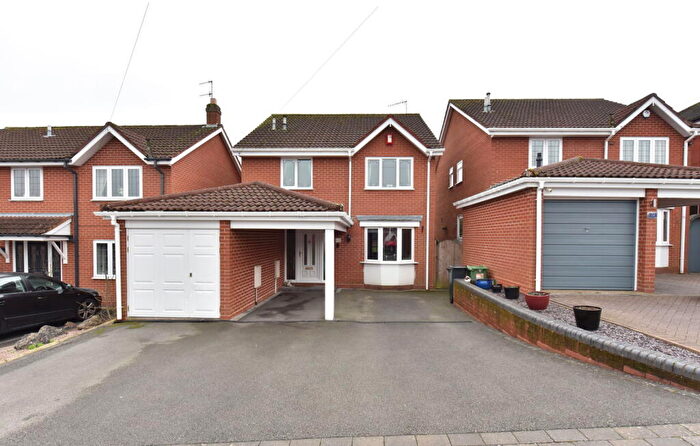
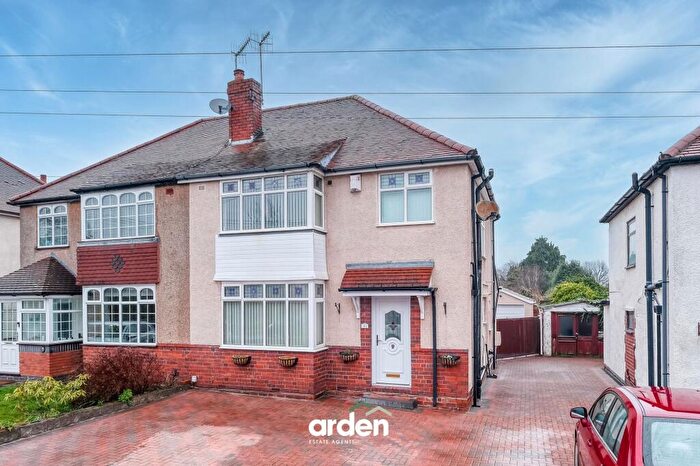
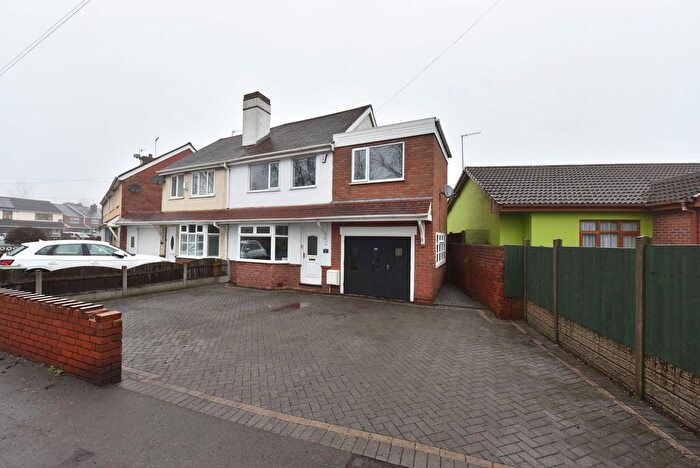
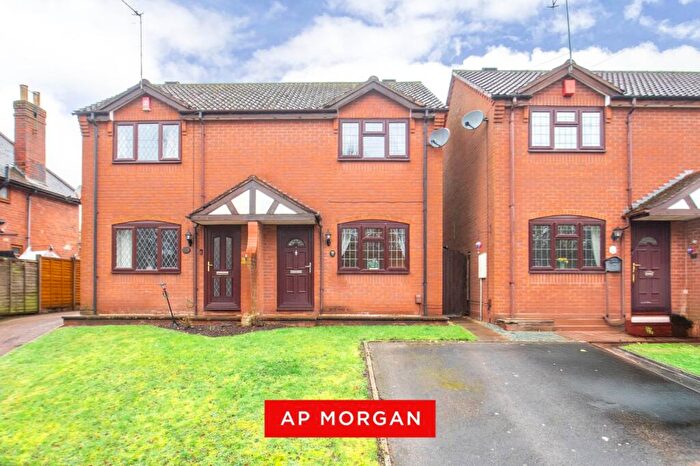
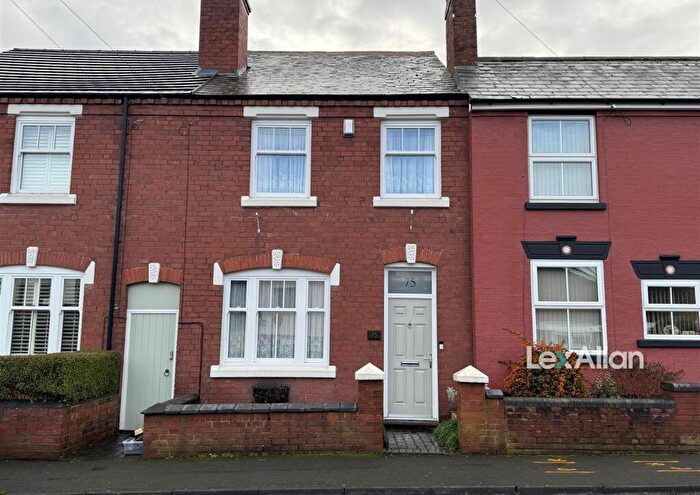
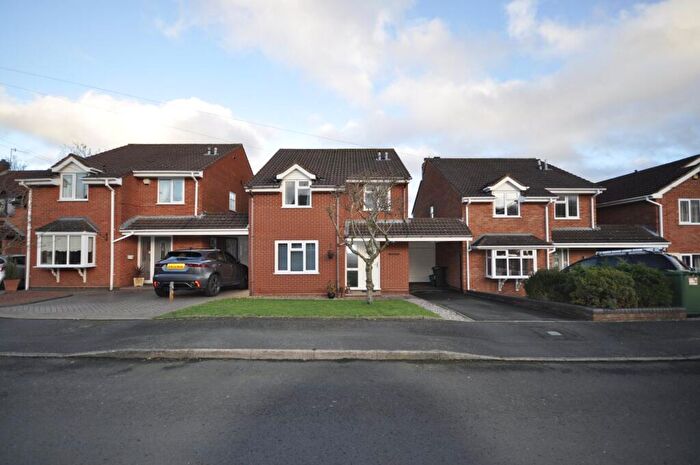
Properties for sale in Kingswinford South
Roads and Postcodes in Kingswinford South
Navigate through our locations to find the location of your next house in Kingswinford South, Stourbridge for sale or to rent.
| Streets | Postcodes |
|---|---|
| Arbury Drive | DY8 5NL |
| Arden Close | DY8 5LT |
| Barnett Lane | DY8 5PS DY8 5PX DY8 5PY DY8 5PZ |
| Barnett Street | DY8 5QL |
| Beaubrook Gardens | DY8 5QJ |
| Chingford Close | DY8 5PA |
| Cot Lane | DY8 5PP DY8 5PR |
| Dartmouth Avenue | DY8 5QE |
| Dowells Gardens | DY8 5QA |
| Fenn Rise | DY8 5NP |
| Fernleigh Gardens | DY8 5LY |
| Friars Close | DY8 5LZ |
| Graham Road | DY8 5PU |
| Hainult Close | DY8 5PB |
| Highcroft Avenue | DY8 5LX |
| Hollyhurst Drive | DY8 5QQ |
| Hope Street | DY8 5QB |
| Horsham Avenue | DY8 5LU |
| Ingatestone Drive | DY8 5PT |
| Lammas Road | DY8 5NE |
| Lawnswood Avenue | DY8 5LP DY8 5LR DY8 5LS |
| Lawnswood Road | DY8 5LW DY8 5NT DY8 5NA |
| Lymsey Croft | DY8 5ND |
| Marsh Crescent | DY8 5NN |
| Mellowdew Road | DY8 5NG DY8 5NQ |
| Middleway Avenue | DY8 5NB DY8 5NH DY8 5NJ |
| Muirville Close | DY8 5NR |
| Quayle Grove | DY8 5NS |
| Quillets Road | DY8 5NF |
| Quorn Crescent | DY8 5NW |
| Rectory Street | DY8 5QT |
| Silverdale Gardens | DY8 5NU |
| Stream Road | DY8 5QU DY6 9NY |
Transport near Kingswinford South
- FAQ
- Price Paid By Year
- Property Type Price
Frequently asked questions about Kingswinford South
What is the average price for a property for sale in Kingswinford South?
The average price for a property for sale in Kingswinford South is £315,714. This amount is 14% higher than the average price in Stourbridge. There are 1,119 property listings for sale in Kingswinford South.
What streets have the most expensive properties for sale in Kingswinford South?
The streets with the most expensive properties for sale in Kingswinford South are Chingford Close at an average of £472,000, Cot Lane at an average of £455,000 and Hope Street at an average of £455,000.
What streets have the most affordable properties for sale in Kingswinford South?
The streets with the most affordable properties for sale in Kingswinford South are Stream Road at an average of £180,000, Ingatestone Drive at an average of £182,000 and Barnett Street at an average of £229,166.
Which train stations are available in or near Kingswinford South?
Some of the train stations available in or near Kingswinford South are Stourbridge Town, Lye and Stourbridge Junction.
Property Price Paid in Kingswinford South by Year
The average sold property price by year was:
| Year | Average Sold Price | Price Change |
Sold Properties
|
|---|---|---|---|
| 2025 | £340,974 | 9% |
22 Properties |
| 2024 | £310,230 | 6% |
26 Properties |
| 2023 | £291,411 | -1% |
17 Properties |
| 2022 | £294,353 | 3% |
24 Properties |
| 2021 | £286,536 | 7% |
41 Properties |
| 2020 | £267,377 | -1% |
29 Properties |
| 2019 | £269,602 | 1% |
25 Properties |
| 2018 | £266,900 | 7% |
26 Properties |
| 2017 | £247,769 | 17% |
31 Properties |
| 2016 | £205,230 | -2% |
23 Properties |
| 2015 | £208,651 | 5% |
28 Properties |
| 2014 | £198,148 | -0,3% |
29 Properties |
| 2013 | £198,816 | 4% |
28 Properties |
| 2012 | £190,521 | 1% |
19 Properties |
| 2011 | £187,836 | -4% |
22 Properties |
| 2010 | £196,133 | 11% |
18 Properties |
| 2009 | £175,498 | -11% |
28 Properties |
| 2008 | £194,219 | -7% |
13 Properties |
| 2007 | £207,685 | 10% |
39 Properties |
| 2006 | £187,769 | -4% |
45 Properties |
| 2005 | £195,376 | 15% |
52 Properties |
| 2004 | £165,460 | 13% |
19 Properties |
| 2003 | £143,143 | 18% |
29 Properties |
| 2002 | £117,700 | 14% |
24 Properties |
| 2001 | £100,704 | 7% |
25 Properties |
| 2000 | £93,773 | 9% |
36 Properties |
| 1999 | £85,396 | 7% |
43 Properties |
| 1998 | £79,576 | 7% |
21 Properties |
| 1997 | £74,225 | 8% |
35 Properties |
| 1996 | £68,036 | -1% |
29 Properties |
| 1995 | £68,705 | - |
37 Properties |
Property Price per Property Type in Kingswinford South
Here you can find historic sold price data in order to help with your property search.
The average Property Paid Price for specific property types in the last three years are:
| Property Type | Average Sold Price | Sold Properties |
|---|---|---|
| Semi Detached House | £297,027.00 | 34 Semi Detached Houses |
| Detached House | £410,325.00 | 20 Detached Houses |
| Terraced House | £276,250.00 | 4 Terraced Houses |
| Flat | £158,714.00 | 7 Flats |

