
Houses for sale & to rent in Wembley, Brent London Borough
House Prices in Wembley
Properties in this part of Wembley within the Brent London Borough have an average house price of £480k and had 1,707 Property Transactions within the last 3 years.¹ This area has 30,117 households² , where the most expensive property was sold for £2.6M.
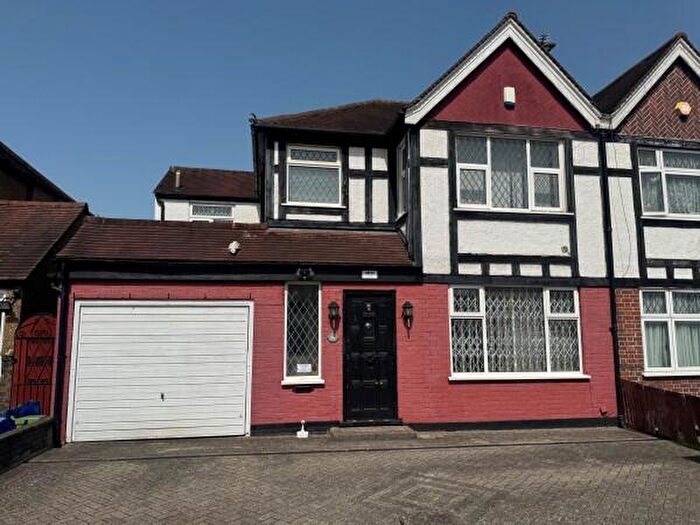
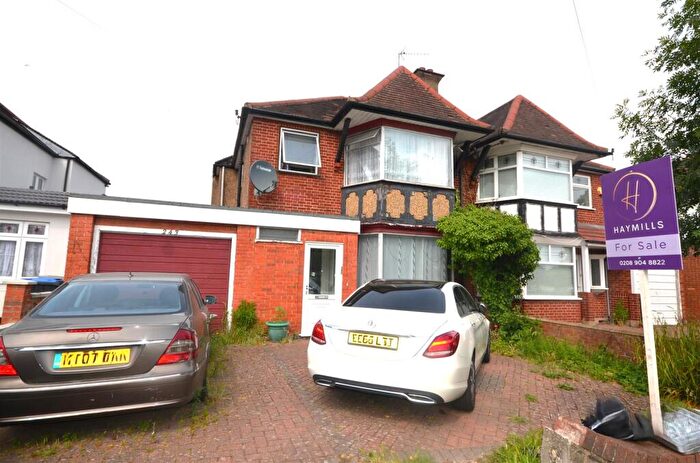
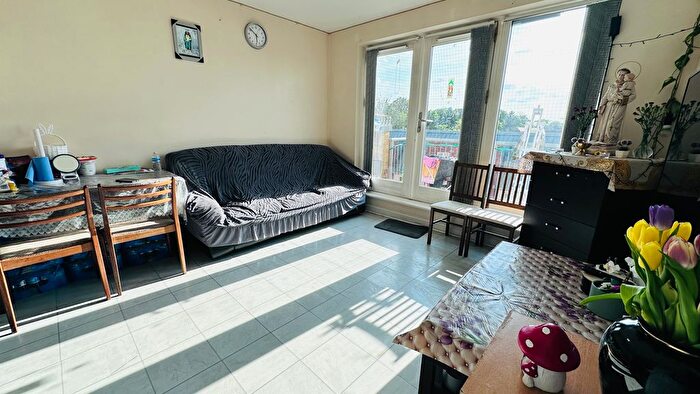
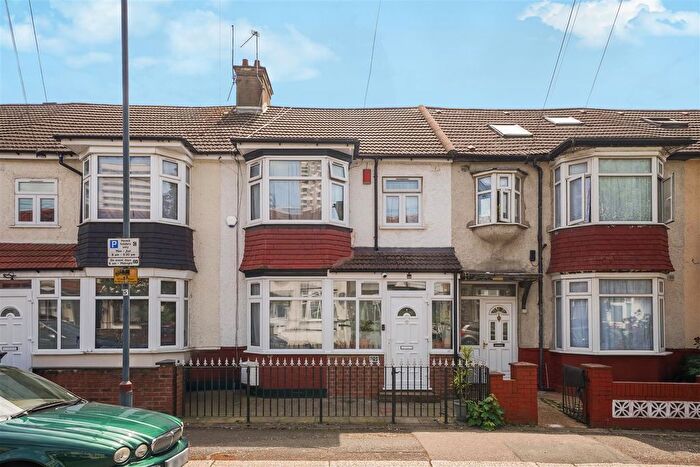
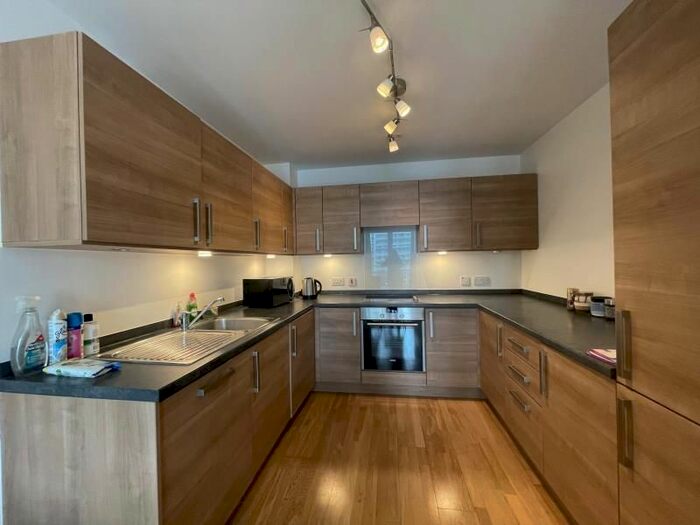
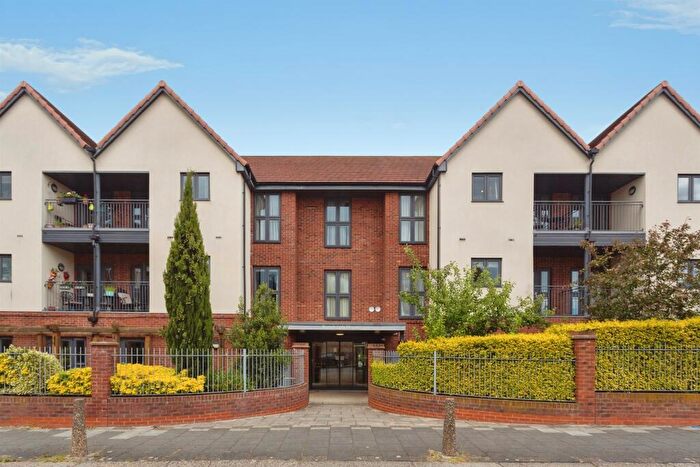
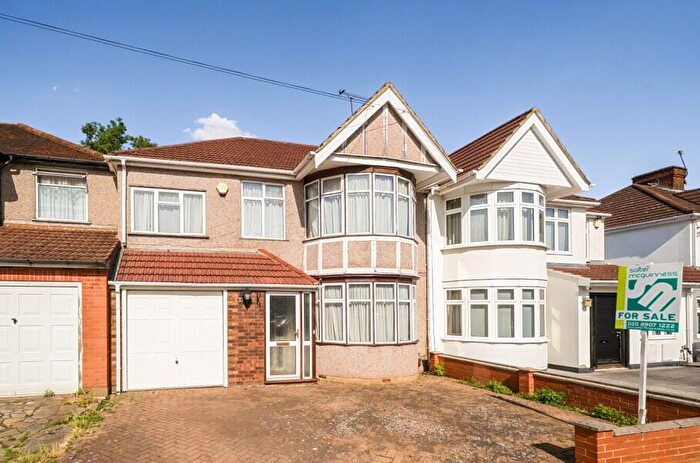
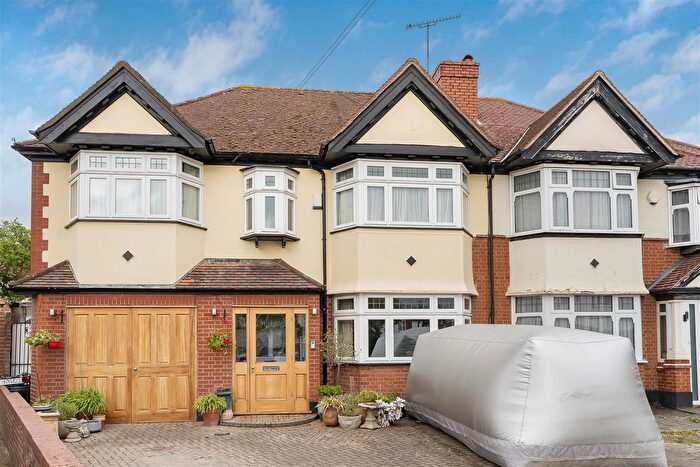
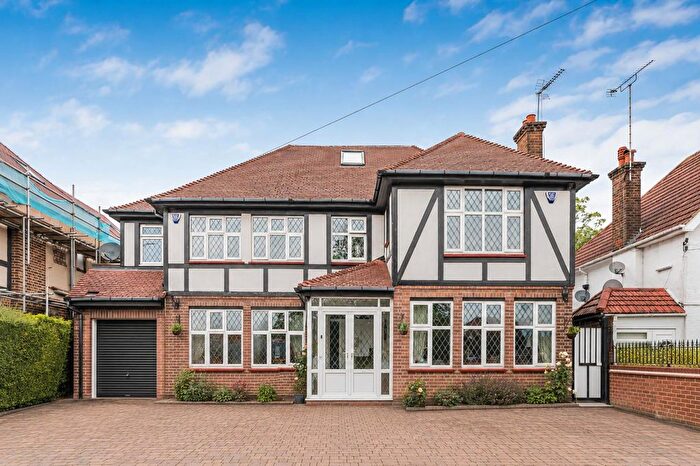
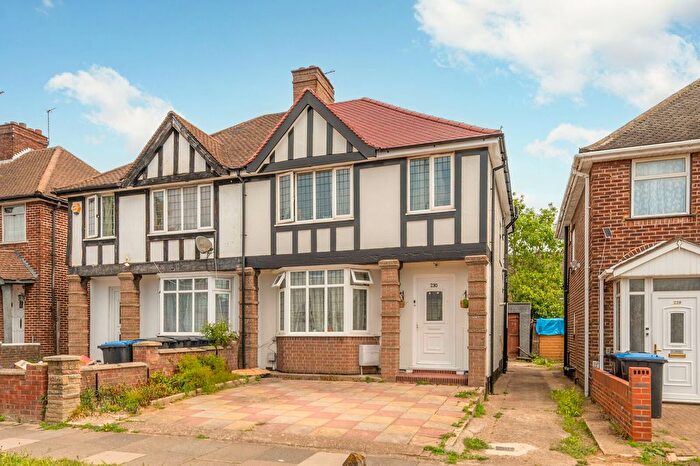
Properties for sale in Wembley
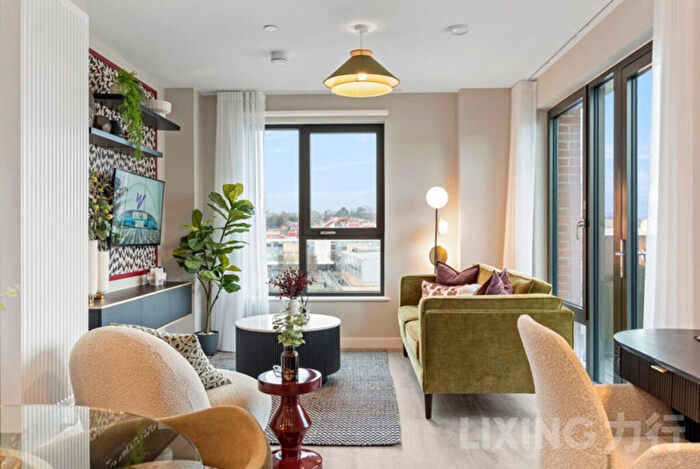
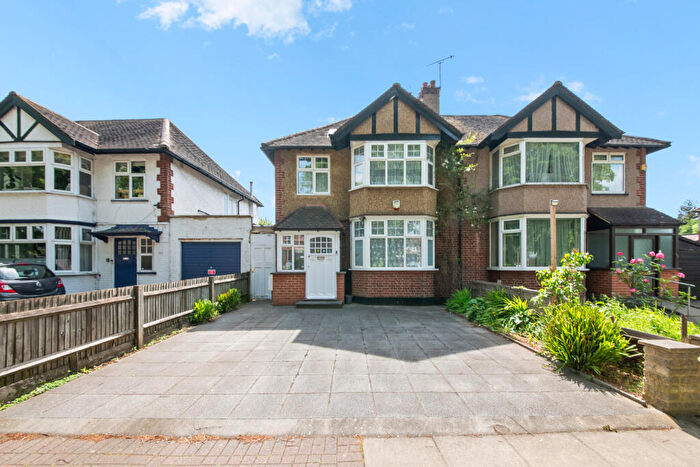
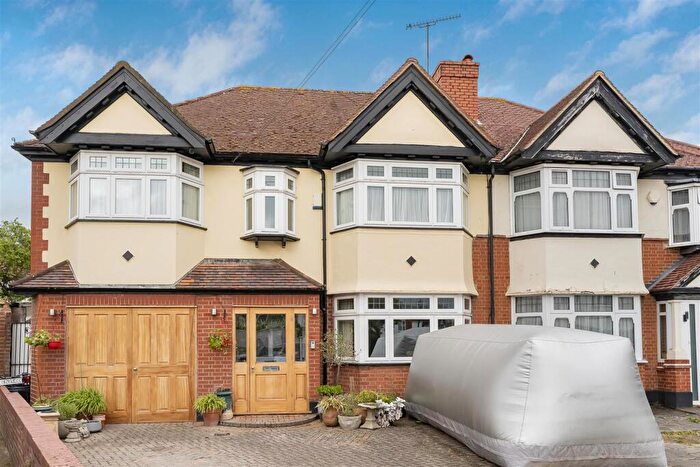
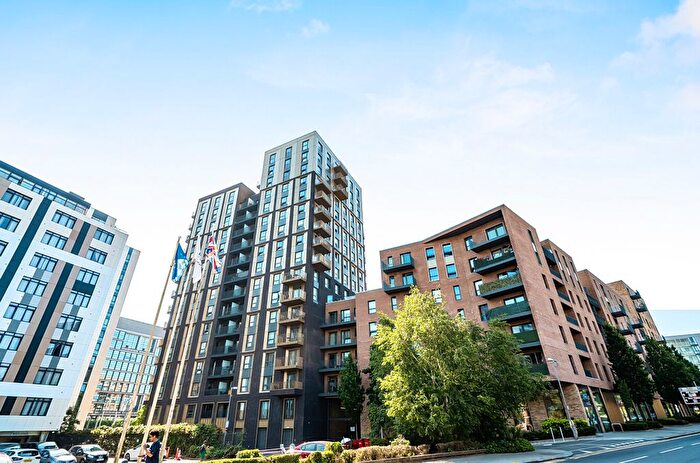
![]()
If you are looking to sell your house, let it out, or receive a property valuation, an expert can help you.
Click the button below to get started.

Neighbourhoods in Wembley
Navigate through our locations to find the location of your next house in Wembley, Brent London Borough for sale or to rent.
Transport in Wembley
Please see below transportation links in this area:
-


 Wembley Central Station
 -
Wembley Stadium Station
-
North Wembley Station
-
Wembley Park Station
-
Sudbury and Harrow Road Station
-
Sudbury Town Station
-
Preston Road Station
-
Alperton Station
-
South Kenton Station
-
Stonebridge Park Station
- FAQ
- Price Paid By Year
- Property Type Price
Frequently asked questions about Wembley
What is the average price for a property for sale in Wembley?
The average price for a property for sale in Wembley is £480,066. This amount is 24% lower than the average price in Brent London Borough. There are more than 10,000 property listings for sale in Wembley.
What locations have the most expensive properties for sale in Wembley?
The locations with the most expensive properties for sale in Wembley are Barnhill at an average of £623,160, Northwick Park at an average of £615,621 and Preston at an average of £484,245.
What locations have the most affordable properties for sale in Wembley?
The locations with the most affordable properties for sale in Wembley are Alperton at an average of £424,627, Sudbury at an average of £435,172 and Wembley Central at an average of £438,068.
Which train stations are available in or near Wembley?
Some of the train stations available in or near Wembley are Wembley Central, Wembley Stadium and North Wembley.
Which tube stations are available in or near Wembley?
Some of the tube stations available in or near Wembley are Wembley Central, North Wembley and Wembley Park.
Property Price Paid in Wembley by Year
The average sold property price by year was:
| Year | Average Sold Price | Price Change |
Sold Properties
|
|---|---|---|---|
| 2026 | £528,651 | 8% |
39 Properties |
| 2025 | £487,505 | 5% |
571 Properties |
| 2024 | £461,362 | -6% |
566 Properties |
| 2023 | £488,436 | 1% |
531 Properties |
| 2022 | £483,695 | 1% |
665 Properties |
| 2021 | £479,261 | 4% |
796 Properties |
| 2020 | £461,636 | 4% |
576 Properties |
| 2019 | £441,641 | 10% |
502 Properties |
| 2018 | £398,435 | -12% |
655 Properties |
| 2017 | £447,200 | 10% |
976 Properties |
| 2016 | £402,578 | 10% |
1,031 Properties |
| 2015 | £363,436 | 8% |
1,062 Properties |
| 2014 | £333,076 | 11% |
809 Properties |
| 2013 | £295,989 | 6% |
669 Properties |
| 2012 | £278,411 | -2% |
585 Properties |
| 2011 | £283,896 | 5% |
634 Properties |
| 2010 | £268,443 | 5% |
695 Properties |
| 2009 | £254,926 | -8% |
393 Properties |
| 2008 | £275,541 | 1% |
682 Properties |
| 2007 | £273,909 | 11% |
1,147 Properties |
| 2006 | £244,642 | 4% |
1,084 Properties |
| 2005 | £235,101 | 3% |
1,031 Properties |
| 2004 | £229,012 | 7% |
1,277 Properties |
| 2003 | £212,391 | 11% |
1,378 Properties |
| 2002 | £189,161 | 19% |
1,571 Properties |
| 2001 | £153,994 | 12% |
1,473 Properties |
| 2000 | £134,950 | 18% |
1,442 Properties |
| 1999 | £110,938 | 13% |
1,435 Properties |
| 1998 | £96,055 | 11% |
1,301 Properties |
| 1997 | £85,320 | 12% |
1,285 Properties |
| 1996 | £74,738 | 5% |
1,124 Properties |
| 1995 | £70,764 | - |
1,026 Properties |
Property Price per Property Type in Wembley
Here you can find historic sold price data in order to help with your property search.
The average Property Paid Price for specific property types in the last three years are:
| Property Type | Average Sold Price | Sold Properties |
|---|---|---|
| Semi Detached House | £628,026.00 | 475 Semi Detached Houses |
| Terraced House | £557,748.00 | 357 Terraced Houses |
| Detached House | £854,603.00 | 92 Detached Houses |
| Flat | £310,883.00 | 783 Flats |