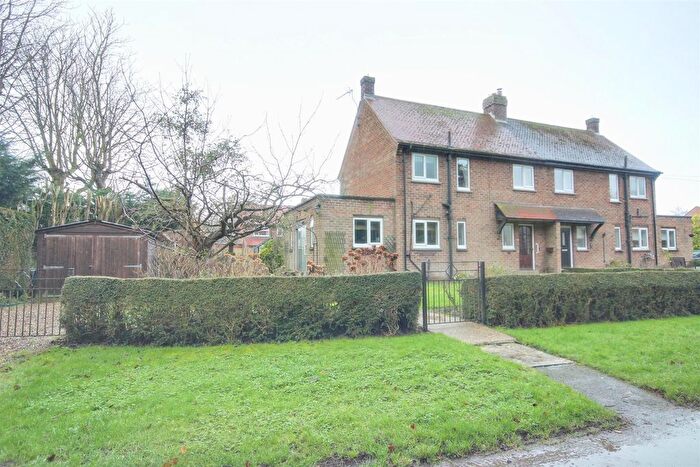
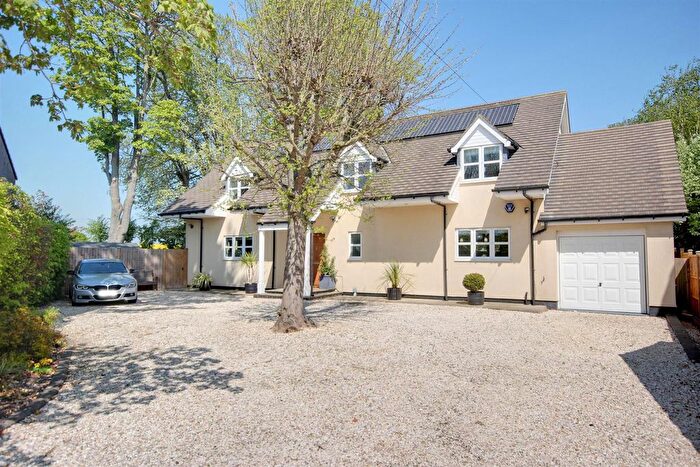
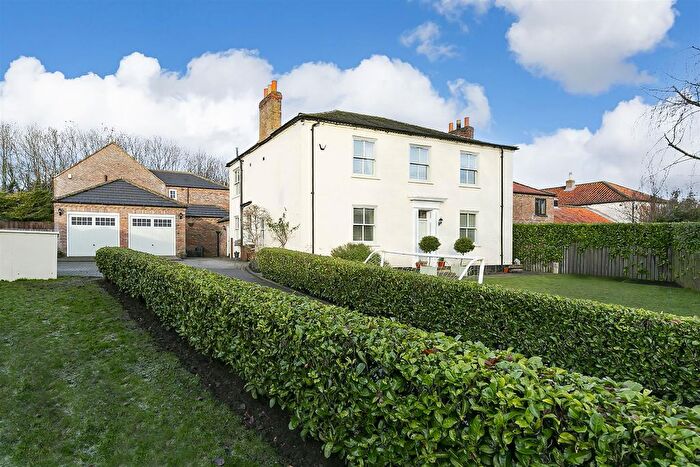
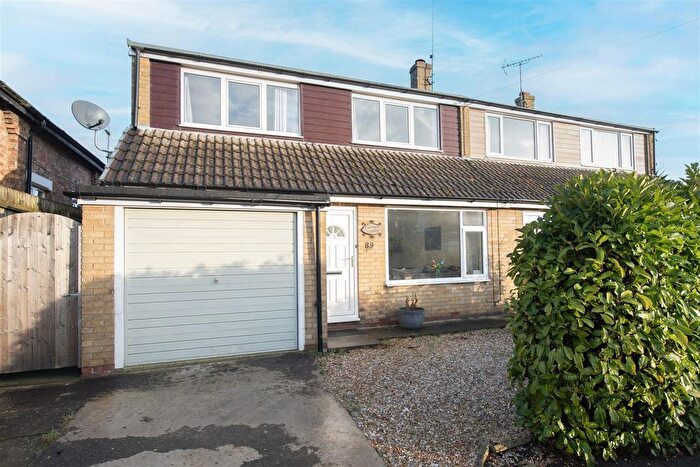
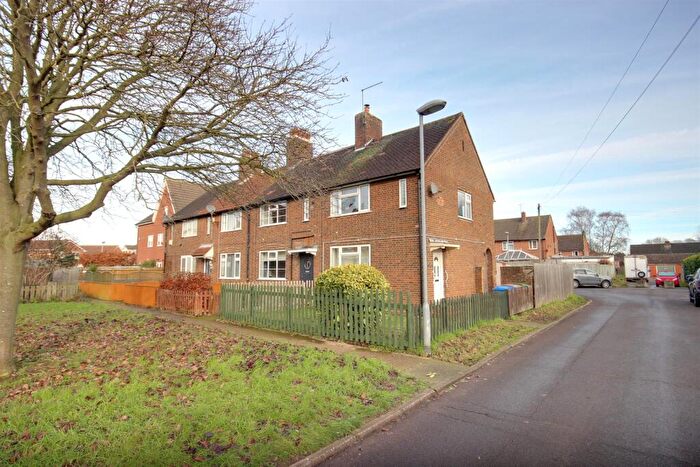
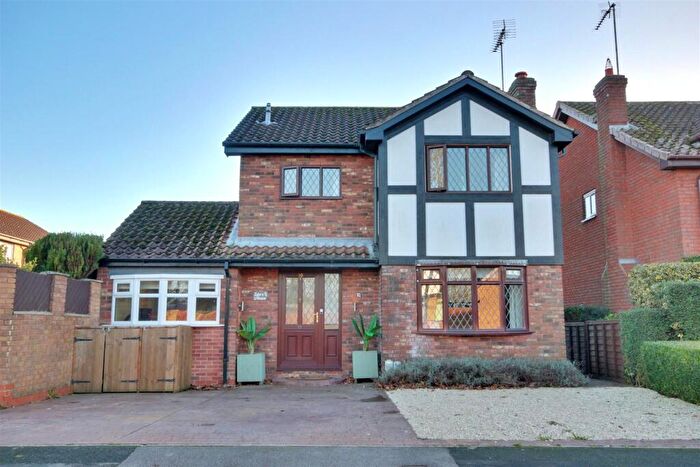
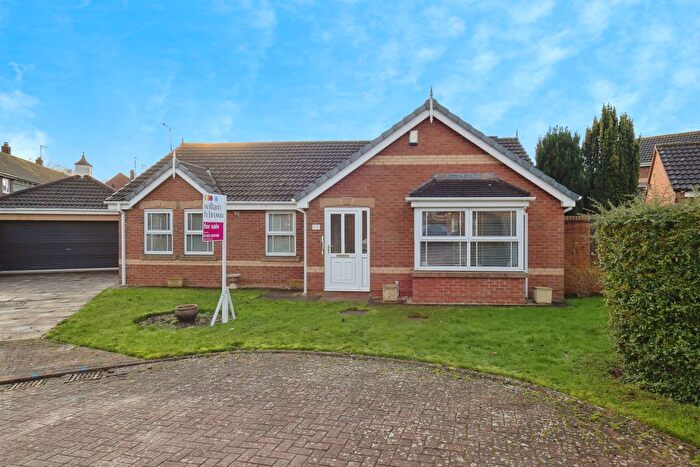
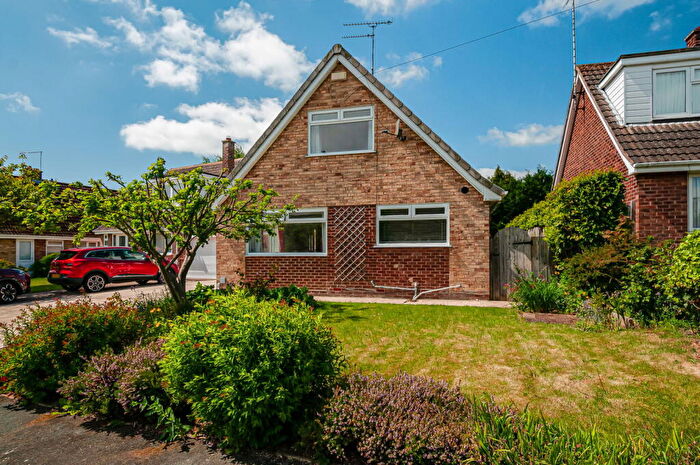
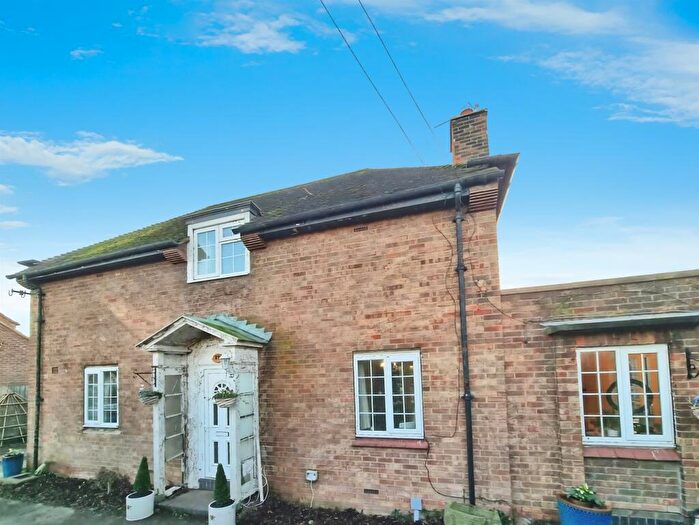
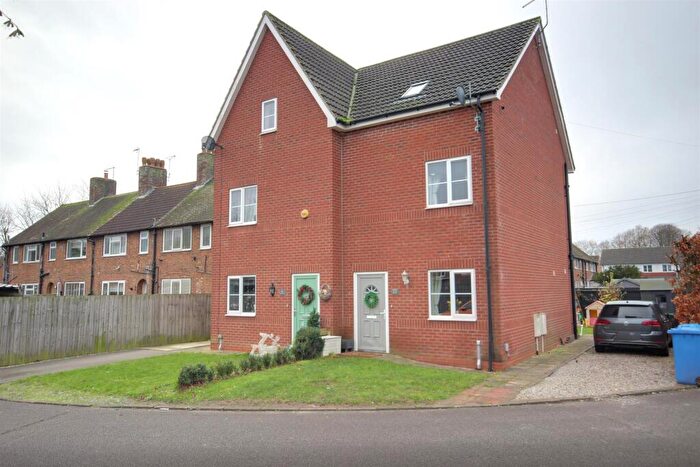
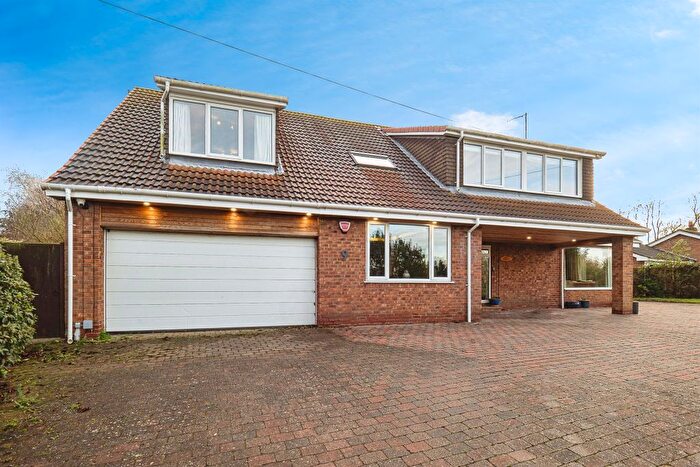
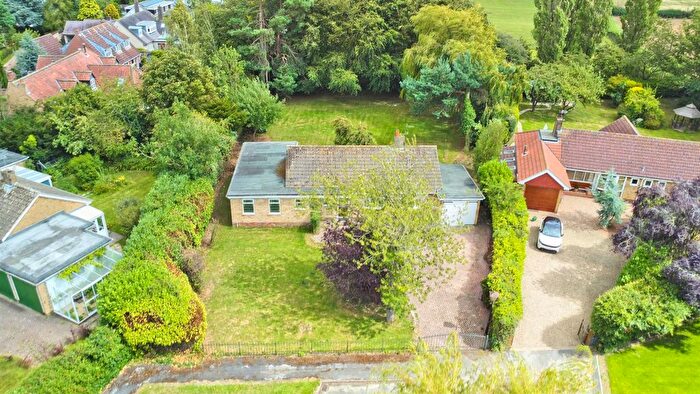
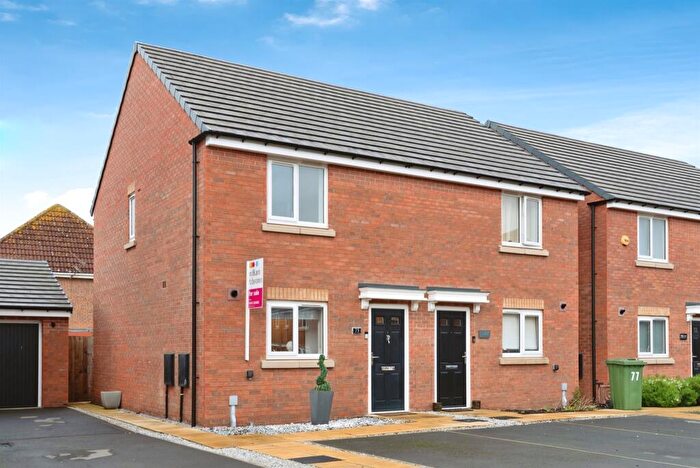
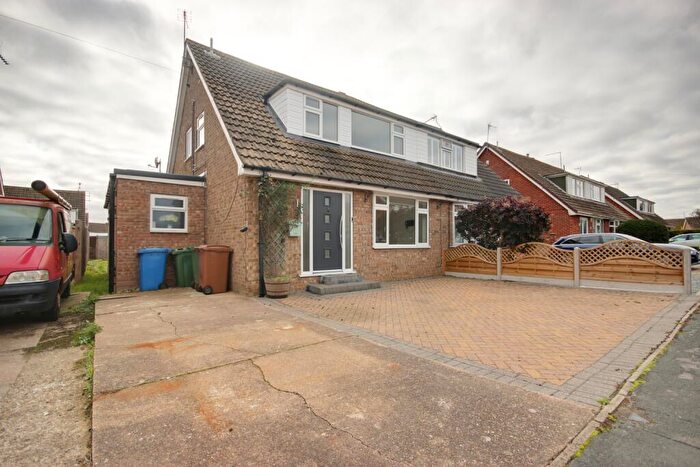
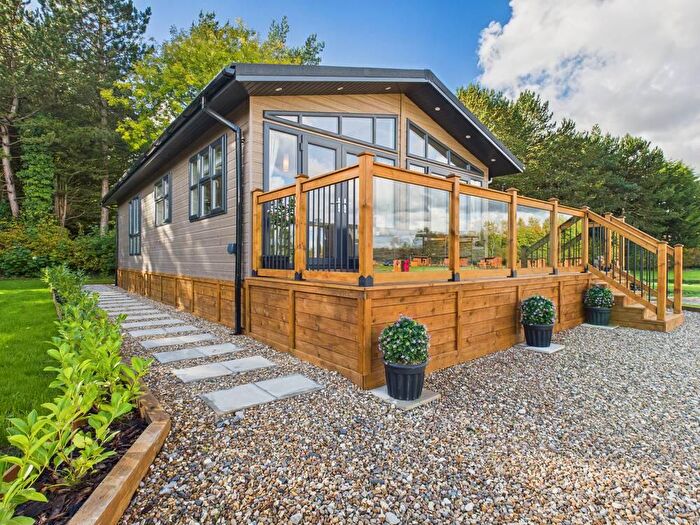
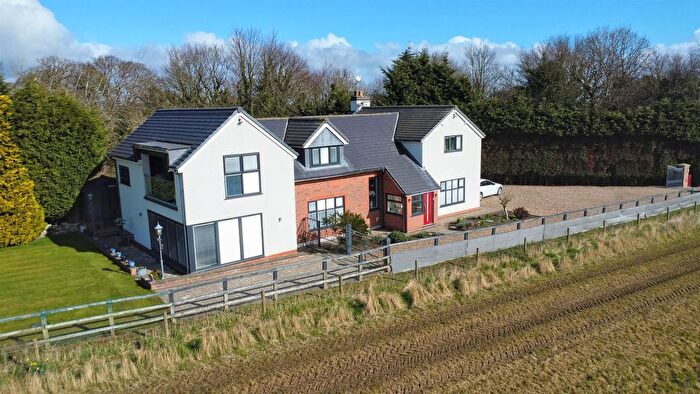
Houses for sale & to rent in Beverley Rural, Driffield
House Prices in Beverley Rural
Properties in Beverley Rural have an average house price of £352,051.00 and had 75 Property Transactions within the last 3 years¹.
Beverley Rural is an area in Driffield, East Riding of Yorkshire with 892 households², where the most expensive property was sold for £1,450,000.00.
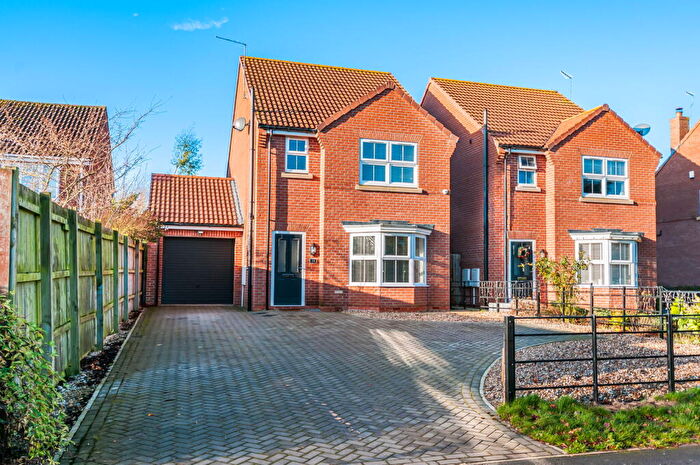
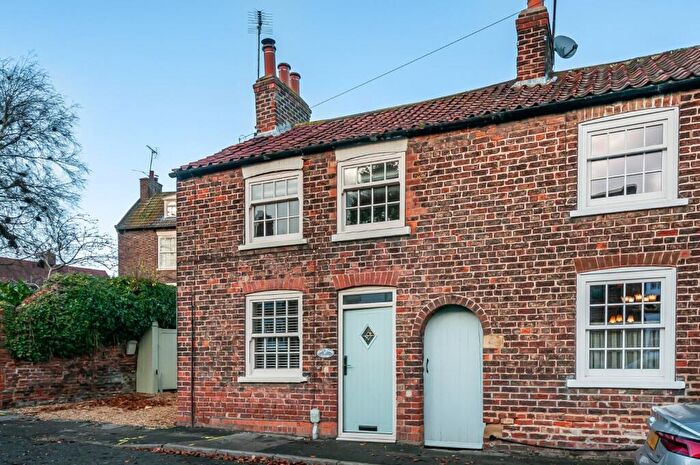
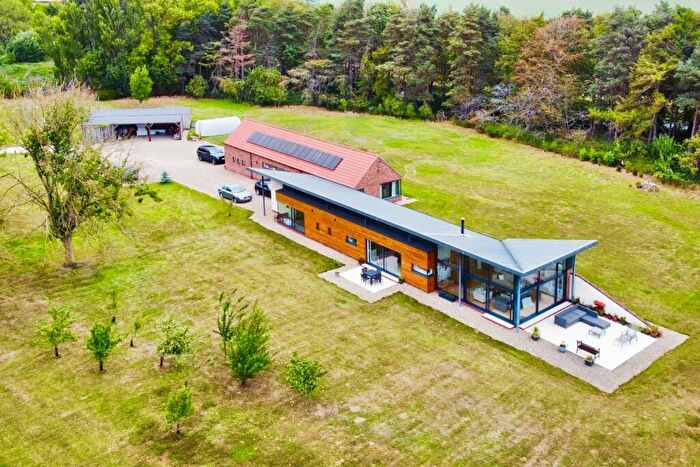
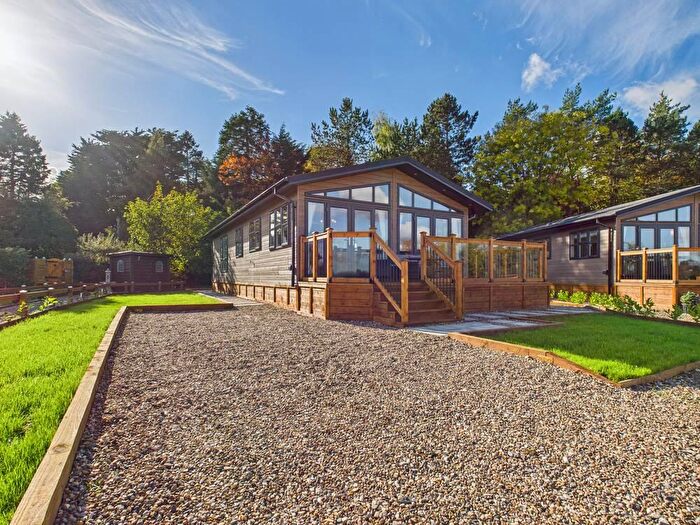
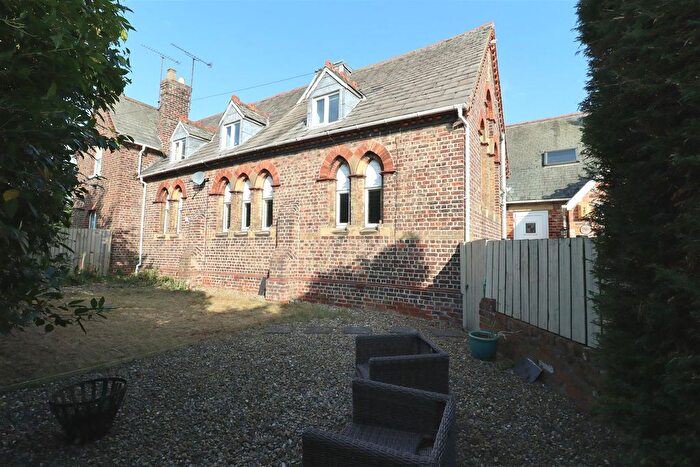
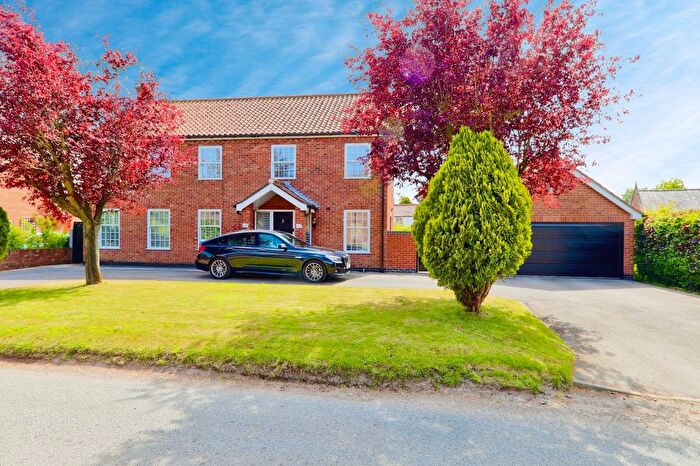
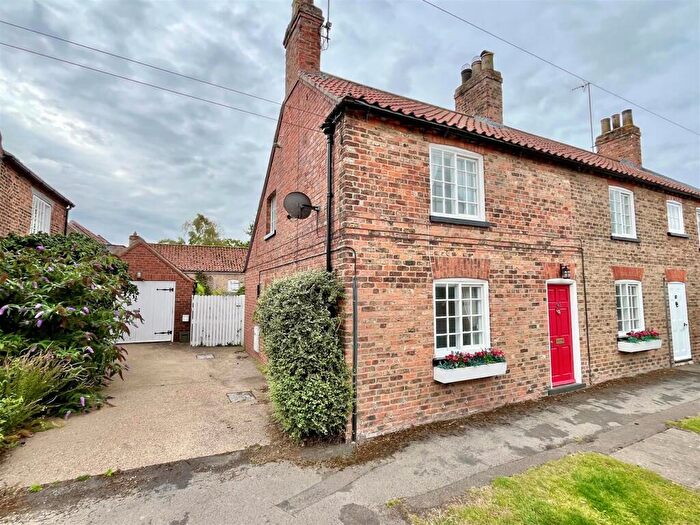
Properties for sale in Beverley Rural
Roads and Postcodes in Beverley Rural
Navigate through our locations to find the location of your next house in Beverley Rural, Driffield for sale or to rent.
| Streets | Postcodes |
|---|---|
| Aike Road | YO25 9BE |
| Beeler Close | YO25 9BA |
| Beelers Lane | YO25 9SS |
| Beverley Road | YO25 9BY YO25 9UF |
| Chapel Lane | YO25 9UE |
| Chapel Street | YO25 9SN |
| Cherry Garth | YO25 9TD |
| Church Hill | YO25 9UG |
| Church Lane | YO25 9JW YO25 9SU |
| Damson Garth | YO25 9TH |
| Dead Lane | YO25 9SL |
| Driffield Road | YO25 9AY |
| Eastgate | YO25 9TQ |
| Follet Close | YO25 9AZ |
| Front Street | YO25 9SH YO25 9UA |
| Front Street Court | YO25 9TZ |
| Greenfield Lane | YO25 9UH |
| Greenfield Road | YO25 9UL |
| Kilnwick Lane | YO25 9SY |
| Kilnwick Lodges | YO25 9JB |
| Kipling Close | YO25 9NY |
| Kipling Court | YO25 9NX |
| Lockington Road | YO25 9TG |
| Lund Lane | YO25 9SJ |
| Main Street | YO25 9AS YO25 9AT YO25 9AU YO25 9JD |
| Middleton Gate | YO25 9EU |
| Millfield Garth | YO25 9UJ |
| North Road | YO25 9TF |
| Orchard Drive | YO25 9UW |
| Pickering Park | YO25 9TY |
| Queens Mead | YO25 9TJ |
| Rectory View | YO25 9SG |
| School Lane | YO25 9JE |
| South Avenue | YO25 9TL |
| South Drive | YO25 9UD |
| South Glebe | YO25 9ST |
| South Street | YO25 9UB YO25 9ZH |
| St Andrews Close | YO25 9UP |
| Station Road | YO25 9BD YO25 9UQ YO25 9SQ |
| The Green | YO25 9TE |
| The Paddocks | YO25 9UN |
| Thompson Drive | YO25 9TX |
| Thorpe Leys | YO25 9SP |
| Thorpe Road | YO25 9SR YO25 9SW |
| Village Farm | YO25 9US |
| West End | YO25 9TN |
| Westfields | YO25 9JY |
| YO25 9AX YO25 9BG YO25 9BQ YO25 9DD YO25 9DE YO25 9DQ YO25 9HZ YO25 9JF YO25 9JG YO25 9JR YO25 9TT YO25 9AR YO25 9BB YO25 9BZ YO25 9DA YO25 9DF YO25 9DG YO25 9HY YO25 9JA YO25 9SX YO25 9TP YO25 9TR YO25 9TS YO25 9TW |
Transport near Beverley Rural
- FAQ
- Price Paid By Year
- Property Type Price
Frequently asked questions about Beverley Rural
What is the average price for a property for sale in Beverley Rural?
The average price for a property for sale in Beverley Rural is £352,051. This amount is 44% higher than the average price in Driffield. There are 585 property listings for sale in Beverley Rural.
What streets have the most expensive properties for sale in Beverley Rural?
The streets with the most expensive properties for sale in Beverley Rural are Damson Garth at an average of £590,000, North Road at an average of £507,083 and Queens Mead at an average of £464,000.
What streets have the most affordable properties for sale in Beverley Rural?
The streets with the most affordable properties for sale in Beverley Rural are Pickering Park at an average of £168,357, Kipling Court at an average of £179,750 and Greenfield Road at an average of £185,071.
Which train stations are available in or near Beverley Rural?
Some of the train stations available in or near Beverley Rural are Hutton Cranswick, Arram and Driffield.
Property Price Paid in Beverley Rural by Year
The average sold property price by year was:
| Year | Average Sold Price | Price Change |
Sold Properties
|
|---|---|---|---|
| 2025 | £335,880 | 3% |
21 Properties |
| 2024 | £326,040 | -18% |
25 Properties |
| 2023 | £386,184 | 21% |
29 Properties |
| 2022 | £303,277 | -36% |
43 Properties |
| 2021 | £413,287 | 38% |
44 Properties |
| 2020 | £255,910 | -3% |
39 Properties |
| 2019 | £264,540 | 5% |
42 Properties |
| 2018 | £251,417 | -4% |
43 Properties |
| 2017 | £261,928 | 18% |
42 Properties |
| 2016 | £214,193 | -20% |
36 Properties |
| 2015 | £256,520 | 13% |
36 Properties |
| 2014 | £223,221 | 27% |
26 Properties |
| 2013 | £163,681 | -78% |
27 Properties |
| 2012 | £291,671 | 27% |
23 Properties |
| 2011 | £212,686 | -7% |
25 Properties |
| 2010 | £228,425 | 1% |
14 Properties |
| 2009 | £226,041 | -14% |
20 Properties |
| 2008 | £258,313 | -3% |
19 Properties |
| 2007 | £265,871 | 24% |
54 Properties |
| 2006 | £201,543 | -4% |
53 Properties |
| 2005 | £209,270 | 11% |
44 Properties |
| 2004 | £186,142 | 21% |
33 Properties |
| 2003 | £147,458 | 12% |
51 Properties |
| 2002 | £130,265 | 41% |
58 Properties |
| 2001 | £76,983 | -24% |
40 Properties |
| 2000 | £95,741 | 7% |
46 Properties |
| 1999 | £89,317 | 24% |
34 Properties |
| 1998 | £67,783 | -15% |
34 Properties |
| 1997 | £78,088 | -3% |
39 Properties |
| 1996 | £80,085 | -14% |
27 Properties |
| 1995 | £91,378 | - |
28 Properties |
Property Price per Property Type in Beverley Rural
Here you can find historic sold price data in order to help with your property search.
The average Property Paid Price for specific property types in the last three years are:
| Property Type | Average Sold Price | Sold Properties |
|---|---|---|
| Semi Detached House | £235,531.00 | 27 Semi Detached Houses |
| Detached House | £471,689.00 | 37 Detached Houses |
| Terraced House | £235,636.00 | 11 Terraced Houses |

