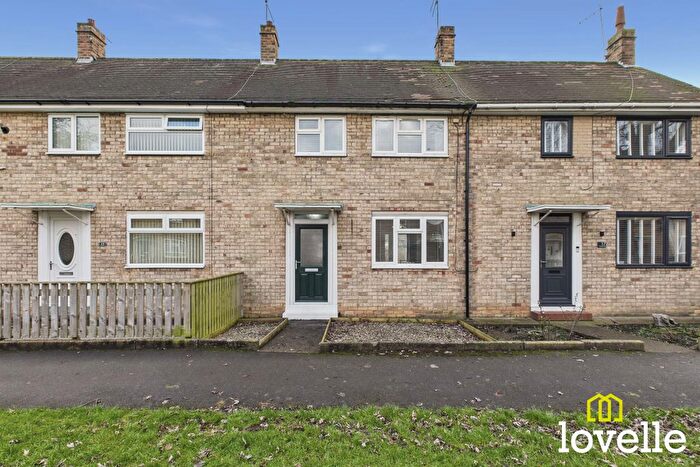
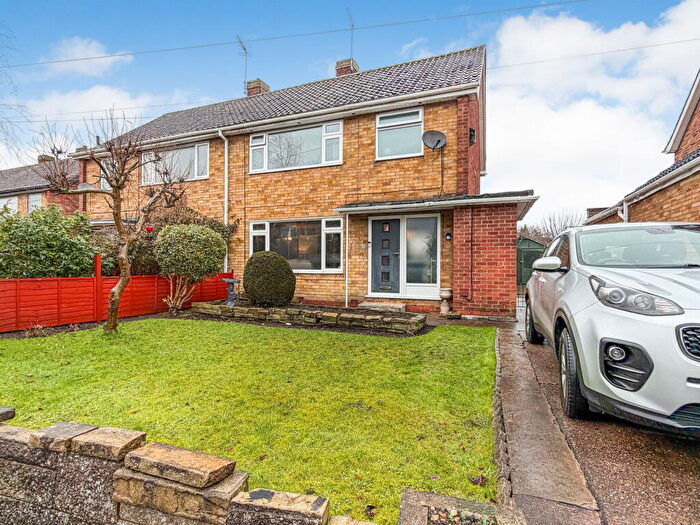
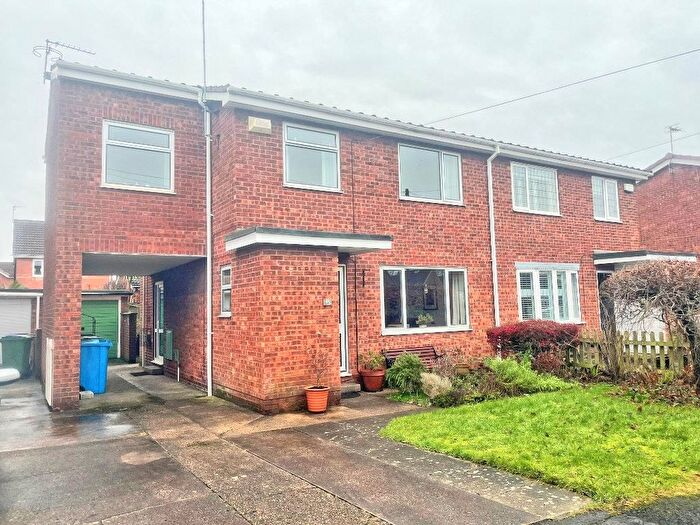
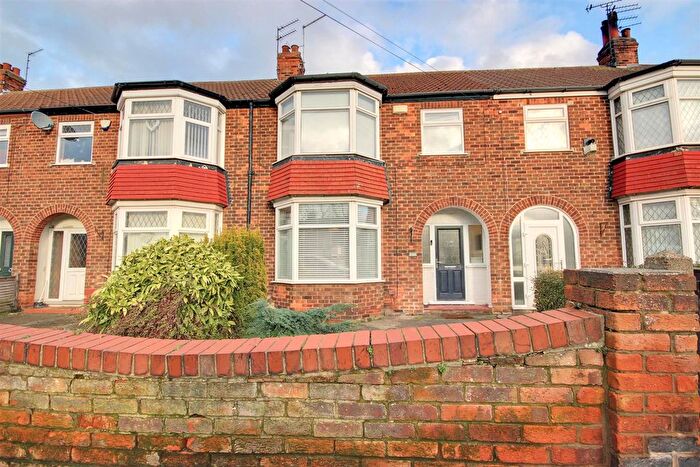
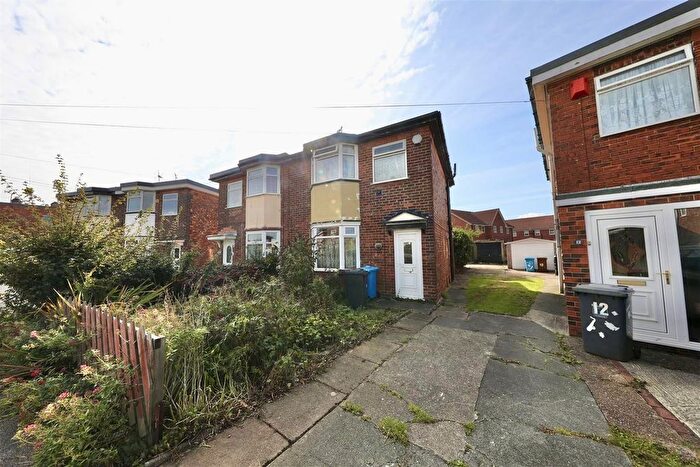
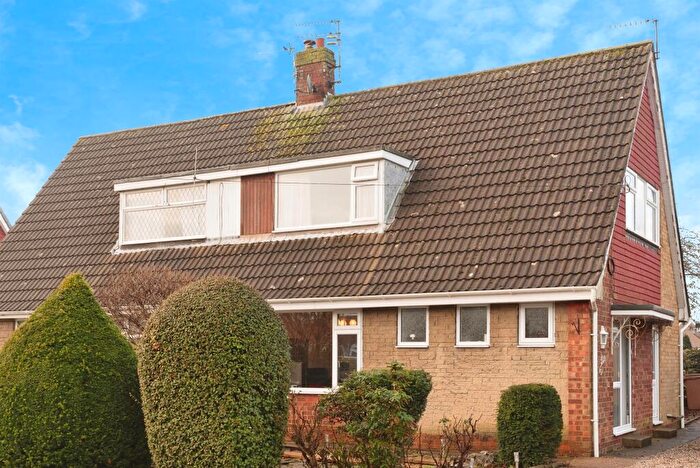
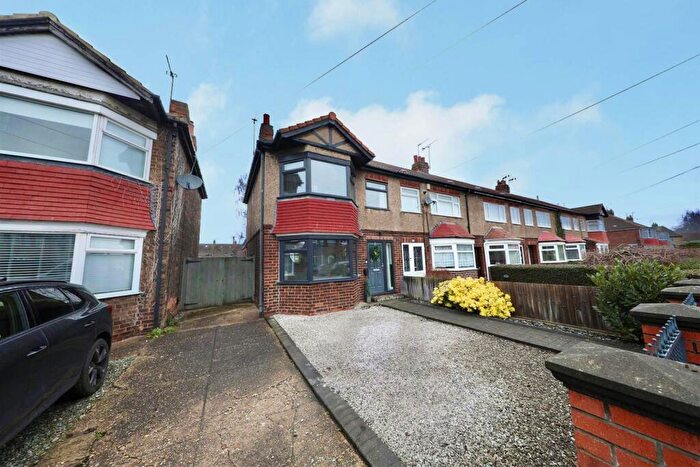
Houses for sale & to rent in Cottingham South, Hull
House Prices in Cottingham South
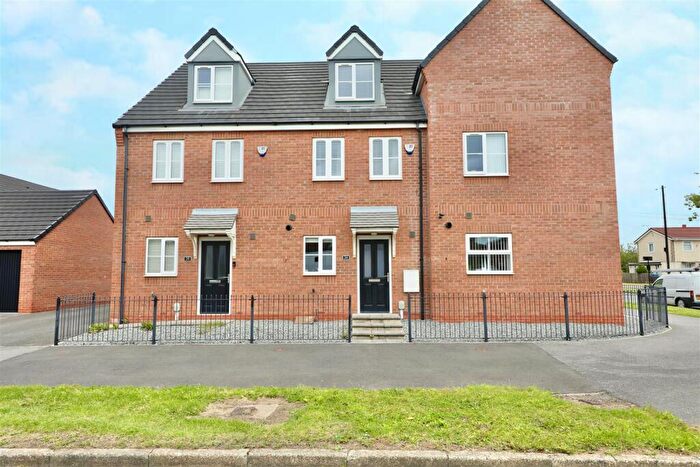
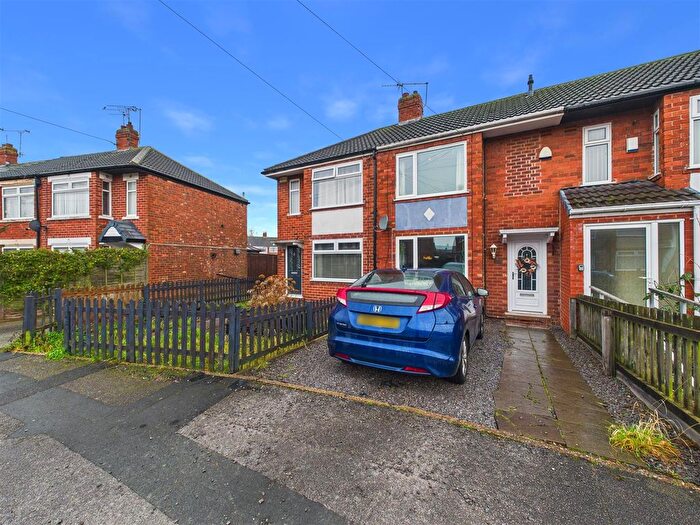
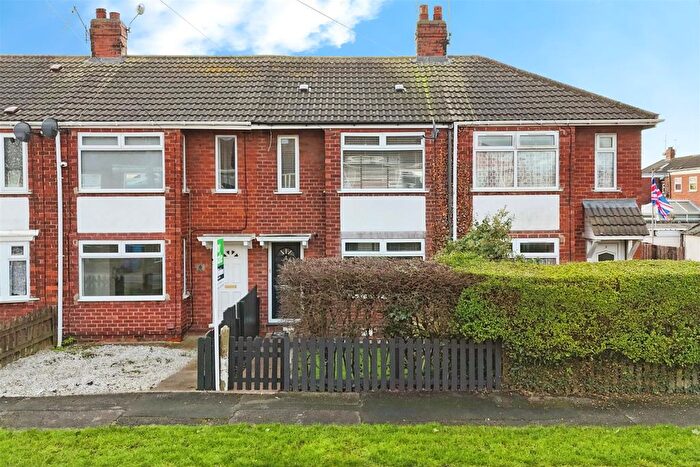
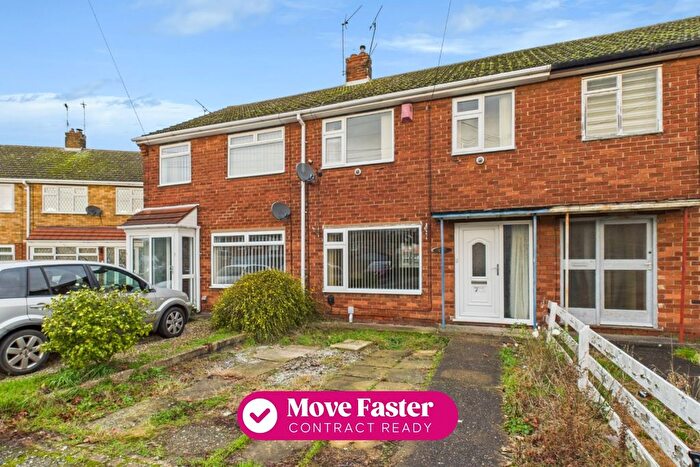
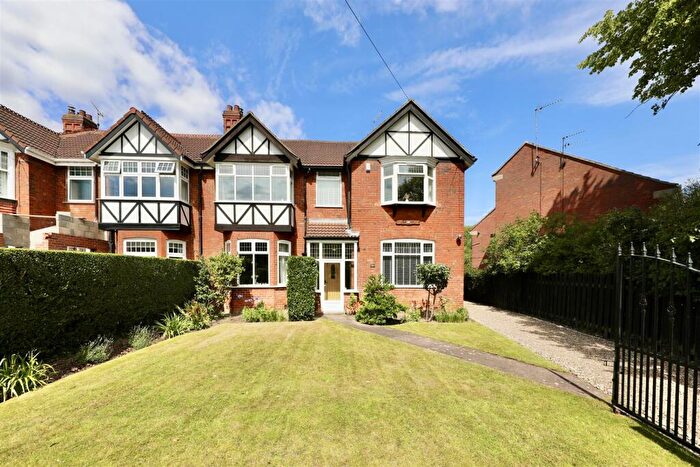
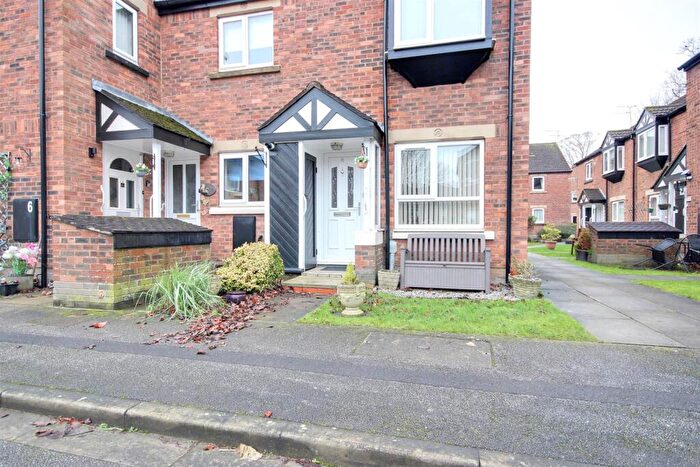
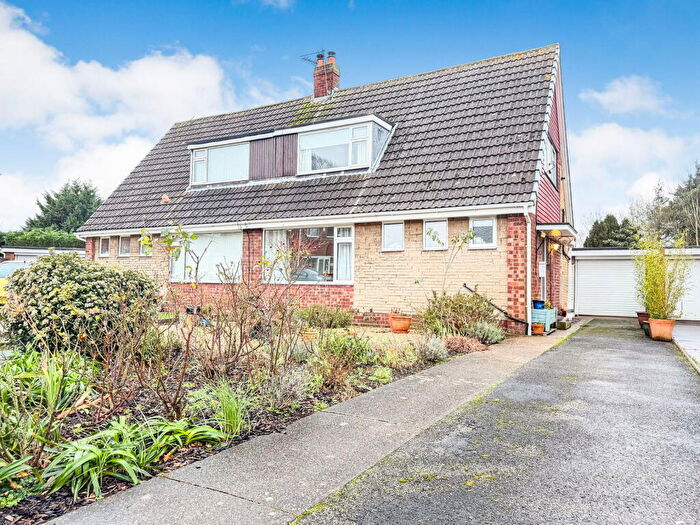
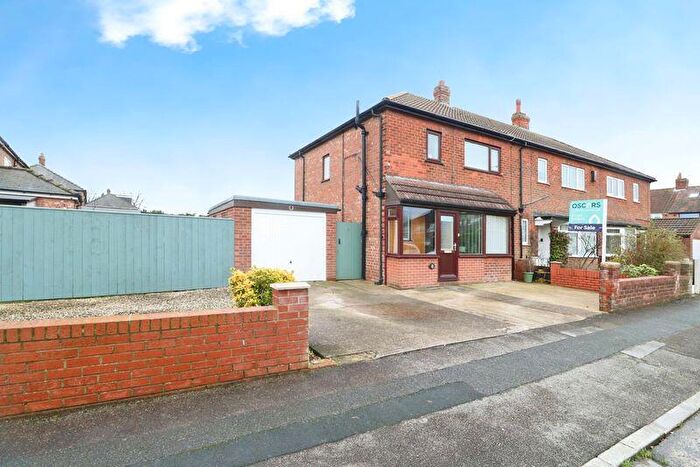
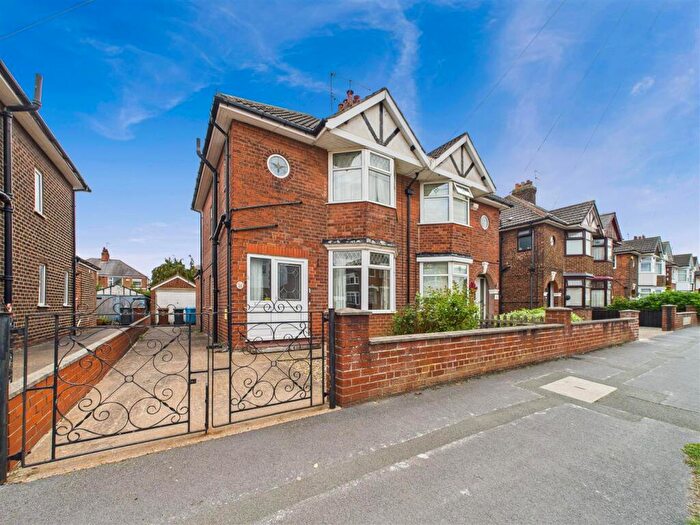
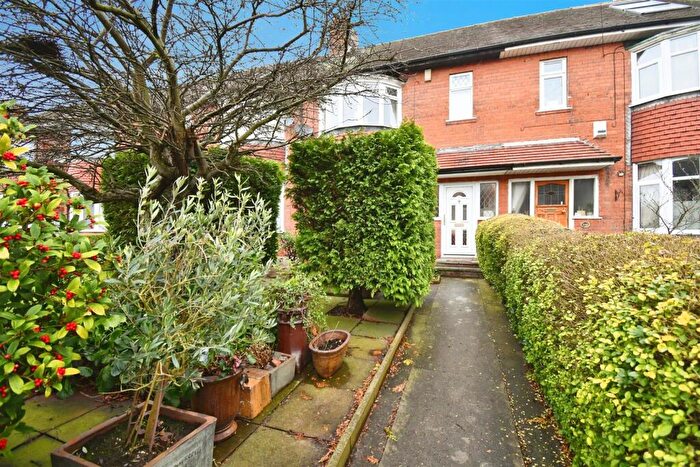
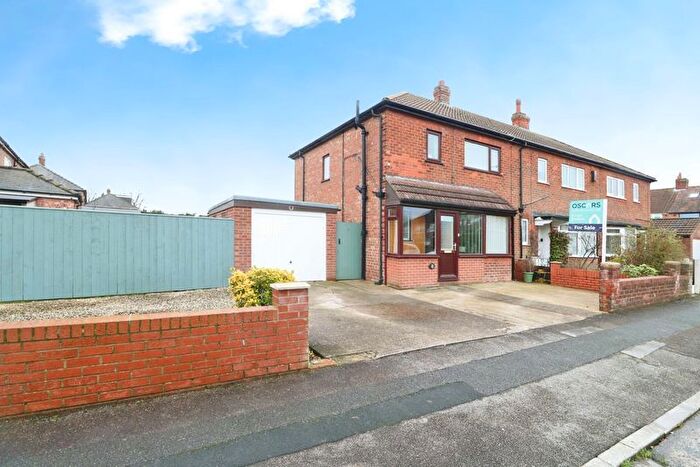
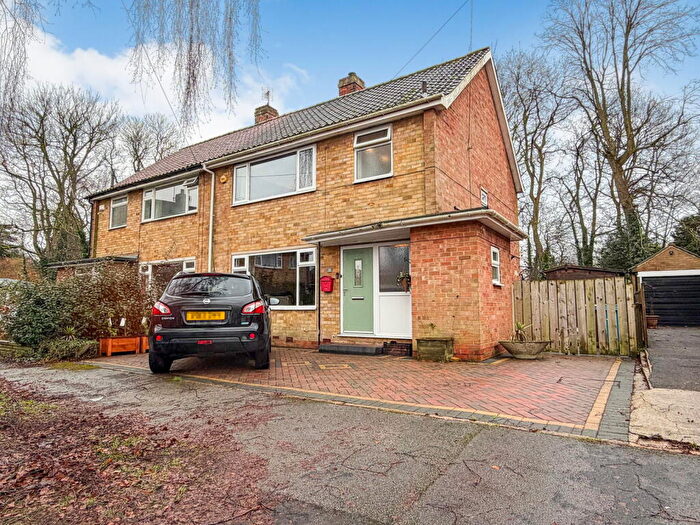
Properties in Cottingham South have an average house price of £151,589.00 and had 81 Property Transactions within the last 3 years¹.
Cottingham South is an area in Hull, East Riding of Yorkshire with 912 households², where the most expensive property was sold for £292,000.00.
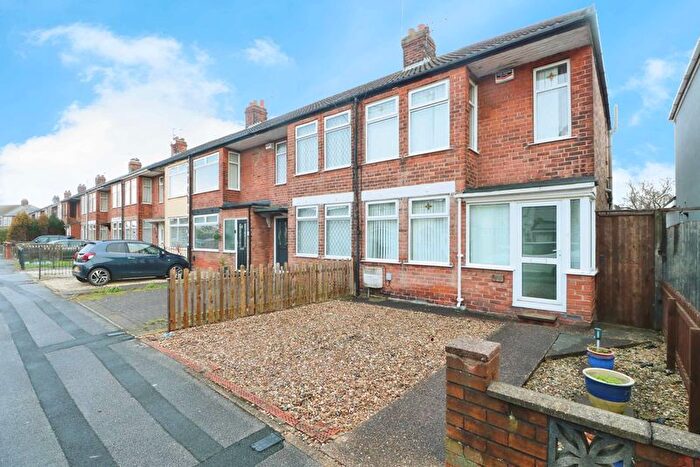
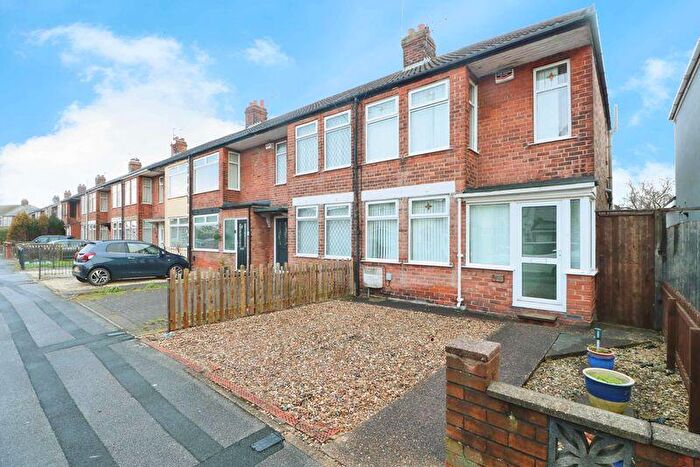
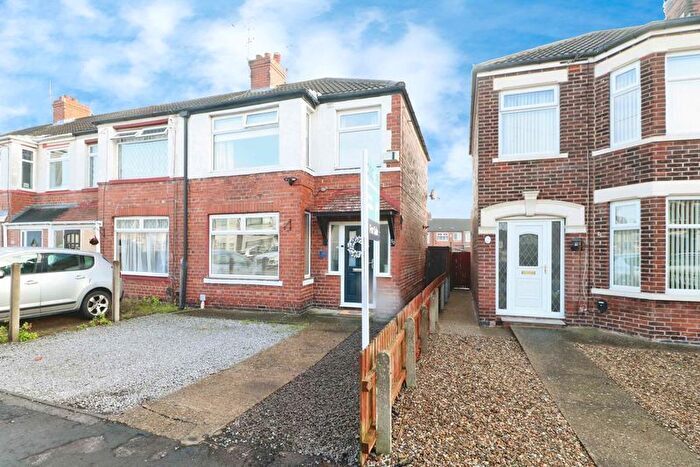
Properties for sale in Cottingham South
Roads and Postcodes in Cottingham South
Navigate through our locations to find the location of your next house in Cottingham South, Hull for sale or to rent.
| Streets | Postcodes |
|---|---|
| Asenby Walk | HU5 4SG |
| Askrigg Walk | HU5 4SA |
| Beverley Road | HU10 6EE HU10 6ED |
| Bishop Alcock Road | HU5 4RX |
| Bricknell Avenue | HU5 4QD HU5 4QE HU5 4TJ HU5 4TN |
| Dent Road | HU5 4RY HU5 4SB HU5 4SH HU5 4SL HU5 4SN HU5 4SR HU5 4ST HU5 4SU HU5 4RZ |
| Endike Lane | HU6 8TA HU6 8TE HU6 8TG |
| Faceby Walk | HU5 4TG |
| Golf Links Road | HU6 8RA HU6 8RB HU6 8RD HU6 8RE |
| Hackforth Walk | HU5 4SY |
| Hull Road | HU5 4AB HU5 4AH HU6 8QZ HU6 8RG |
| Inglemire Lane | HU6 8SJ HU6 8SL HU6 8SN |
| Keswick Gardens | HU6 8TB HU6 8TD |
| Lythe Avenue | HU5 4SZ HU5 4TD HU5 4TE |
| Main Street | HU10 6DS |
| Marske Walk | HU5 4RT |
| Ormesby Walk | HU5 4SS |
| Priory Road | HU5 5SE HU5 5SF |
| Reeth Walk | HU5 4RU |
| Sedbergh Avenue | HU5 4SE |
| Sherbrooke Avenue | HU5 4AG |
| Sinderby Walk | HU5 4SP |
| St Marys Avenue | HU5 4SX HU5 4TA HU5 4TB |
| Startforth Walk | HU5 4TL |
| Strathcona Avenue | HU5 4AD HU5 4AE |
| Thirlby Walk | HU5 4SD |
| Willerby Hill Business Park | HU10 6FE |
| Willerby Low Road | HU10 6EF |
| William Gee Drive | HU5 4AF |
| Woodbine Cottages | HU6 8TQ |
Transport near Cottingham South
- FAQ
- Price Paid By Year
- Property Type Price
Frequently asked questions about Cottingham South
What is the average price for a property for sale in Cottingham South?
The average price for a property for sale in Cottingham South is £151,589. This amount is 32% lower than the average price in Hull. There are 4,534 property listings for sale in Cottingham South.
What streets have the most expensive properties for sale in Cottingham South?
The streets with the most expensive properties for sale in Cottingham South are Bricknell Avenue at an average of £207,290, St Marys Avenue at an average of £199,900 and Golf Links Road at an average of £182,714.
What streets have the most affordable properties for sale in Cottingham South?
The streets with the most affordable properties for sale in Cottingham South are Ormesby Walk at an average of £113,500, Hackforth Walk at an average of £126,000 and Dent Road at an average of £128,120.
Which train stations are available in or near Cottingham South?
Some of the train stations available in or near Cottingham South are Cottingham, Hull and Hessle.
Property Price Paid in Cottingham South by Year
The average sold property price by year was:
| Year | Average Sold Price | Price Change |
Sold Properties
|
|---|---|---|---|
| 2025 | £150,318 | -1% |
22 Properties |
| 2024 | £151,582 | -1% |
28 Properties |
| 2023 | £152,498 | -13% |
31 Properties |
| 2022 | £172,230 | 13% |
38 Properties |
| 2021 | £149,904 | -3% |
41 Properties |
| 2020 | £154,231 | 15% |
24 Properties |
| 2019 | £130,850 | -22% |
36 Properties |
| 2018 | £159,151 | 15% |
46 Properties |
| 2017 | £134,847 | 10% |
42 Properties |
| 2016 | £121,150 | 7% |
31 Properties |
| 2015 | £112,477 | 7% |
24 Properties |
| 2014 | £104,241 | -14% |
39 Properties |
| 2013 | £118,696 | -6% |
38 Properties |
| 2012 | £125,857 | 15% |
7 Properties |
| 2011 | £107,281 | -6% |
30 Properties |
| 2010 | £114,016 | 2% |
27 Properties |
| 2009 | £111,647 | -2% |
17 Properties |
| 2008 | £113,722 | -8% |
13 Properties |
| 2007 | £123,138 | 12% |
37 Properties |
| 2006 | £108,263 | 7% |
41 Properties |
| 2005 | £100,571 | 5% |
39 Properties |
| 2004 | £95,326 | 29% |
35 Properties |
| 2003 | £67,924 | 16% |
32 Properties |
| 2002 | £57,209 | 15% |
33 Properties |
| 2001 | £48,603 | 9% |
38 Properties |
| 2000 | £44,096 | 8% |
49 Properties |
| 1999 | £40,671 | -1% |
38 Properties |
| 1998 | £41,259 | -8% |
42 Properties |
| 1997 | £44,675 | 8% |
26 Properties |
| 1996 | £41,157 | 10% |
23 Properties |
| 1995 | £36,948 | - |
24 Properties |
Property Price per Property Type in Cottingham South
Here you can find historic sold price data in order to help with your property search.
The average Property Paid Price for specific property types in the last three years are:
| Property Type | Average Sold Price | Sold Properties |
|---|---|---|
| Semi Detached House | £182,781.00 | 16 Semi Detached Houses |
| Detached House | £217,500.00 | 2 Detached Houses |
| Terraced House | £141,575.00 | 63 Terraced Houses |

