
Houses for sale & to rent in University, Hull
House Prices in University
Properties in University have an average house price of £137,894.00 and had 281 Property Transactions within the last 3 years¹.
University is an area in Hull, City of Kingston upon Hull with 3,859 households², where the most expensive property was sold for £460,000.00.
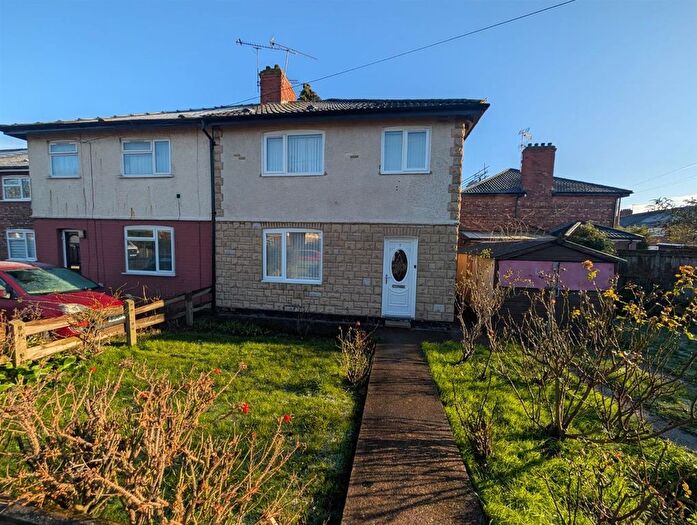
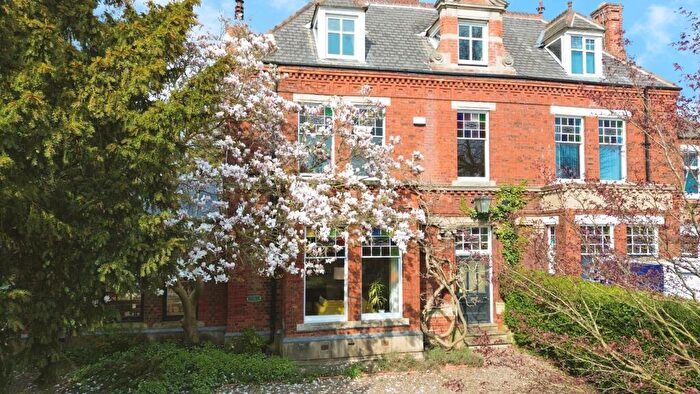
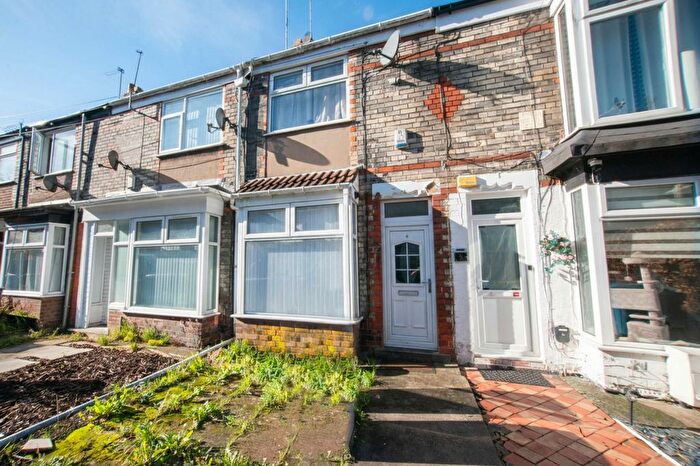
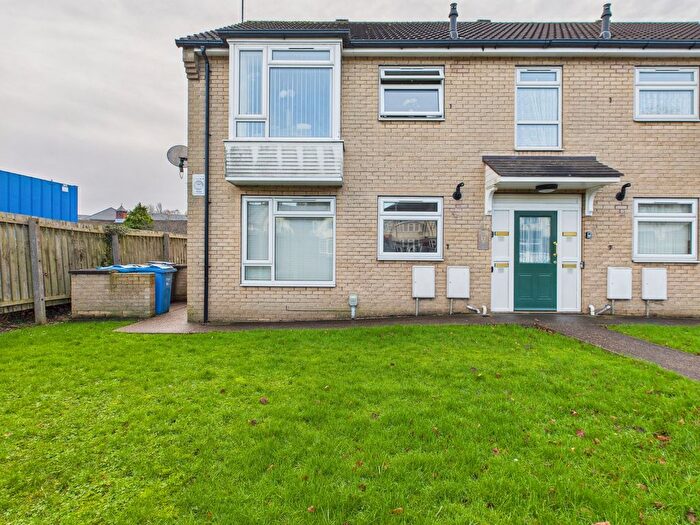
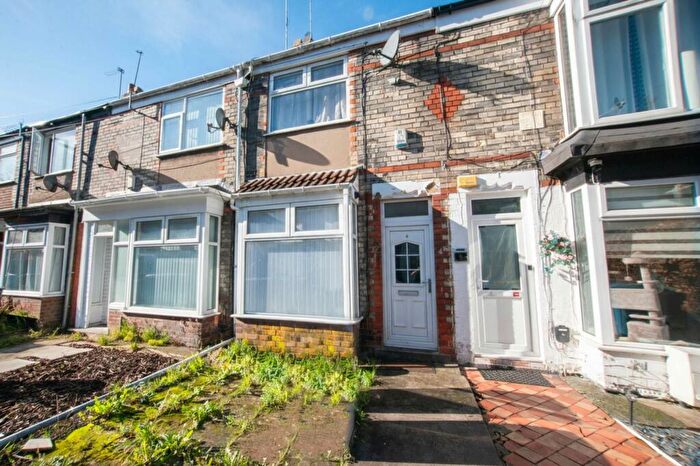
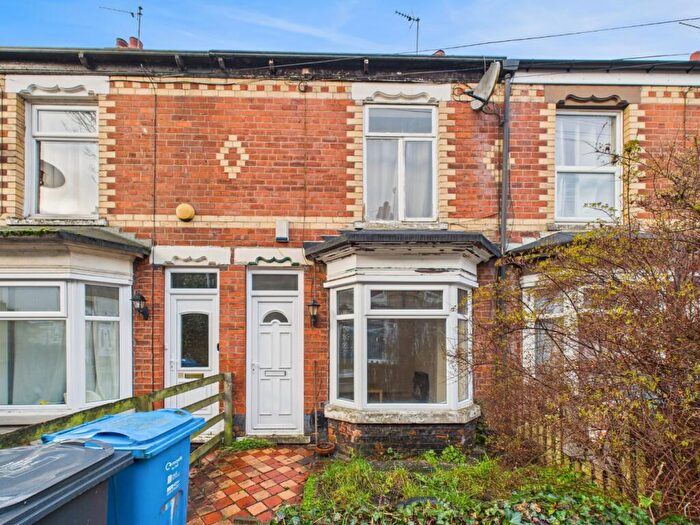
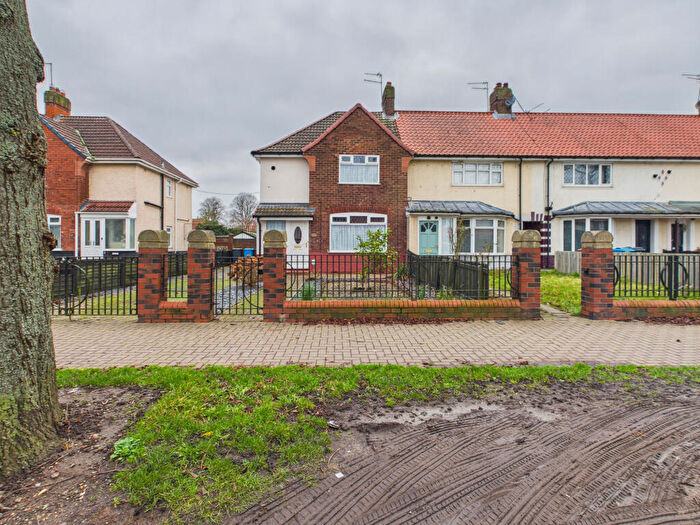
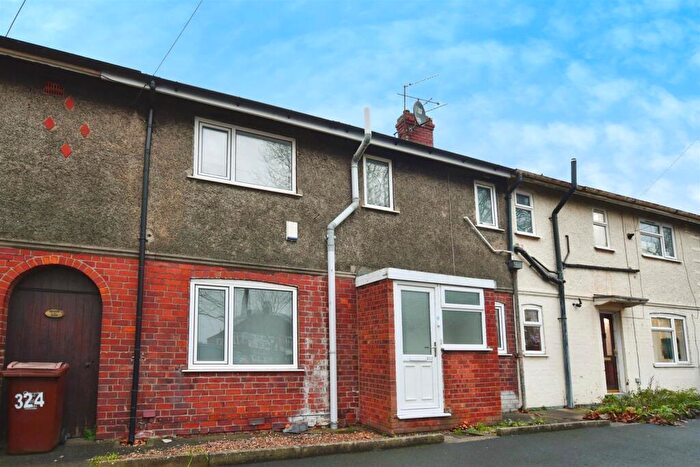
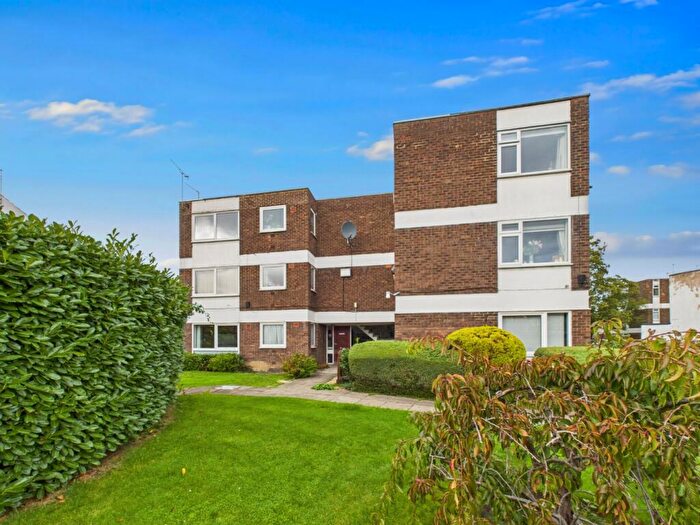
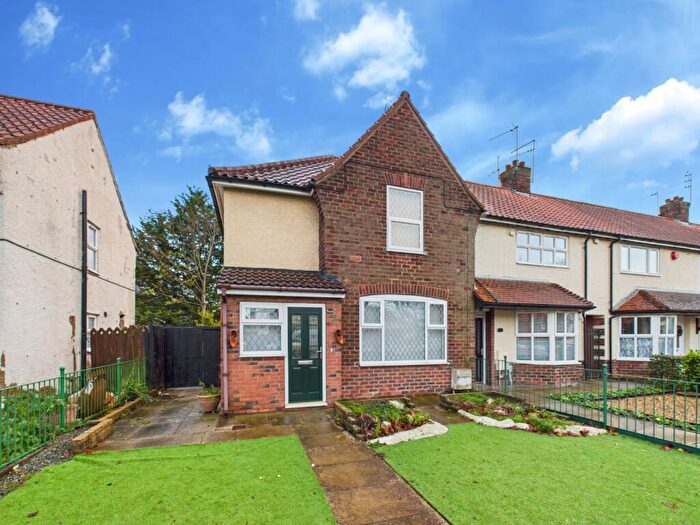
Properties for sale in University
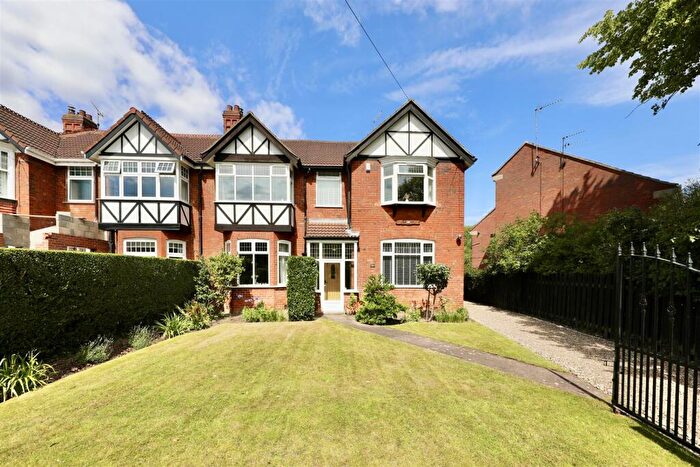


![]()
If you are looking to sell your house, let it out, or receive a property valuation, an expert can help you.
Click the button below to get started.

Roads and Postcodes in University
Navigate through our locations to find the location of your next house in University, Hull for sale or to rent.
Transport near University

- FAQ
- Price Paid By Year
- Property Type Price
Frequently asked questions about University
What is the average price for a property for sale in University?
The average price for a property for sale in University is £137,894. This amount is 3% higher than the average price in Hull. There are 965 property listings for sale in University.
What streets have the most expensive properties for sale in University?
The streets with the most expensive properties for sale in University are Catherine Mcauley Close at an average of £292,125, St Anthonys Close at an average of £258,000 and Marydene Drive at an average of £245,000.
What streets have the most affordable properties for sale in University?
The streets with the most affordable properties for sale in University are St Michaels Mount Flats at an average of £56,370, St Albans Mount at an average of £56,500 and Skipwith Close at an average of £71,500.
Which train stations are available in or near University?
Some of the train stations available in or near University are Cottingham, Hull and Hessle.
Property Price Paid in University by Year
The average sold property price by year was:
| Year | Average Sold Price | Price Change |
Sold Properties
|
|---|---|---|---|
| 2025 | £139,591 | 4% |
81 Properties |
| 2024 | £133,476 | -5% |
95 Properties |
| 2023 | £140,582 | -4% |
105 Properties |
| 2022 | £146,137 | 20% |
105 Properties |
| 2021 | £116,282 | 1% |
127 Properties |
| 2020 | £115,262 | 1% |
96 Properties |
| 2019 | £114,629 | 10% |
108 Properties |
| 2018 | £102,639 | -16% |
130 Properties |
| 2017 | £119,484 | 11% |
95 Properties |
| 2016 | £105,970 | 3% |
105 Properties |
| 2015 | £102,556 | 11% |
106 Properties |
| 2014 | £91,494 | -5% |
87 Properties |
| 2013 | £95,839 | 4% |
70 Properties |
| 2012 | £92,482 | 4% |
77 Properties |
| 2011 | £89,000 | -3% |
72 Properties |
| 2010 | £91,822 | -7% |
66 Properties |
| 2009 | £97,817 | -24% |
64 Properties |
| 2008 | £120,829 | 6% |
95 Properties |
| 2007 | £113,923 | 15% |
194 Properties |
| 2006 | £96,428 | 13% |
215 Properties |
| 2005 | £83,511 | 10% |
160 Properties |
| 2004 | £75,500 | 16% |
173 Properties |
| 2003 | £63,410 | -11% |
197 Properties |
| 2002 | £70,138 | 39% |
244 Properties |
| 2001 | £42,749 | 17% |
150 Properties |
| 2000 | £35,300 | -17% |
99 Properties |
| 1999 | £41,372 | 14% |
90 Properties |
| 1998 | £35,450 | -13% |
100 Properties |
| 1997 | £40,062 | 11% |
90 Properties |
| 1996 | £35,682 | -6% |
78 Properties |
| 1995 | £37,724 | - |
80 Properties |
Property Price per Property Type in University
Here you can find historic sold price data in order to help with your property search.
The average Property Paid Price for specific property types in the last three years are:
| Property Type | Average Sold Price | Sold Properties |
|---|---|---|
| Flat | £71,006.00 | 22 Flats |
| Semi Detached House | £162,091.00 | 81 Semi Detached Houses |
| Detached House | £267,218.00 | 16 Detached Houses |
| Terraced House | £122,107.00 | 162 Terraced Houses |