
Houses for sale & to rent in York, East Riding of Yorkshire
House Prices in York
Properties in York have an average house price of £298k and had 1,815 Property Transactions within the last 3 years.¹
York is an area in East Riding of Yorkshire with 14,750 households², where the most expensive property was sold for £1.1M.
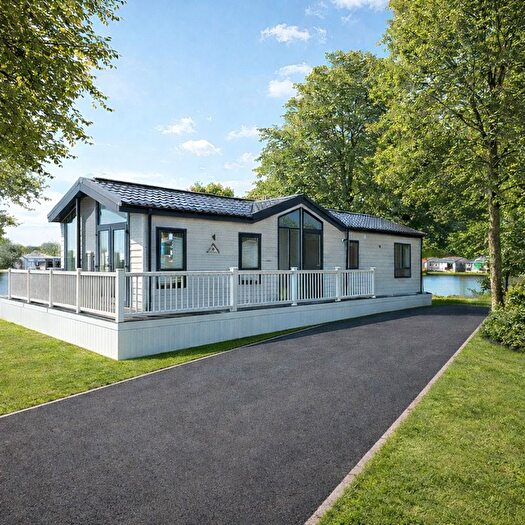
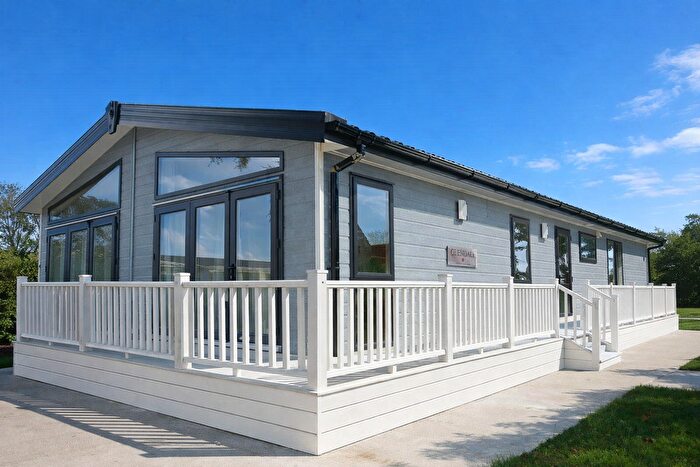
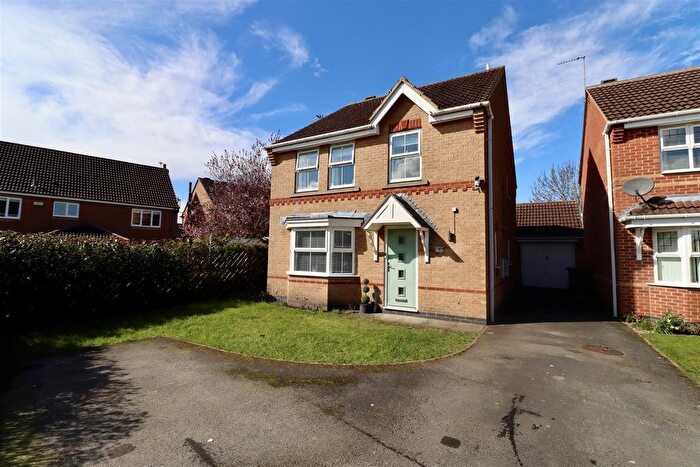
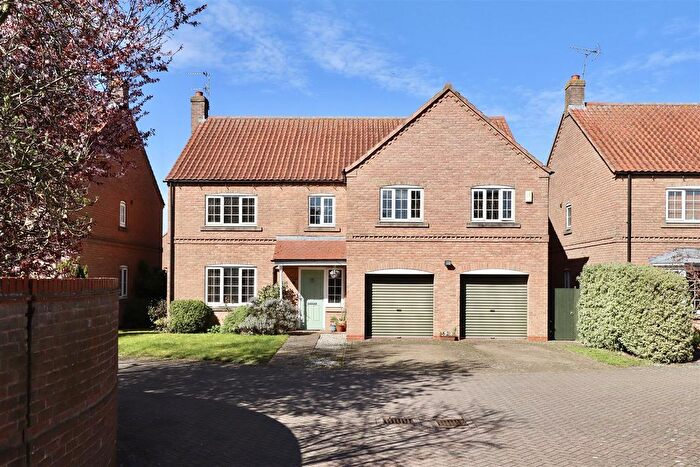
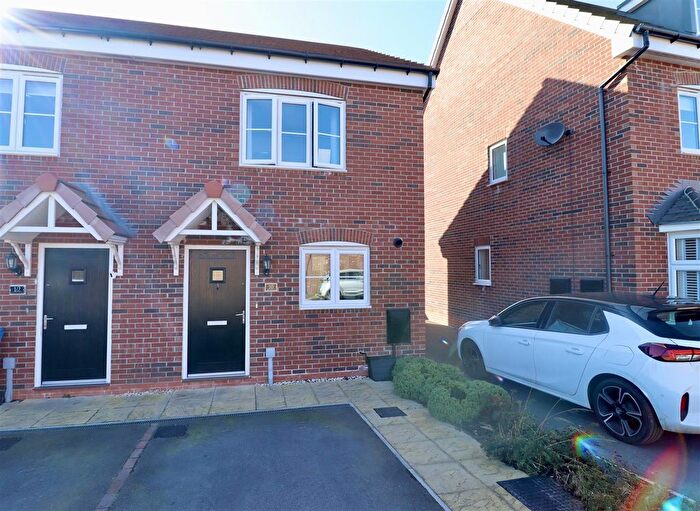
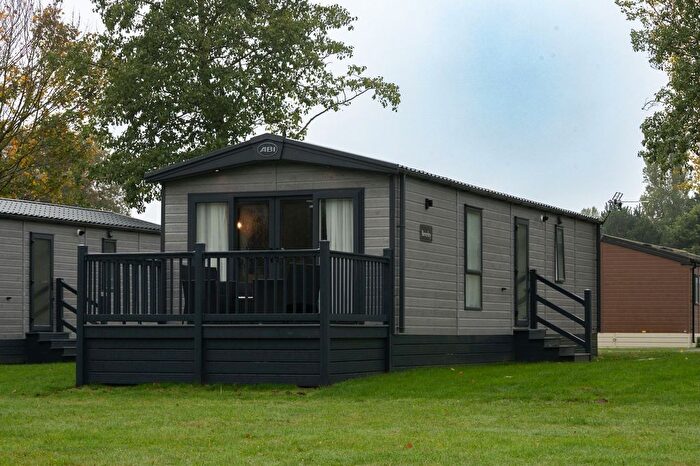
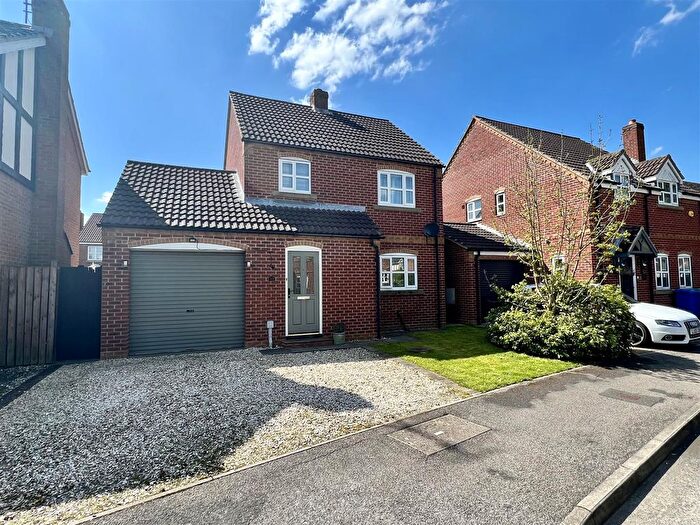
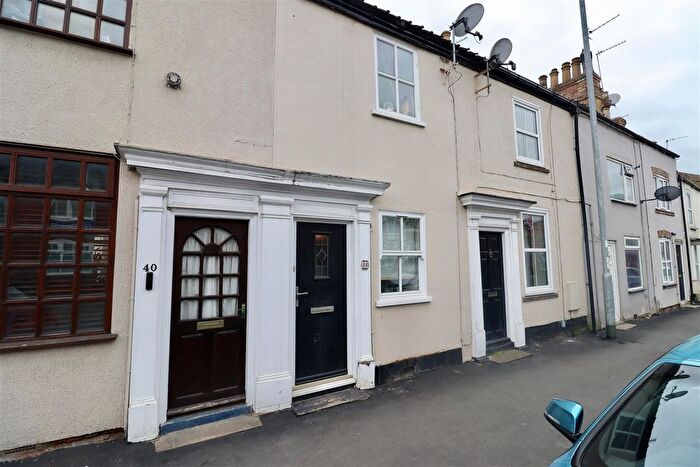
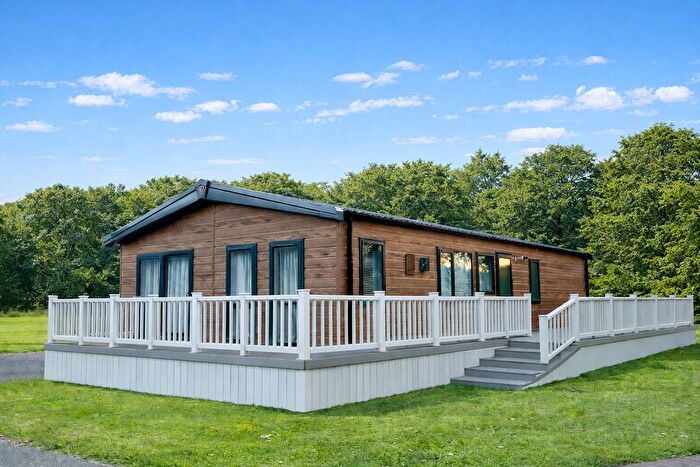
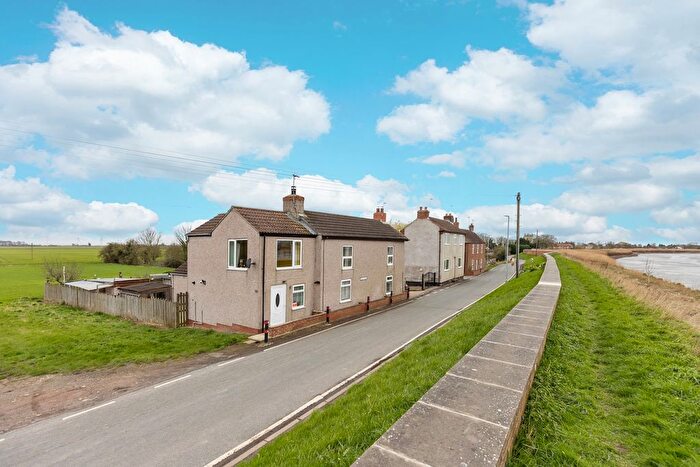
Properties for sale in York
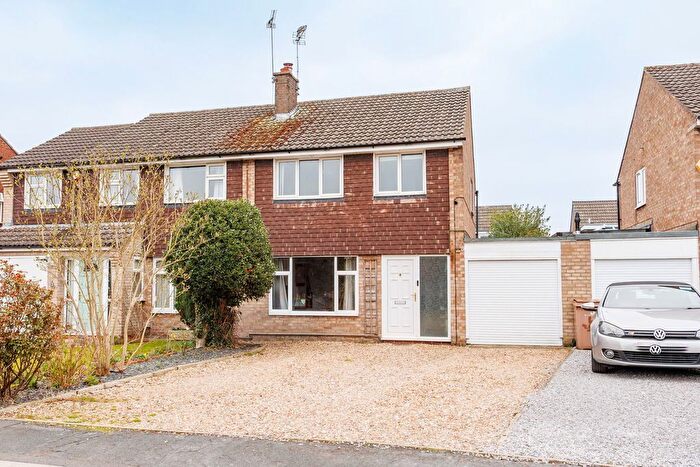
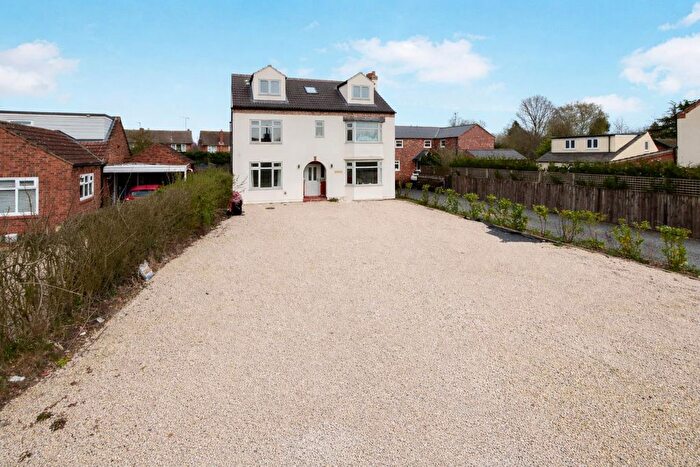
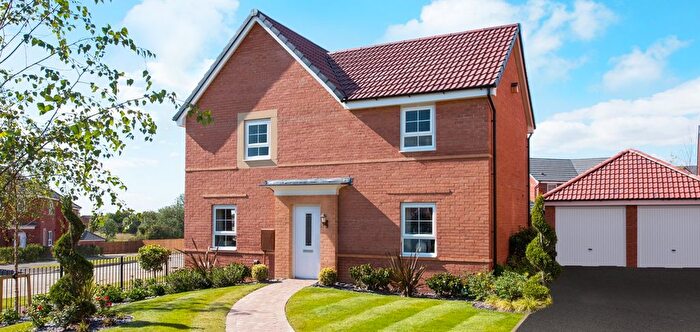
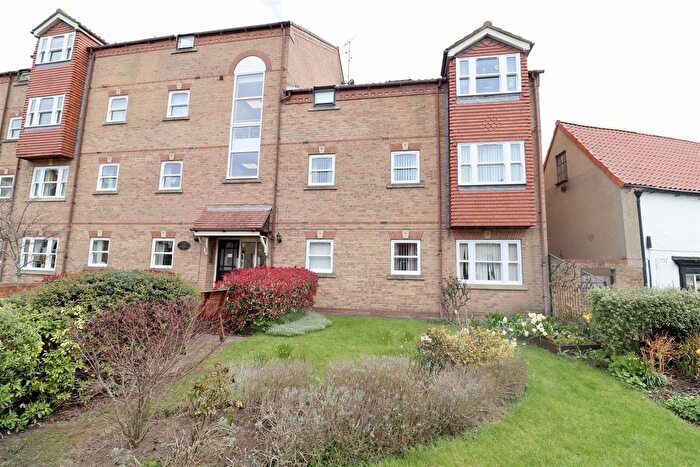
![]()
If you are looking to sell your house, let it out, or receive a property valuation, an expert can help you.
Click the button below to get started.
Neighbourhoods in York
Navigate through our locations to find the location of your next house in York, East Riding of Yorkshire for sale or to rent.
Transport in York
Please see below transportation links in this area:
-
 Howden Station
 -
Eastrington Station
-
Wressle Station
-
Gilberdyke Station
-
Broomfleet Station
-
Saltmarshe Station
-
York Station
-
Hutton Cranswick Station
-
Arram Station
-
Selby Station
- FAQ
- Price Paid By Year
- Property Type Price
Frequently asked questions about York
What is the average price for a property for sale in York?
The average price for a property for sale in York is £298,223. This amount is 24% higher than the average price in East Riding of Yorkshire. There are 5,859 property listings for sale in York.
What locations have the most expensive properties for sale in York?
The locations with the most expensive properties for sale in York are Wolds Weighton at an average of £302,301 and Pocklington Provincial at an average of £299,398.
What locations have the most affordable properties for sale in York?
The locations with the most affordable properties for sale in York are Howdenshire at an average of £275,796 and Beverley Rural at an average of £293,913.
Which train stations are available in or near York?
Some of the train stations available in or near York are Howden, Eastrington and Wressle.
Property Price Paid in York by Year
The average sold property price by year was:
| Year | Average Sold Price | Price Change |
Sold Properties
|
|---|---|---|---|
| 2026 | £333,900 | 9% |
5 Properties |
| 2025 | £303,900 | 4% |
608 Properties |
| 2024 | £290,741 | -3% |
616 Properties |
| 2023 | £299,893 | -1% |
586 Properties |
| 2022 | £303,882 | 4% |
734 Properties |
| 2021 | £290,869 | 7% |
913 Properties |
| 2020 | £271,463 | 6% |
873 Properties |
| 2019 | £254,050 | 0,4% |
998 Properties |
| 2018 | £252,974 | -1% |
999 Properties |
| 2017 | £256,447 | 11% |
874 Properties |
| 2016 | £227,899 | 0,4% |
796 Properties |
| 2015 | £226,878 | 4% |
768 Properties |
| 2014 | £218,308 | 6% |
756 Properties |
| 2013 | £206,211 | 6% |
606 Properties |
| 2012 | £193,213 | -6% |
495 Properties |
| 2011 | £204,434 | 2% |
481 Properties |
| 2010 | £199,914 | 4% |
501 Properties |
| 2009 | £192,915 | -12% |
460 Properties |
| 2008 | £216,625 | 1% |
448 Properties |
| 2007 | £214,821 | 10% |
882 Properties |
| 2006 | £192,488 | 1% |
953 Properties |
| 2005 | £191,177 | 7% |
766 Properties |
| 2004 | £177,683 | 16% |
901 Properties |
| 2003 | £149,293 | 9% |
861 Properties |
| 2002 | £135,994 | 26% |
1,076 Properties |
| 2001 | £100,022 | 13% |
1,128 Properties |
| 2000 | £86,852 | 8% |
991 Properties |
| 1999 | £79,996 | 9% |
1,017 Properties |
| 1998 | £72,766 | -1% |
792 Properties |
| 1997 | £73,627 | 11% |
759 Properties |
| 1996 | £65,580 | - |
694 Properties |
| 1995 | £65,548 | - |
583 Properties |
Property Price per Property Type in York
Here you can find historic sold price data in order to help with your property search.
The average Property Paid Price for specific property types in the last three years are:
| Property Type | Average Sold Price | Sold Properties |
|---|---|---|
| Semi Detached House | £242,035.00 | 579 Semi Detached Houses |
| Terraced House | £207,753.00 | 290 Terraced Houses |
| Detached House | £385,544.00 | 858 Detached Houses |
| Flat | £114,676.00 | 88 Flats |