
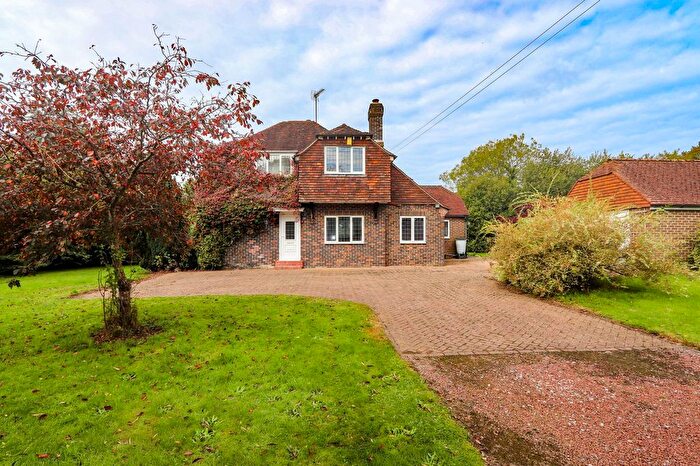
Houses for sale & to rent in Brede Valley, Battle
House Prices in Brede Valley
Properties in Brede Valley have an average house price of £743,333.00 and had 9 Property Transactions within the last 3 years¹.
Brede Valley is an area in Battle, East Sussex with 116 households², where the most expensive property was sold for £1,380,000.00.
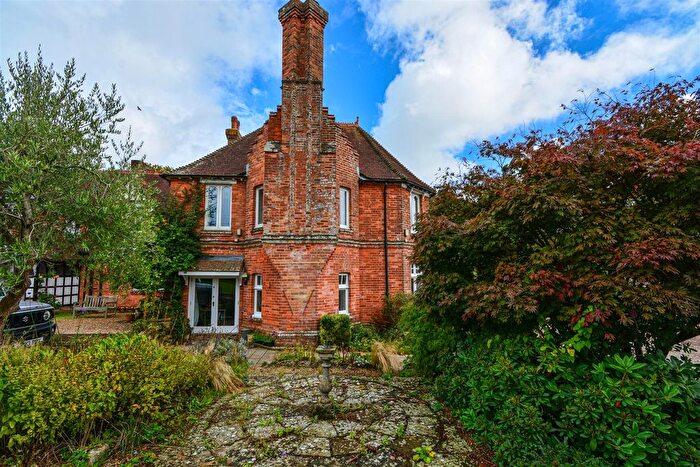
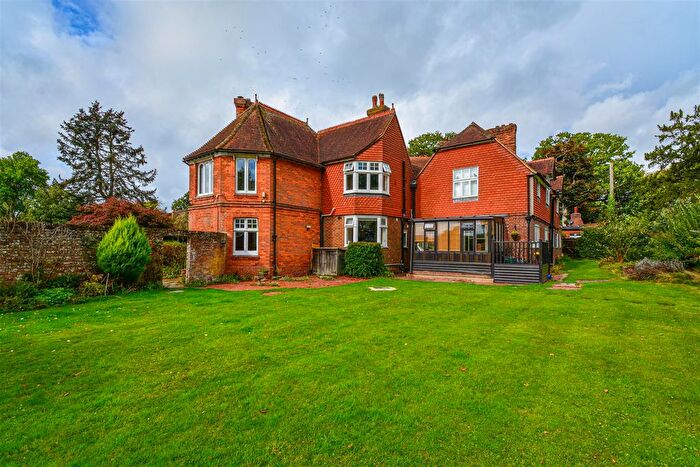
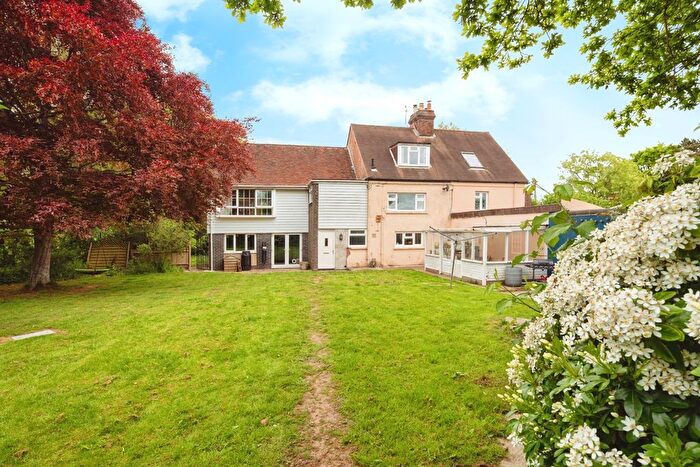
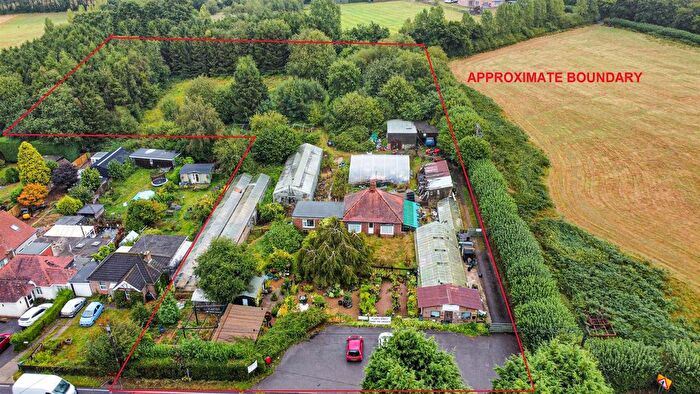
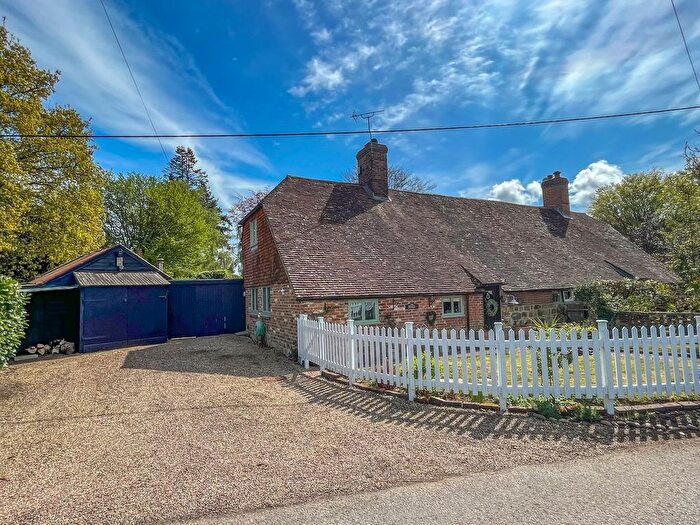
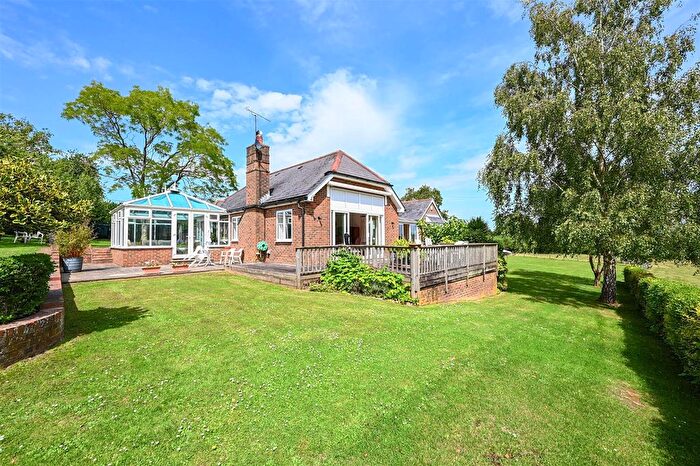
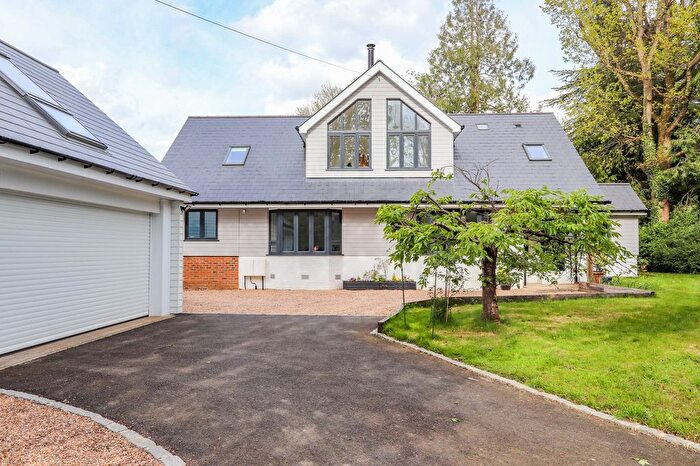
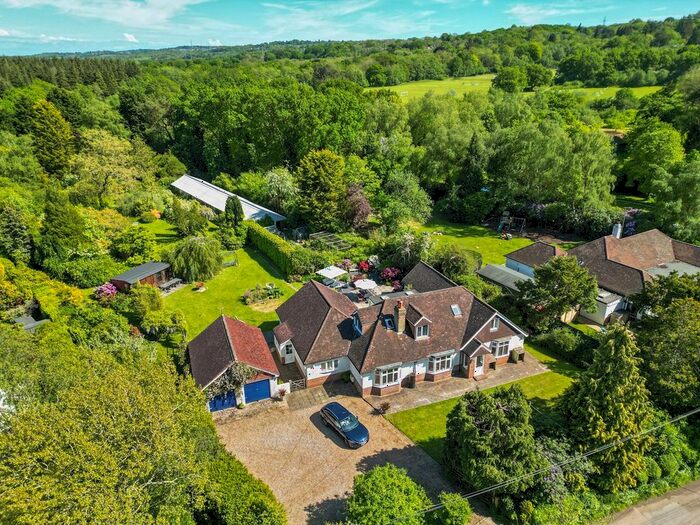
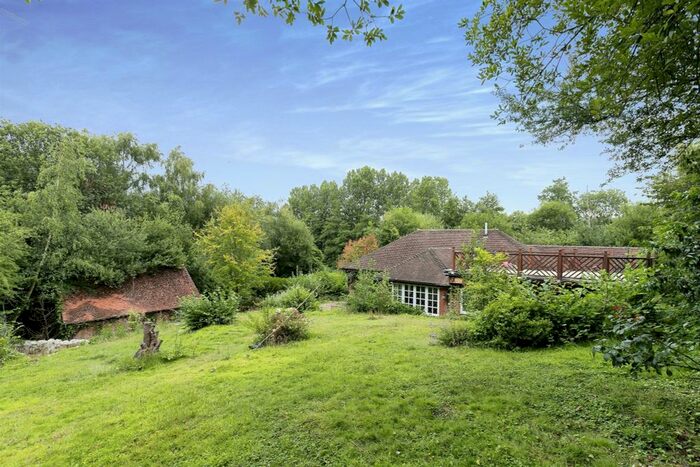
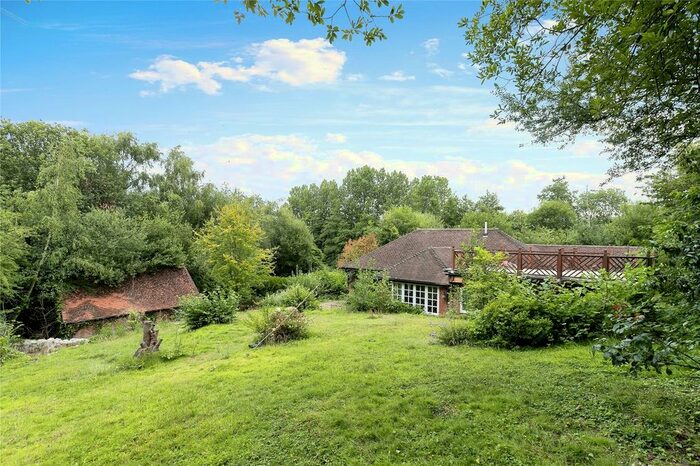
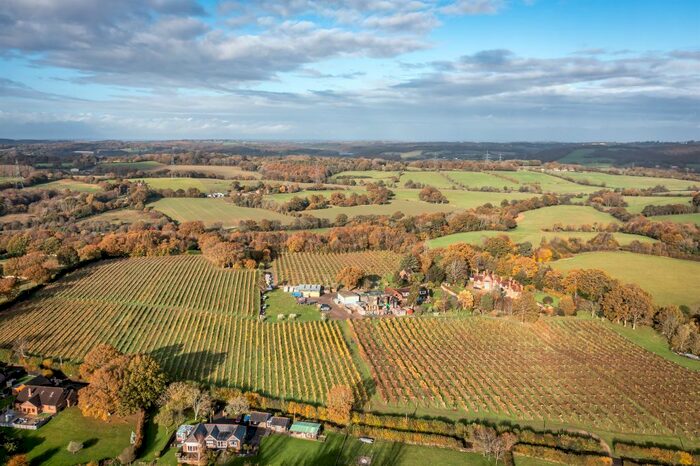
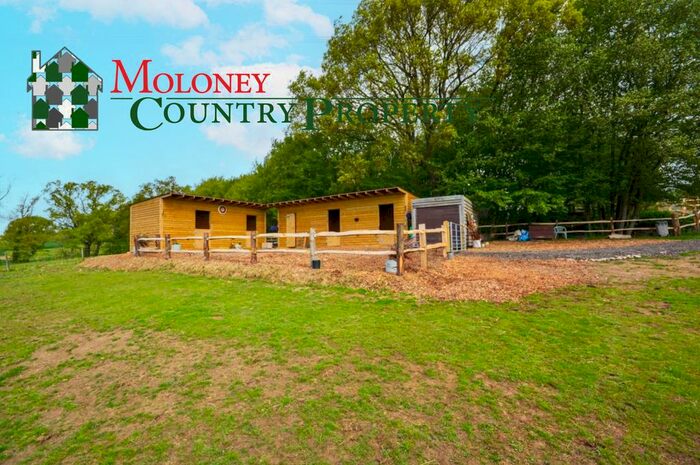
Previously listed properties in Brede Valley
![]()
If you are looking to sell your house, let it out, or receive a property valuation, an expert can help you.
Click the button below to get started.


Roads and Postcodes in Brede Valley
Navigate through our locations to find the location of your next house in Brede Valley, Battle for sale or to rent.
| Streets | Postcodes |
|---|---|
| Bluemans Lane | TN33 0SE |
| Harts Green | TN33 0RS TN33 0RT |
| Kent Street | TN33 0SA TN33 0SD TN33 0SF TN33 0SG |
| Moat Lane | TN33 0RY TN33 0RZ |
| Plumtree Cottages | TN33 0RX |
| Sprays Lane | TN33 0RU |
Transport near Brede Valley

- FAQ
- Price Paid By Year
- Property Type Price
Frequently asked questions about Brede Valley
What is the average price for a property for sale in Brede Valley?
The average price for a property for sale in Brede Valley is £743,333. This amount is 54% higher than the average price in Battle. There are 25 property listings for sale in Brede Valley.
What streets have the most expensive properties for sale in Brede Valley?
The street with the most expensive properties for sale in Brede Valley is Harts Green at an average of £1,380,000.
What streets have the most affordable properties for sale in Brede Valley?
The street with the most affordable properties for sale in Brede Valley is Moat Lane at an average of £913,750.
Which train stations are available in or near Brede Valley?
Some of the train stations available in or near Brede Valley are Battle, Doleham and Crowhurst.
Property Price Paid in Brede Valley by Year
The average sold property price by year was:
| Year | Average Sold Price | Price Change |
Sold Properties
|
|---|---|---|---|
| 2025 | £965,000 | 25% |
2 Properties |
| 2023 | £725,000 | 11% |
3 Properties |
| 2022 | £646,250 | 11% |
4 Properties |
| 2021 | £572,000 | -19% |
5 Properties |
| 2020 | £680,000 | 26% |
2 Properties |
| 2019 | £501,415 | -13% |
4 Properties |
| 2018 | £565,000 | 20% |
6 Properties |
| 2017 | £450,416 | 2% |
3 Properties |
| 2016 | £440,916 | 19% |
6 Properties |
| 2015 | £357,666 | -8% |
3 Properties |
| 2014 | £384,921 | -3% |
7 Properties |
| 2013 | £395,000 | -21% |
4 Properties |
| 2012 | £479,333 | -27% |
3 Properties |
| 2011 | £610,000 | 3% |
6 Properties |
| 2010 | £594,453 | 41% |
5 Properties |
| 2009 | £349,993 | 40% |
5 Properties |
| 2008 | £210,000 | -75% |
1 Property |
| 2007 | £366,966 | -23% |
6 Properties |
| 2006 | £452,357 | 25% |
7 Properties |
| 2005 | £338,500 | 5% |
4 Properties |
| 2004 | £322,000 | -9% |
5 Properties |
| 2003 | £350,000 | 11% |
2 Properties |
| 2002 | £313,000 | 33% |
3 Properties |
| 2001 | £209,306 | 14% |
8 Properties |
| 2000 | £181,000 | 19% |
5 Properties |
| 1999 | £147,000 | -25% |
3 Properties |
| 1998 | £183,100 | 31% |
10 Properties |
| 1997 | £127,062 | 4% |
8 Properties |
| 1996 | £122,500 | 10% |
4 Properties |
| 1995 | £110,033 | - |
3 Properties |
Property Price per Property Type in Brede Valley
Here you can find historic sold price data in order to help with your property search.
The average Property Paid Price for specific property types in the last three years are:
| Property Type | Average Sold Price | Sold Properties |
|---|---|---|
| Detached House | £743,333.00 | 9 Detached Houses |