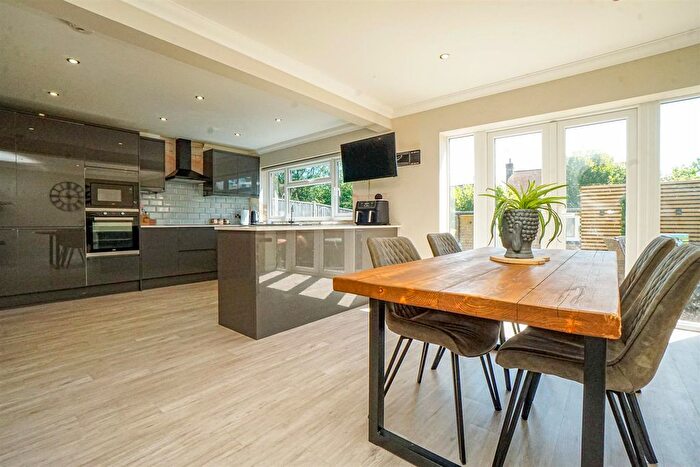
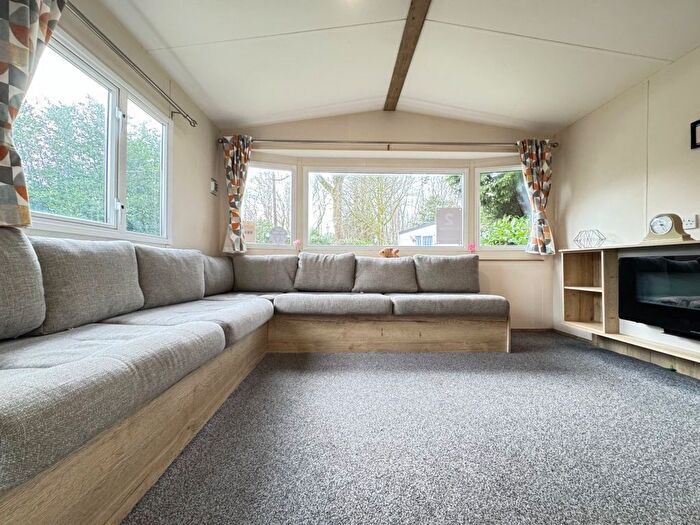
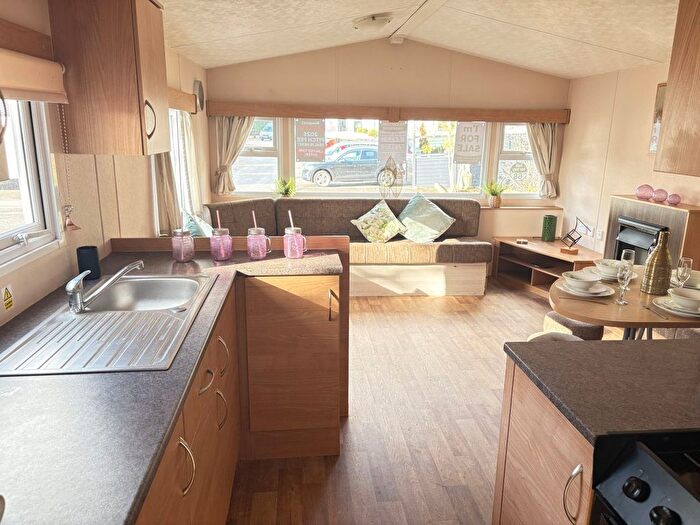
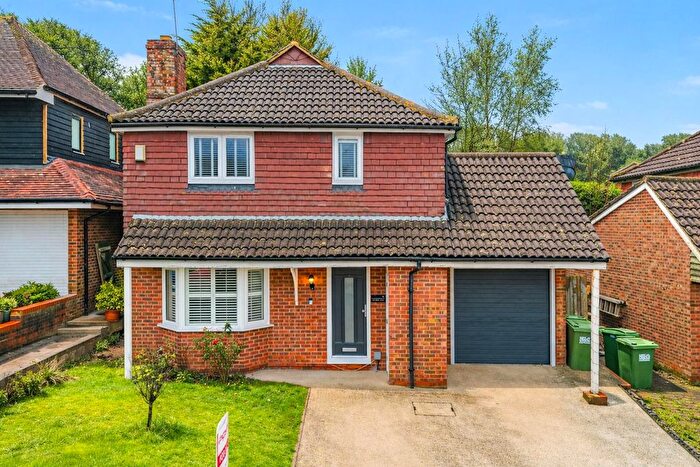
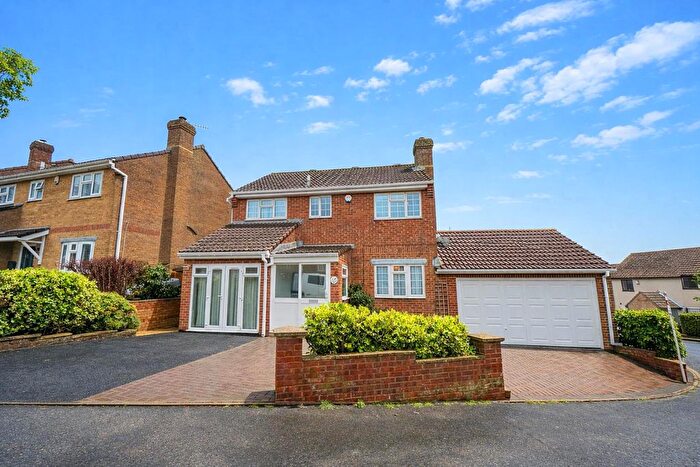
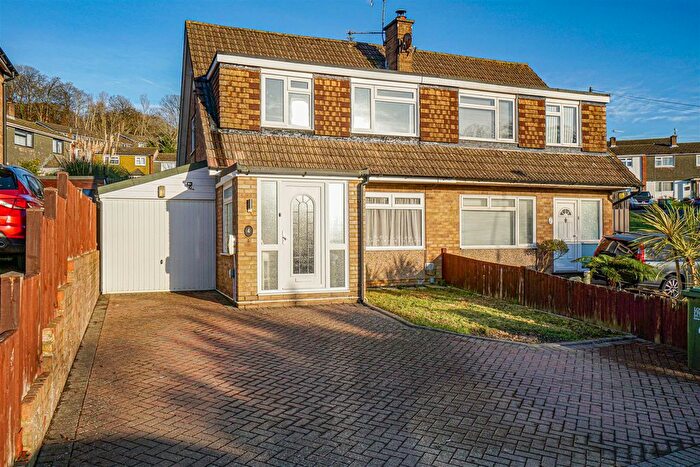
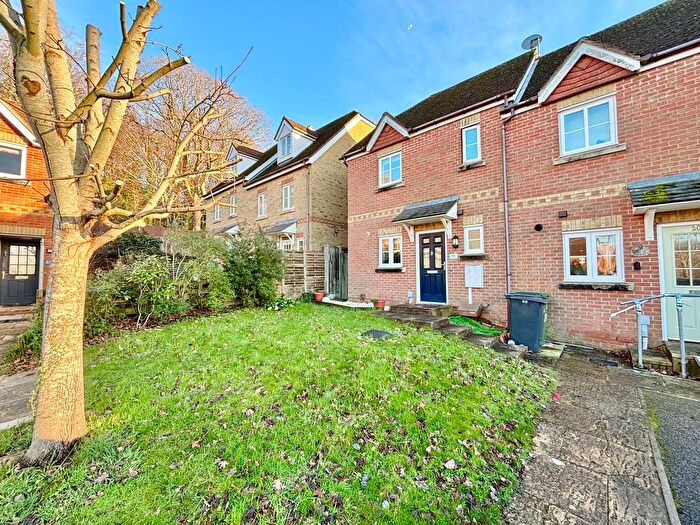
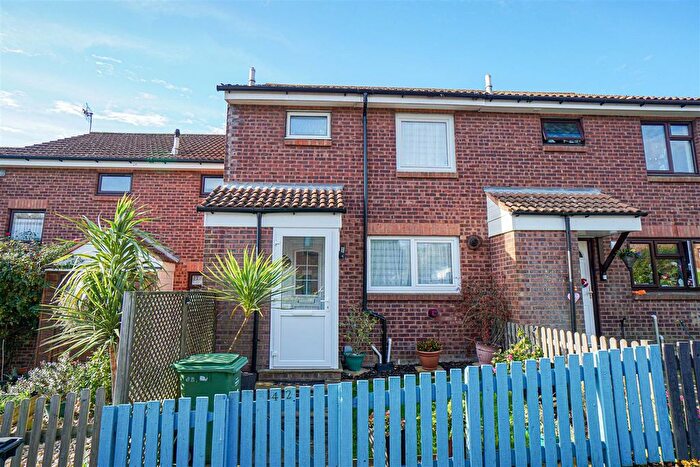
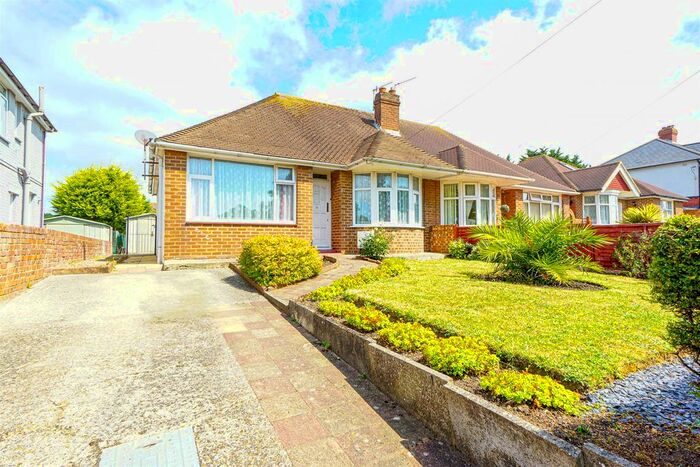
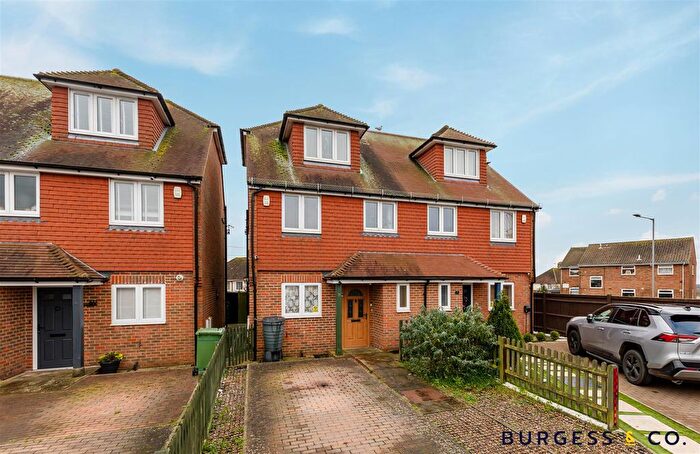
Houses for sale & to rent in Ashdown, St Leonards-on-sea
House Prices in Ashdown
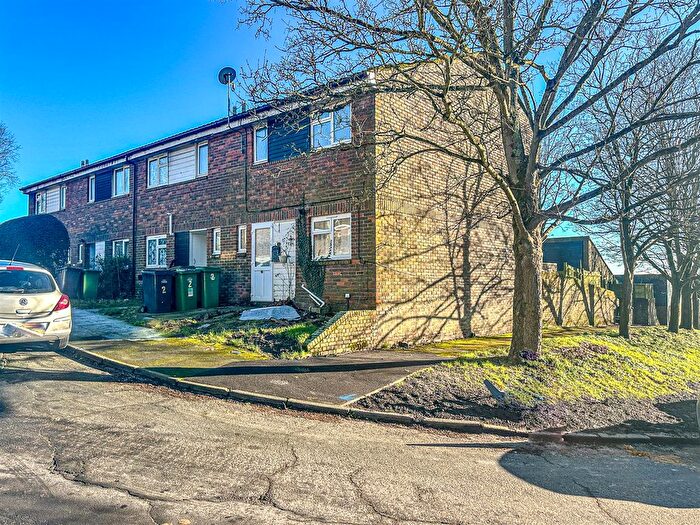
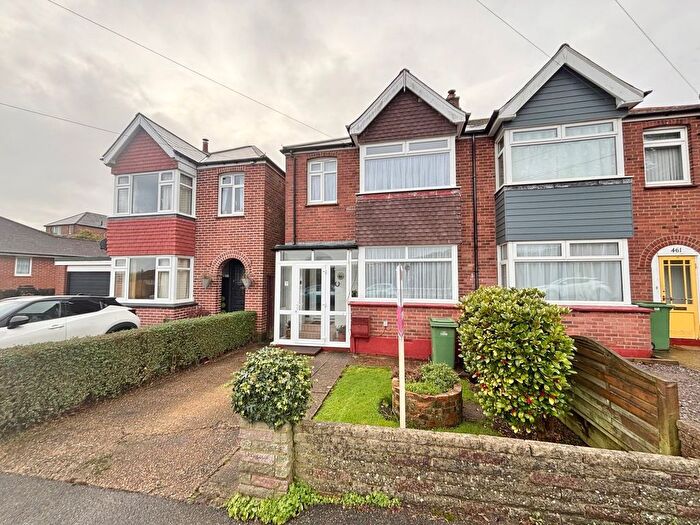
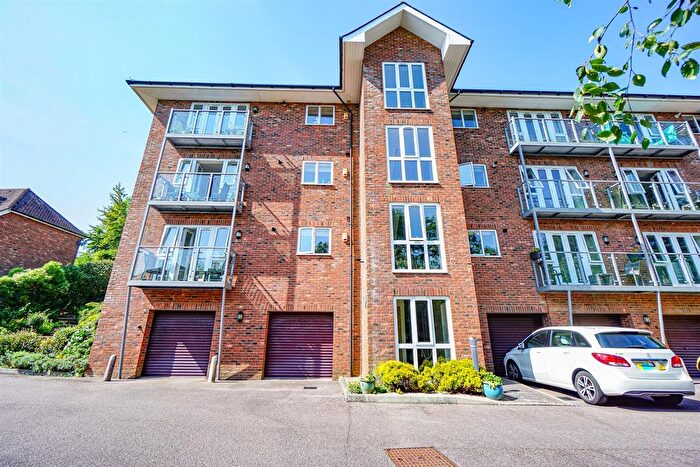
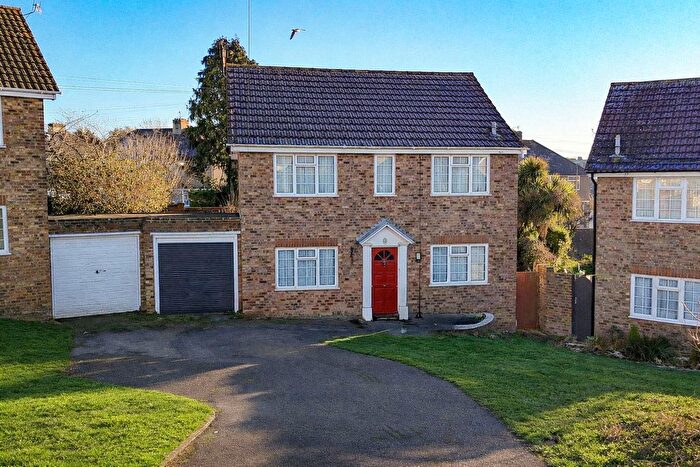
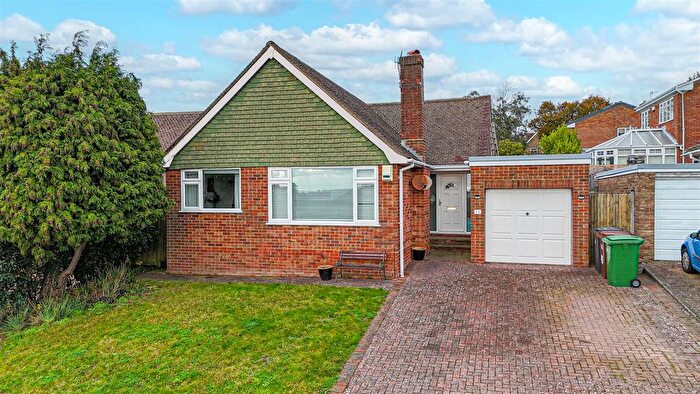
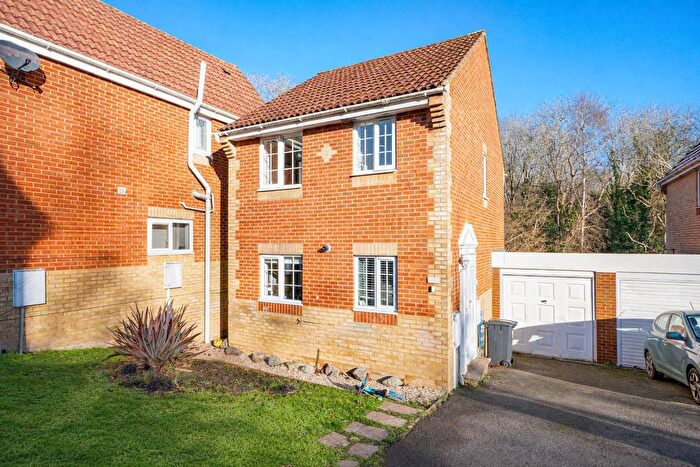
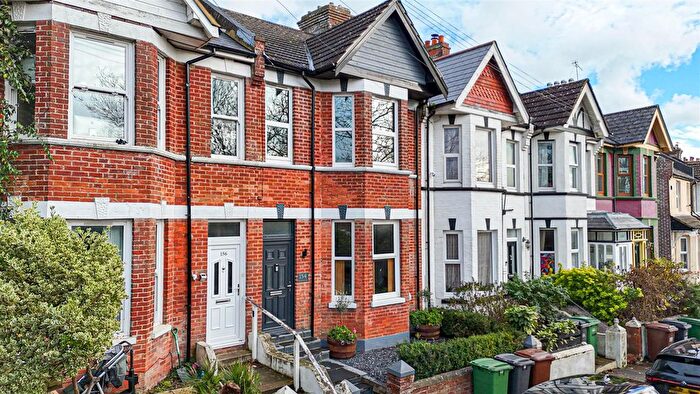
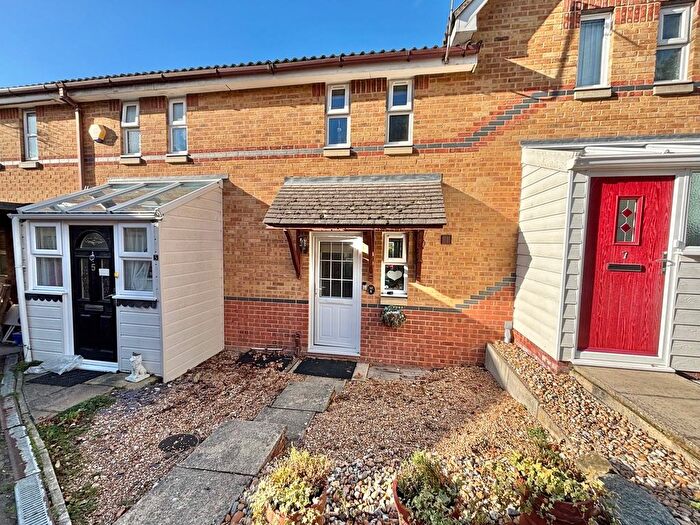
Properties in Ashdown have an average house price of £367,119.00 and had 277 Property Transactions within the last 3 years¹.
Ashdown is an area in St Leonards-on-sea, East Sussex with 2,462 households², where the most expensive property was sold for £845,000.00.
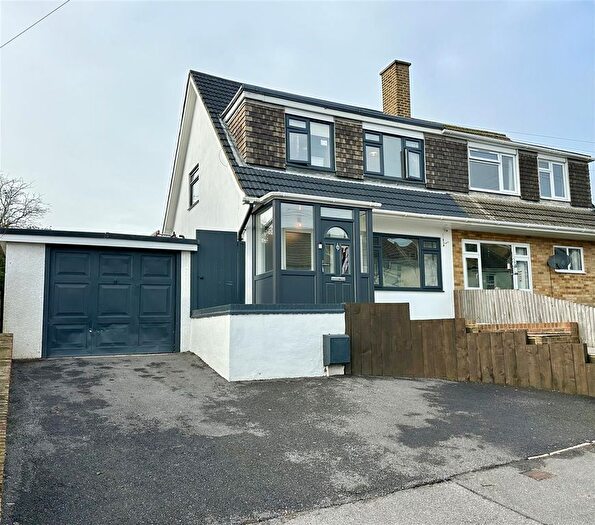
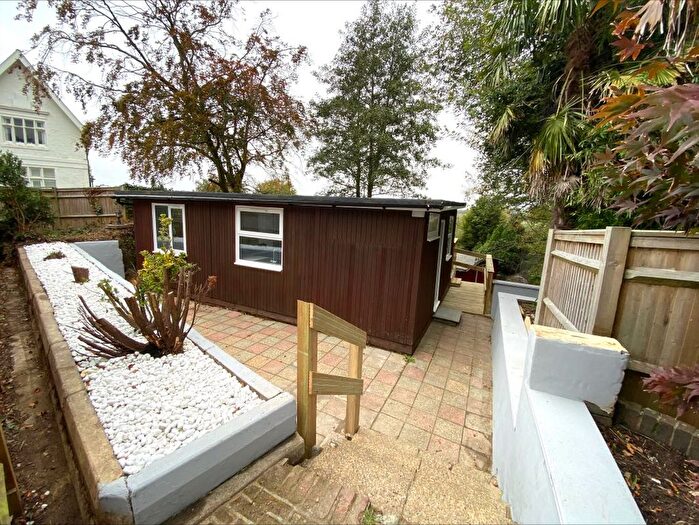
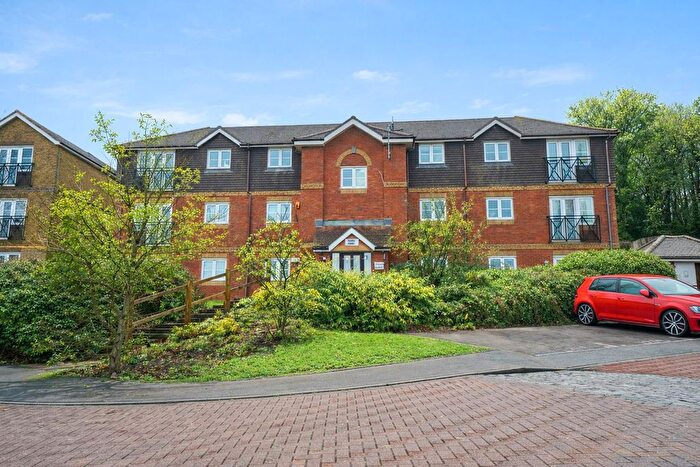
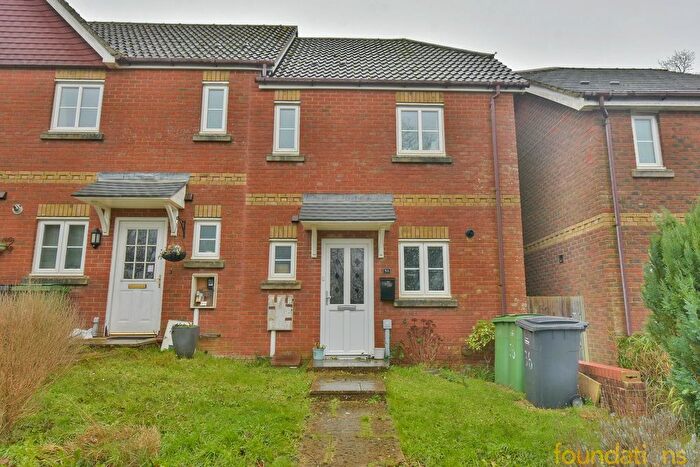
Properties for sale in Ashdown
Roads and Postcodes in Ashdown
Navigate through our locations to find the location of your next house in Ashdown, St Leonards-on-sea for sale or to rent.
| Streets | Postcodes |
|---|---|
| Agincourt Close | TN37 7QL |
| Applewood Close | TN37 7JS |
| Augustus Way | TN37 7NP TN37 7NR |
| Battle Crescent | TN37 7AW |
| Battle Road | TN37 7BA TN37 7BN TN37 7BP TN37 7NY TN37 7AL TN37 7BJ TN37 7BU TN38 8EZ |
| Beachy Head View | TN38 8EW TN38 8EY |
| Beauharrow Road | TN37 7BL |
| Beauport Gardens | TN37 7PQ |
| Beauport Home Farm Close | TN37 7BW |
| Bellingham Close | TN37 7QH |
| Bower Close | TN37 7JX |
| Bowsprit Mews | TN38 8ER |
| Brede Close | TN37 7QT |
| Broad Buckler | TN37 7QR |
| Brookdale | TN37 7FE |
| Campkin Gardens | TN37 7FD |
| Carinus Gardens | TN37 7NS |
| Carvel Court | TN38 8EX |
| Clarendon Close | TN37 7JQ |
| Cooden Ledge | TN38 8ET |
| Coxheath Close | TN38 8ES |
| Coxswain Gardens | TN38 8BS |
| Crecy Close | TN37 7QN |
| Delaware Drive | TN37 7TJ TN37 7TL |
| Downey Close | TN37 7LJ |
| Eisenhower Drive | TN37 7TQ |
| Eldridge Way | TN37 7FP |
| Fairfax Avenue | TN37 7TD |
| Fleetwood Close | TN37 7RU |
| Fletcher Avenue | TN37 7QU TN37 7QX |
| Hadrian Gardens | TN37 7NT |
| Harbour Way | TN38 8EP TN38 8EU |
| Harlequin Gardens | TN37 7PF |
| Harrow Lane | TN37 7JR TN37 7JY TN37 7PR TN37 7JT TN37 7JZ |
| Helmsman Rise | TN38 8BQ |
| High Beech Chalet Park | TN37 7BS |
| High Beech Close | TN37 7BZ TN37 7TT |
| Highwater View | TN38 8EL |
| Hollinghurst Close | TN37 7JU |
| Hollinghurst Road | TN37 7JP |
| Holmhurst Lane | TN37 7LN TN37 7LW |
| Hoover Close | TN37 7TA |
| Jefferson Way | TN37 7TS |
| John Macadam Way | TN37 7DB TN37 7SQ |
| Johnson Close | TN37 7BG |
| Kingsley Close | TN37 7BX |
| Knowsley Court | TN37 7RX |
| Laleham Close | TN37 7JH |
| Ledsham Avenue | TN37 7LE |
| Ledsham Close | TN37 7LF |
| Ledsham Park | TN37 7LQ |
| Ledsham Way | TN37 7LG |
| Lower Glen Road | TN37 7AR |
| Maple Heights | TN37 7LZ |
| Maplehurst Close | TN37 7NB |
| Maplehurst Rise | TN37 7ND |
| Maplehurst Road | TN37 7NA |
| Marcus Gardens | TN37 7NW |
| Mare Bay Close | TN38 8EQ |
| Marlow Drive | TN37 7JF |
| Mistral Close | TN37 7RY |
| Monarch Gardens | TN37 7EW |
| Montana Court | TN37 7TR |
| Paddock Road | TN37 7JJ |
| Park Cottages | TN37 7BH |
| Pierwarden Mews | TN38 8BW |
| Plough Lane | TN37 7LH |
| Queensway Avenue South | TN38 9AG |
| Regent Place | TN37 7QG |
| Roundwood Road | TN37 7LA TN37 7LD |
| Sandy Close | TN37 7LB |
| Sedlescombe Road North | TN37 7JL TN37 7JN TN37 7PB TN37 7PD TN37 7PG TN37 7EL TN37 7GA TN37 7NL TN37 7PE TN37 7PY TN37 7SF |
| Seven Acre Close | TN37 7QB TN37 7QD TN37 7QF |
| Shardan Place | TN37 7GD |
| Shingle Court | TN38 8EF |
| Shirley Drive | TN37 7JW |
| St Kitts Close | TN37 7TB |
| Stockton View | TN37 7FJ |
| Stonebeach Rise | TN38 8EN |
| Stonelink Close | TN37 7QS |
| The Beeches | TN37 7TU |
| The Hoe | TN37 7LL |
| The Ridge | TN37 7PS TN37 7PX |
| The Ridge West | TN37 7PP TN37 7PJ |
| The Russets | TN37 7FA |
| The Willows | TN37 7PA |
| Thomas Brassey Close | TN37 7QY |
| Towerscroft Avenue | TN37 7JB TN37 7JE |
| Trafalgar Close | TN37 7QP |
| Truman Drive | TN37 7TH |
| Twyford Crescent | TN37 7JA |
| Upper Church Road | TN37 7AS TN37 7AT TN37 7AU |
| Upper Glen Road | TN37 7AX TN37 7AY TN37 7BY |
| Vermont Way | TN37 7TN |
| Wadhurst Close | TN37 7AZ |
| Walton Close | TN37 7JD |
| Washington Avenue | TN37 7TE TN37 7TG |
| Waterloo Close | TN37 7QW |
| Wayside | TN37 7PH |
| Welton Rise | TN37 7RA TN37 7RF TN37 7RG TN37 7RP TN37 7RS TN37 7RT TN37 7RQ |
| Whitworth Road | TN37 7PZ |
| Wood View | TN37 7FL |
| TN37 7FH |
Transport near Ashdown
-
Crowhurst Station
-
St.Leonards Warrior Square Station
-
West St Leonards Station
-
Hastings Station
-
Ore Station
- FAQ
- Price Paid By Year
- Property Type Price
Frequently asked questions about Ashdown
What is the average price for a property for sale in Ashdown?
The average price for a property for sale in Ashdown is £367,119. This amount is 25% higher than the average price in St Leonards-on-sea. There are 1,326 property listings for sale in Ashdown.
What streets have the most expensive properties for sale in Ashdown?
The streets with the most expensive properties for sale in Ashdown are The Russets at an average of £635,000, Campkin Gardens at an average of £586,666 and Truman Drive at an average of £562,000.
What streets have the most affordable properties for sale in Ashdown?
The streets with the most affordable properties for sale in Ashdown are High Beech Chalet Park at an average of £172,833, Pierwarden Mews at an average of £225,517 and Helmsman Rise at an average of £226,250.
Which train stations are available in or near Ashdown?
Some of the train stations available in or near Ashdown are Crowhurst, St.Leonards Warrior Square and West St Leonards.
Property Price Paid in Ashdown by Year
The average sold property price by year was:
| Year | Average Sold Price | Price Change |
Sold Properties
|
|---|---|---|---|
| 2025 | £369,250 | 5% |
48 Properties |
| 2024 | £350,377 | -3% |
69 Properties |
| 2023 | £361,230 | -6% |
68 Properties |
| 2022 | £382,916 | 11% |
92 Properties |
| 2021 | £342,222 | 7% |
136 Properties |
| 2020 | £317,149 | 6% |
89 Properties |
| 2019 | £298,110 | -3% |
90 Properties |
| 2018 | £307,987 | 4% |
111 Properties |
| 2017 | £296,075 | 3% |
110 Properties |
| 2016 | £286,495 | 15% |
101 Properties |
| 2015 | £242,198 | 1% |
130 Properties |
| 2014 | £240,591 | 13% |
121 Properties |
| 2013 | £210,490 | -2% |
111 Properties |
| 2012 | £215,038 | 4% |
88 Properties |
| 2011 | £206,714 | -3% |
94 Properties |
| 2010 | £212,961 | 11% |
76 Properties |
| 2009 | £190,163 | -10% |
73 Properties |
| 2008 | £208,404 | -4% |
64 Properties |
| 2007 | £216,002 | 1% |
196 Properties |
| 2006 | £214,290 | 13% |
206 Properties |
| 2005 | £187,213 | -8% |
168 Properties |
| 2004 | £201,824 | 4% |
159 Properties |
| 2003 | £193,804 | 22% |
129 Properties |
| 2002 | £151,253 | 12% |
204 Properties |
| 2001 | £133,114 | 20% |
211 Properties |
| 2000 | £106,912 | 19% |
139 Properties |
| 1999 | £87,122 | 12% |
164 Properties |
| 1998 | £76,446 | 4% |
132 Properties |
| 1997 | £73,131 | 1% |
139 Properties |
| 1996 | £72,077 | -0,4% |
158 Properties |
| 1995 | £72,383 | - |
106 Properties |
Property Price per Property Type in Ashdown
Here you can find historic sold price data in order to help with your property search.
The average Property Paid Price for specific property types in the last three years are:
| Property Type | Average Sold Price | Sold Properties |
|---|---|---|
| Semi Detached House | £321,491.00 | 67 Semi Detached Houses |
| Detached House | £454,846.00 | 135 Detached Houses |
| Terraced House | £289,318.00 | 44 Terraced Houses |
| Flat | £194,125.00 | 31 Flats |

