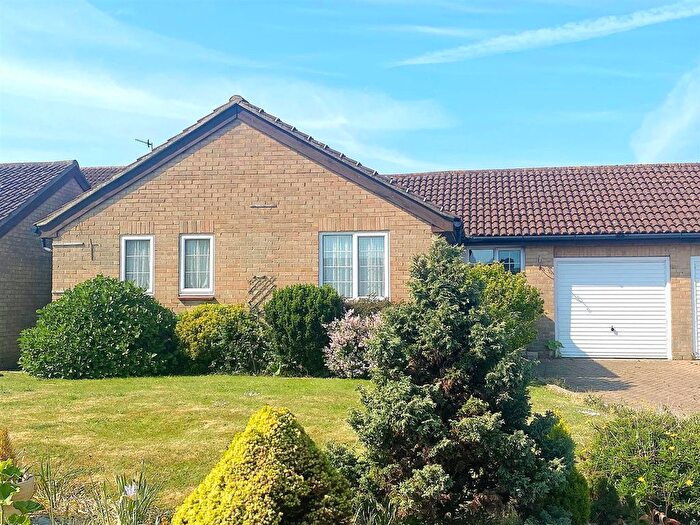
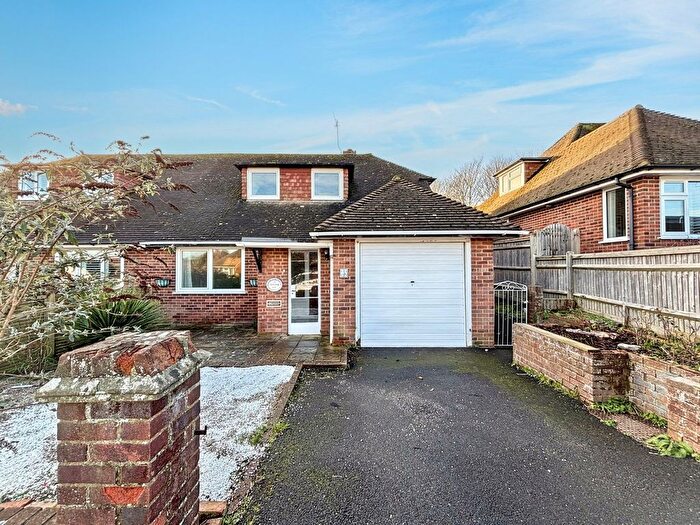
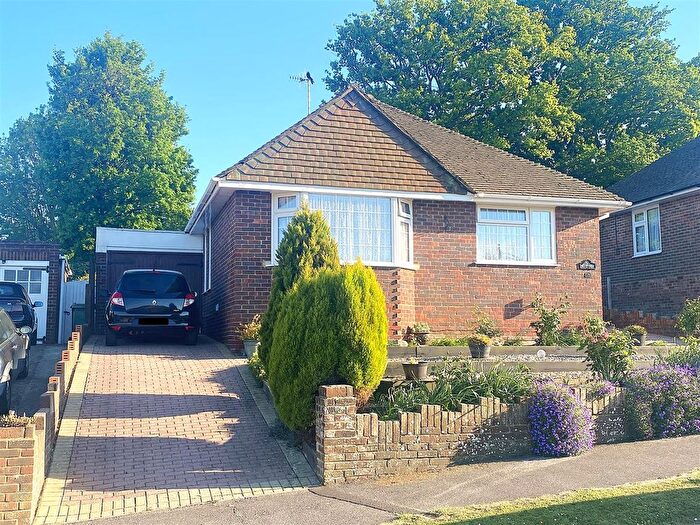
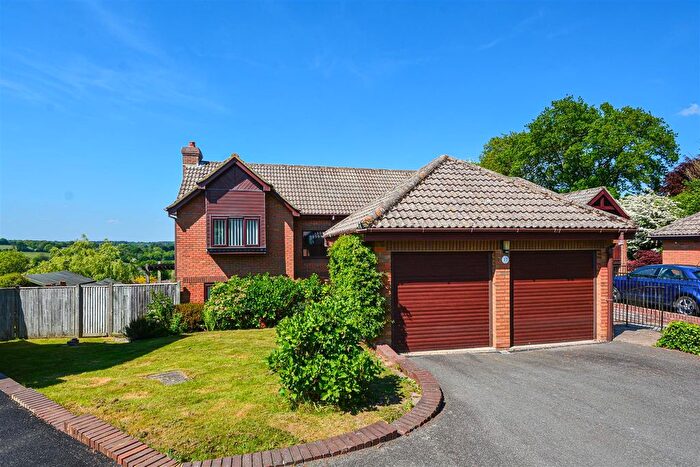
Houses for sale & to rent in Crowhurst, Battle
House Prices in Crowhurst
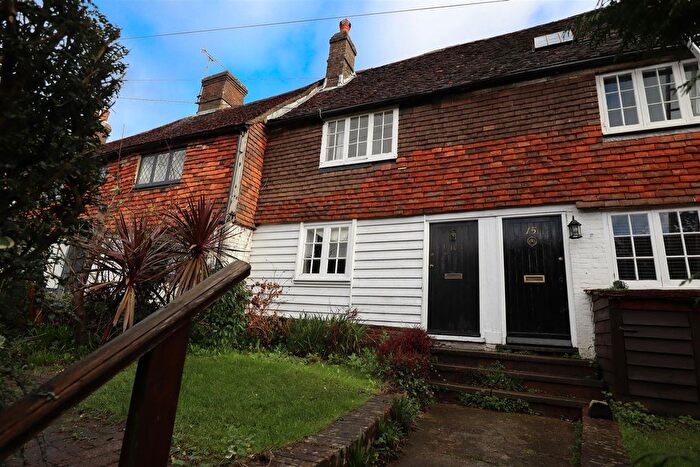
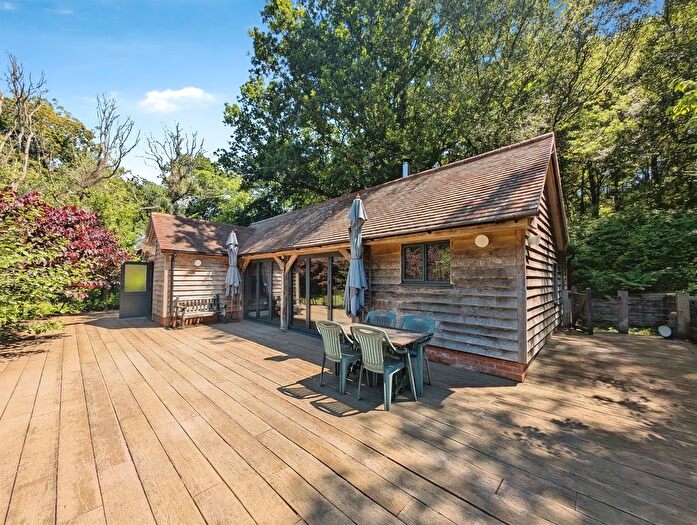
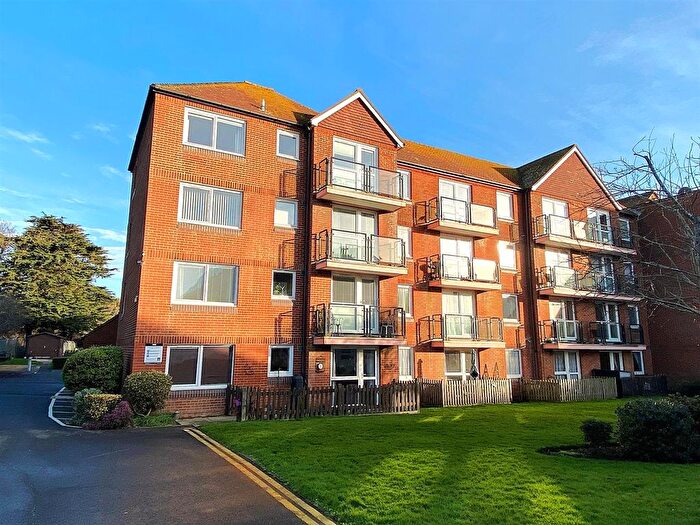
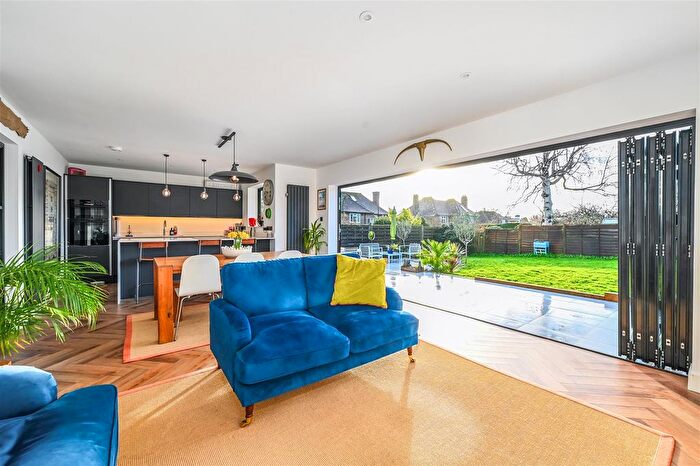
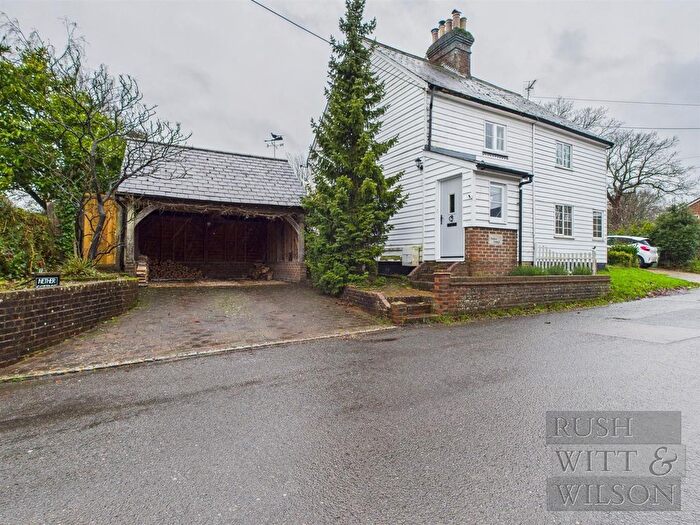
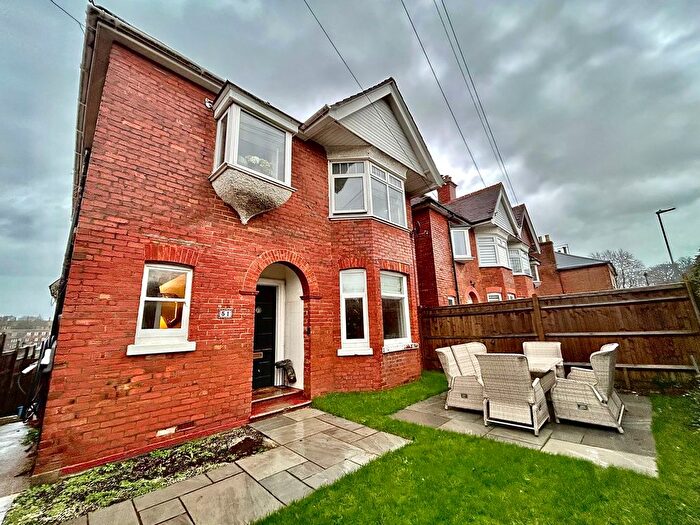
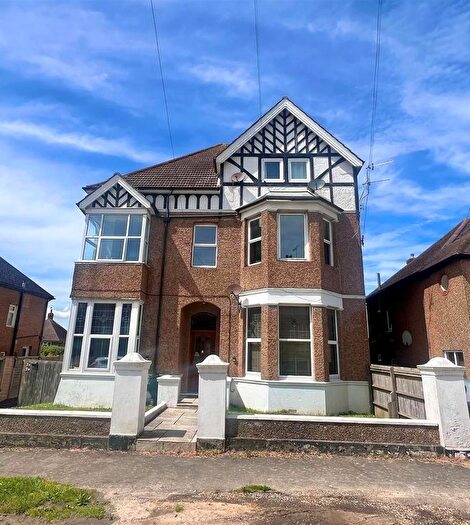
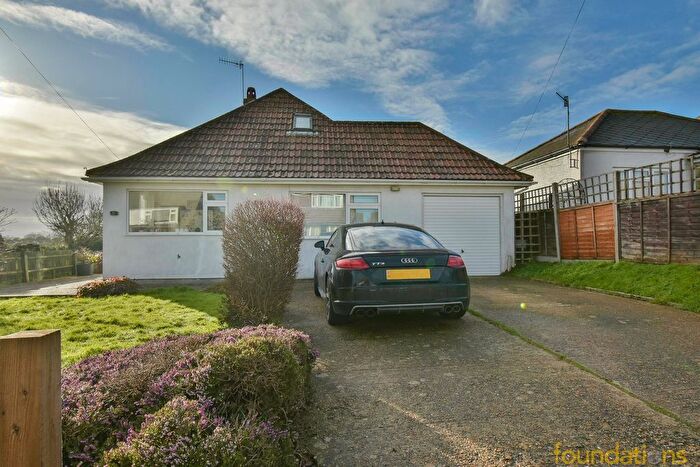
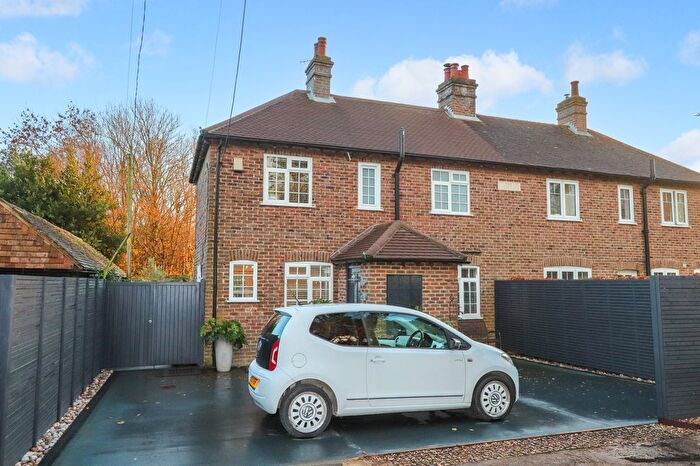
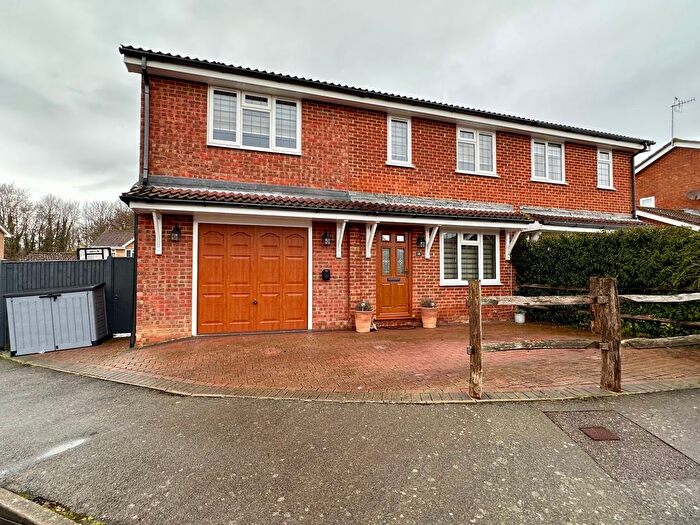
Properties in Crowhurst have an average house price of £591,012.00 and had 65 Property Transactions within the last 3 years¹.
Crowhurst is an area in Battle, East Sussex with 897 households², where the most expensive property was sold for £2,100,000.00.
Properties for sale in Crowhurst
Roads and Postcodes in Crowhurst
Navigate through our locations to find the location of your next house in Crowhurst, Battle for sale or to rent.
| Streets | Postcodes |
|---|---|
| Agmerhurst Farm Cottages | TN33 9NA |
| Akehurst Field | TN33 9LW |
| Ballards Hill | TN33 9DA |
| Beauport Park | TN33 0SQ |
| Blacksmiths Field | TN33 9AX |
| Blacksmiths Lane | TN33 9DS |
| Brays Hill | TN33 9NZ |
| Broadley View | TN33 9RG |
| Brown Bread Street | TN33 9NX |
| Catsfield Road | TN33 9BU TN33 9LN |
| Church Lane | TN33 9DR |
| Church Road | TN33 9BG TN33 9DP TN33 9NU |
| Compass Lane | TN33 9NG |
| Court Lodge Cottages | TN33 9PJ |
| Craig Close | TN33 9DE |
| Crowders Lane | TN33 9LP |
| Crowhurst Road | TN33 9BT |
| Forewood Lane | TN33 9AB TN33 9AG TN33 9AJ TN33 9DG |
| Forewood Rise | TN33 9AH |
| Frickley Lane | TN33 9LT TN33 9LU |
| Hastings Road | TN33 0SH TN33 0TE TN33 0TF TN33 0TG TN33 0TH TN33 0TL TN33 0TN TN33 0TP TN33 0TQ TN33 0TR TN33 0TS TN33 0TU TN33 0TW |
| Henley Down | TN33 9BN TN33 9BP |
| Horns Corner | TN33 9DT |
| Kitchenham Road | TN33 9NP |
| Normanby Cliff Road | TN33 9PD |
| Normanhurst | TN33 9LS |
| Old Forewood Lane | TN33 9AA TN33 9AE |
| Park View | TN33 9AL |
| Penhurst Lane | TN33 9QN TN33 9QS TN33 9QT |
| Potmans Lane | TN33 9BJ |
| Powdermill Lane | TN33 0SZ |
| Royal Oak Lane | TN33 9BX TN33 9BY |
| Sampsons Lane | TN33 9AU |
| Sandrock Crescent | TN33 9AS |
| Sandrock Hill | TN33 9AY |
| Skinners Lane | TN33 9DN |
| Station Road | TN33 9DB TN33 9DD |
| Stevens Crouch | TN33 9LR |
| Stone Cottages | TN33 9DU |
| Telham Lane | TN33 0SN TN33 0SS TN33 0SW |
| The Forge | TN33 9PH |
| The Furnace | TN33 9PG |
| The Gardens | TN33 9LL |
| The Green | TN33 9DJ |
| The Pound | TN33 9NY |
| The Stream | TN33 9BB TN33 9BD TN33 9BE |
| Twisly Cottages | TN33 9BH |
| Woodland Way | TN33 9AP |
| TN33 9AN TN33 9AR TN33 9AT TN33 9AW TN33 9DL TN33 9PB TN33 9PE |
Transport near Crowhurst
-
Battle Station
-
Crowhurst Station
-
Bexhill Station
-
Collington Station
-
West St Leonards Station
-
Cooden Beach Station
- FAQ
- Price Paid By Year
- Property Type Price
Frequently asked questions about Crowhurst
What is the average price for a property for sale in Crowhurst?
The average price for a property for sale in Crowhurst is £591,012. This amount is 23% higher than the average price in Battle. There are 7,917 property listings for sale in Crowhurst.
What streets have the most expensive properties for sale in Crowhurst?
The streets with the most expensive properties for sale in Crowhurst are Stone Cottages at an average of £886,666, Forewood Lane at an average of £825,000 and The Forge at an average of £725,000.
What streets have the most affordable properties for sale in Crowhurst?
The streets with the most affordable properties for sale in Crowhurst are Craig Close at an average of £332,375, Forewood Rise at an average of £346,166 and Church Road at an average of £360,560.
Which train stations are available in or near Crowhurst?
Some of the train stations available in or near Crowhurst are Battle, Crowhurst and Bexhill.
Property Price Paid in Crowhurst by Year
The average sold property price by year was:
| Year | Average Sold Price | Price Change |
Sold Properties
|
|---|---|---|---|
| 2025 | £486,333 | -15% |
3 Properties |
| 2024 | £557,335 | 8% |
16 Properties |
| 2023 | £511,688 | -35% |
21 Properties |
| 2022 | £691,760 | 18% |
25 Properties |
| 2021 | £564,823 | -2% |
46 Properties |
| 2020 | £575,892 | 17% |
28 Properties |
| 2019 | £475,307 | 11% |
26 Properties |
| 2018 | £420,944 | -19% |
18 Properties |
| 2017 | £499,900 | 12% |
30 Properties |
| 2016 | £440,710 | -6% |
32 Properties |
| 2015 | £465,962 | 17% |
43 Properties |
| 2014 | £385,200 | 6% |
47 Properties |
| 2013 | £363,048 | 20% |
31 Properties |
| 2012 | £289,594 | -25% |
19 Properties |
| 2011 | £361,866 | 7% |
30 Properties |
| 2010 | £338,248 | 1% |
28 Properties |
| 2009 | £335,742 | -34% |
33 Properties |
| 2008 | £451,527 | 15% |
18 Properties |
| 2007 | £383,822 | 6% |
35 Properties |
| 2006 | £358,946 | 8% |
42 Properties |
| 2005 | £329,786 | 4% |
40 Properties |
| 2004 | £317,106 | 16% |
29 Properties |
| 2003 | £267,729 | 9% |
43 Properties |
| 2002 | £243,325 | 17% |
29 Properties |
| 2001 | £202,932 | 8% |
37 Properties |
| 2000 | £186,250 | 29% |
42 Properties |
| 1999 | £132,009 | -15% |
38 Properties |
| 1998 | £151,872 | 9% |
37 Properties |
| 1997 | £138,604 | -11% |
42 Properties |
| 1996 | £154,333 | 30% |
24 Properties |
| 1995 | £108,681 | - |
43 Properties |
Property Price per Property Type in Crowhurst
Here you can find historic sold price data in order to help with your property search.
The average Property Paid Price for specific property types in the last three years are:
| Property Type | Average Sold Price | Sold Properties |
|---|---|---|
| Semi Detached House | £441,846.00 | 13 Semi Detached Houses |
| Detached House | £712,998.00 | 40 Detached Houses |
| Terraced House | £356,078.00 | 11 Terraced Houses |
| Flat | £235,000.00 | 1 Flat |

